

The Key To Your Bracket: Relative Ratings
Use EvanMiya.com to win your bracket pool

Last updated: March 1st, 2026
In 2024, I introduced a new method for rating teams in college basketball called Relative Ratings. While many readers are probably familiar with how adjusted team efficiency metrics work, Relative Rating has a few distinctions:
Teams are ranked based on who is predicted to win each possible head-to-head matchup. If a team is ranked number one, they are predicted to beat every other team in the country in a theoretical neutral-court matchup. These matchup predictions are calculated using team-specific contextual variables to determine likely head-to-head game winners.
Several matchup-specific variables are used to obtain predictions for each potential game, including opponent strength, game pace, recent form, and consistency measurements.
You can read more about how it all works here.
As it turns out, the pre-tournament Relative Ratings at EvanMiya.com are very predictive of team success in March Madness. In particular, there are two ways in which these team ratings will give you a massive edge in your bracket pools: picking potential title-winners and identifying under-seeded teams.
Picking Title-Winners
We can easily identify which teams have a good shot at winning the national championship by using pre-tournament Relative Ratings from the previous seasons (which you can find on the Team Ratings page at EvanMiya.com). The last nine champions have had a Relative Rating within 6.5 points of the highest-rated team heading into the tournament. The table below shows each of these title-winners:
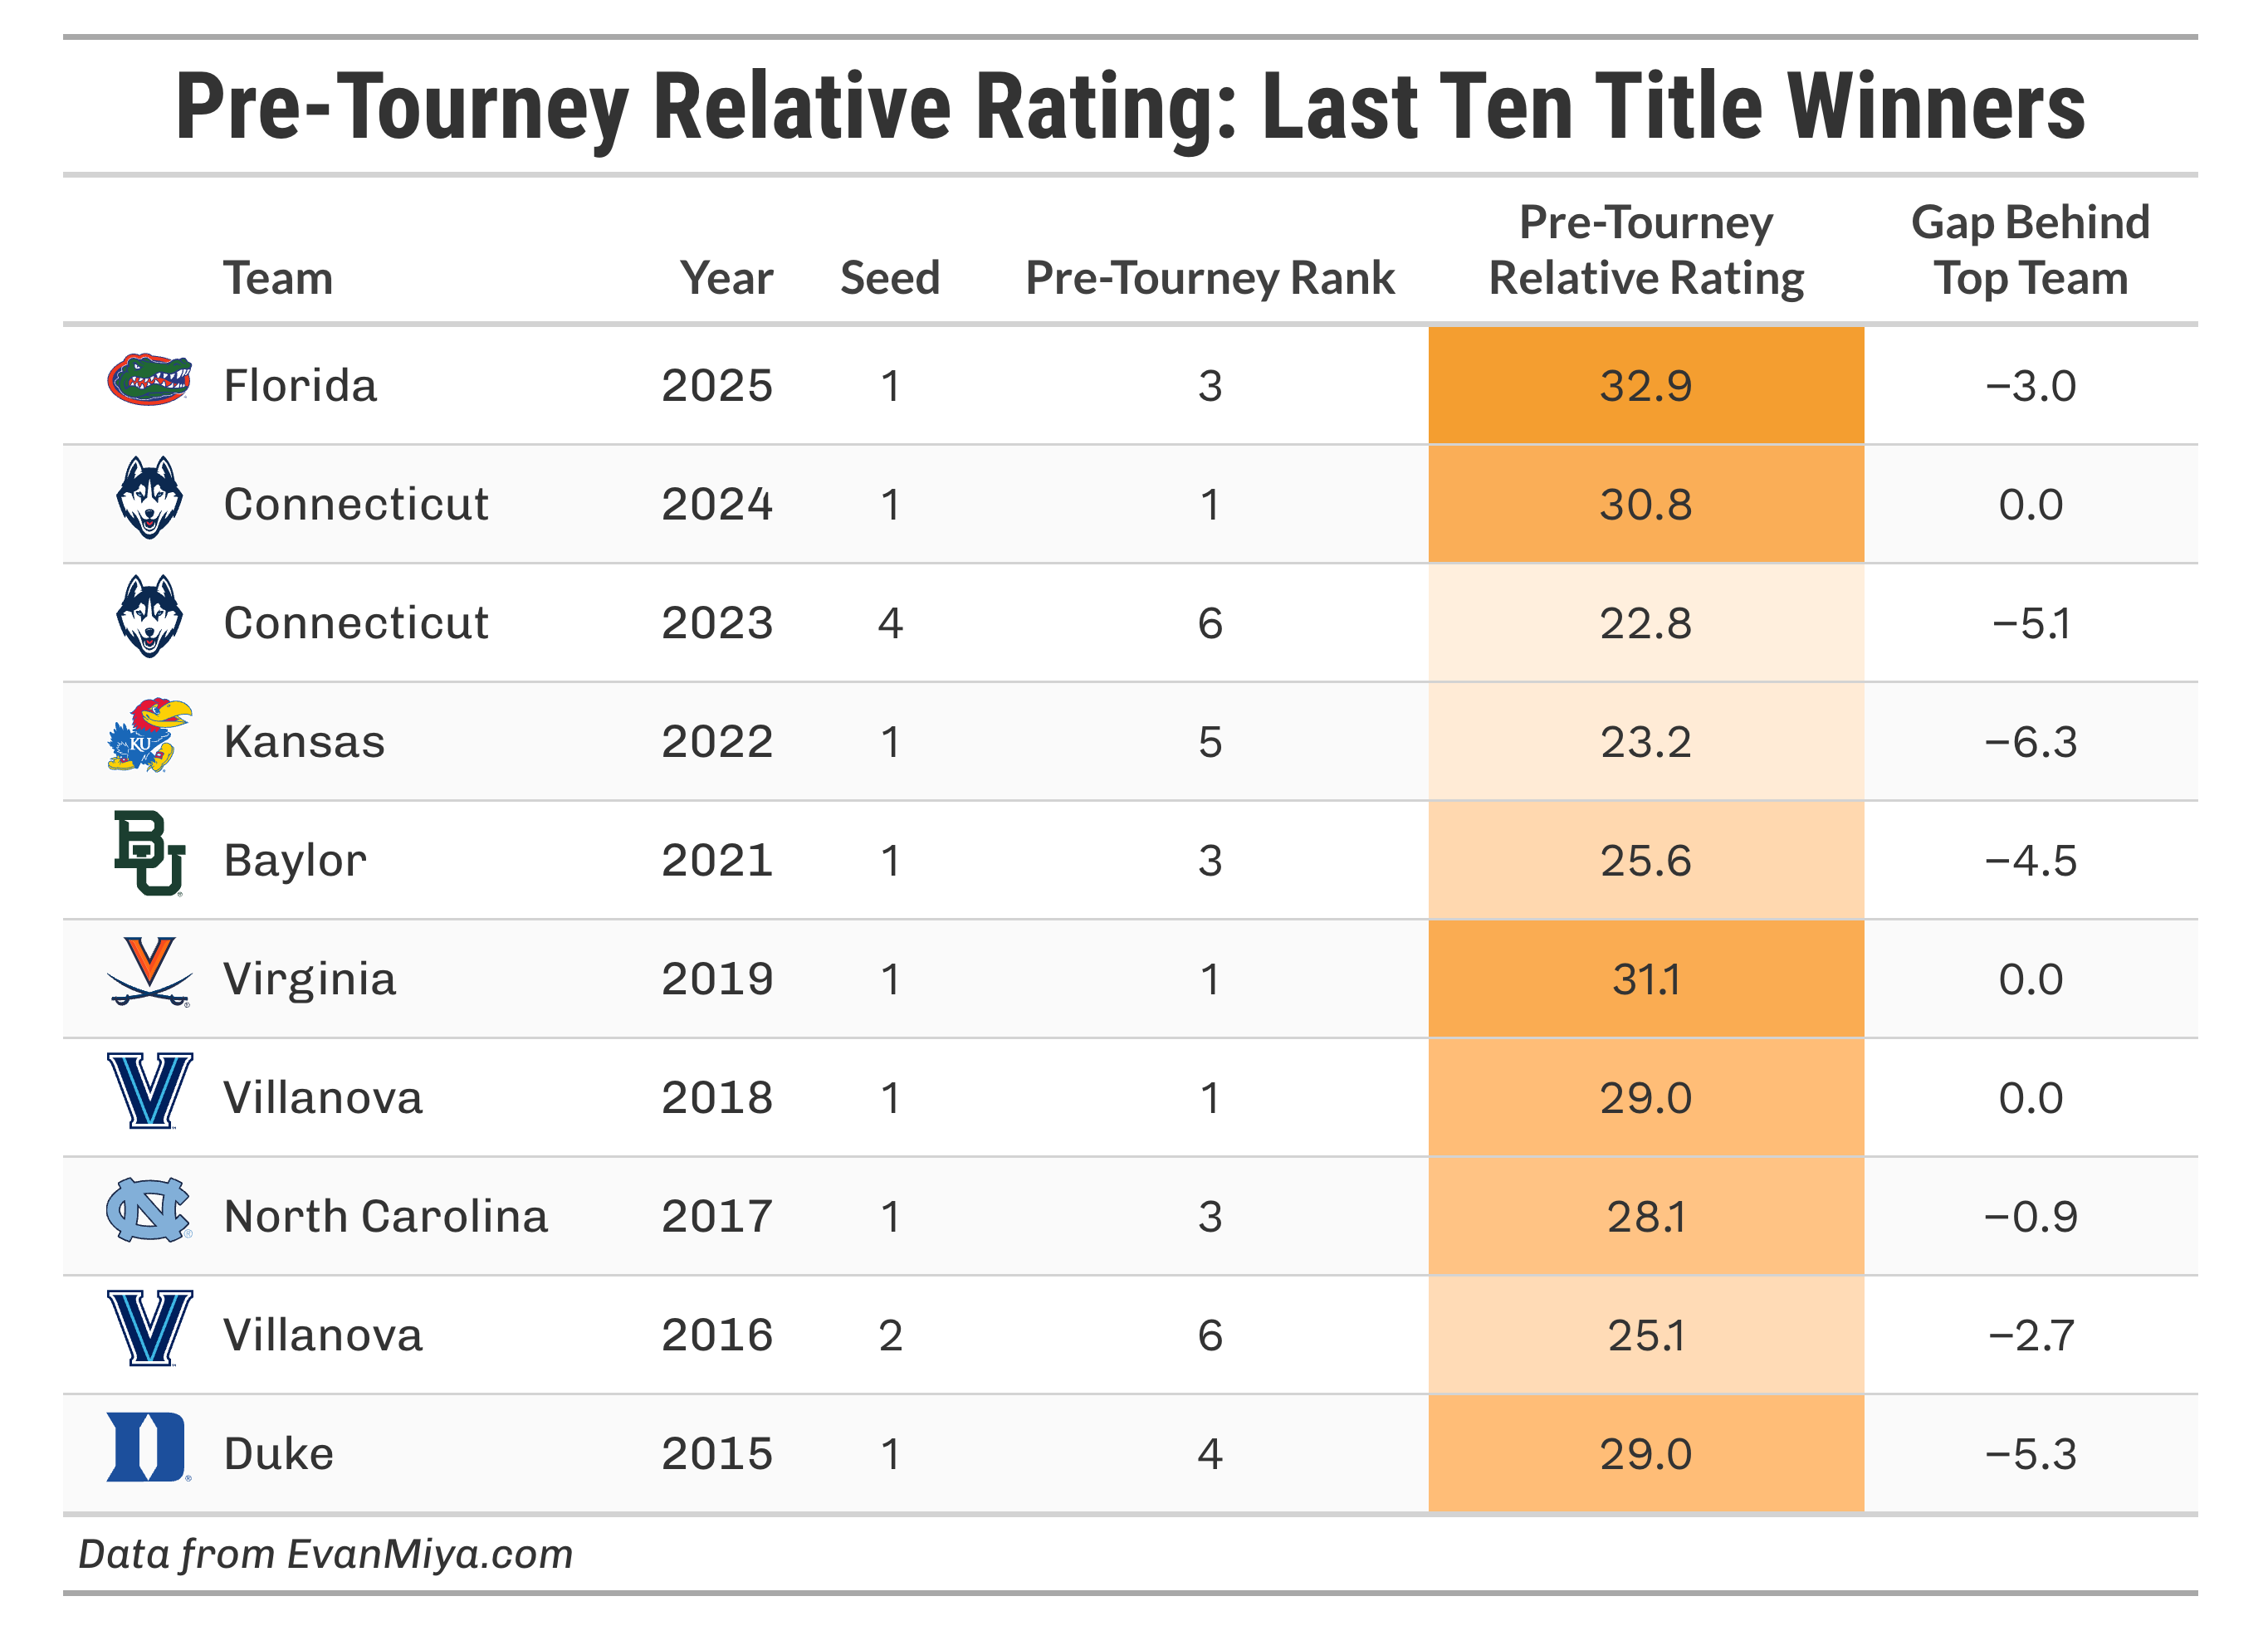
For example, in the 2024-25 season, according to Relative Rating, the highest-rated team heading into the tournament was Duke, with an RR of 35.9. There were three other teams with 6.5 points of Duke: Houston (34.0), Florida (32.9), and Auburn (30.1). Florida ended up winning that tournament.
When the bracket comes out on Selection Sunday this March, I will identify the teams that meet that criteria. To give a little wiggle room, I will select teams within 7 points of the best team in the sport. In a given year, between 5 and 10 teams typically qualify, but there have been as few as 3 and as many as 12. Today, the list of qualifying title favorites is moderate: Michigan, Duke, Arizona, Florida, Houston, Illinois, Purdue, and UConn. Iowa State is 7.5 behind Michigan, just missing the threshold. This will likely change some by Selection Sunday, but that group of teams have distanced themselves so much from everyone else that they have a much stronger chance at a title than the rest of the country.
Identifying Under-Seeded Teams
The teams that make the most noise in March are often the ones who are much stronger analytically than the other teams on their seed line. We can use Relative Ratings to identify these teams each season heading into the tournament.
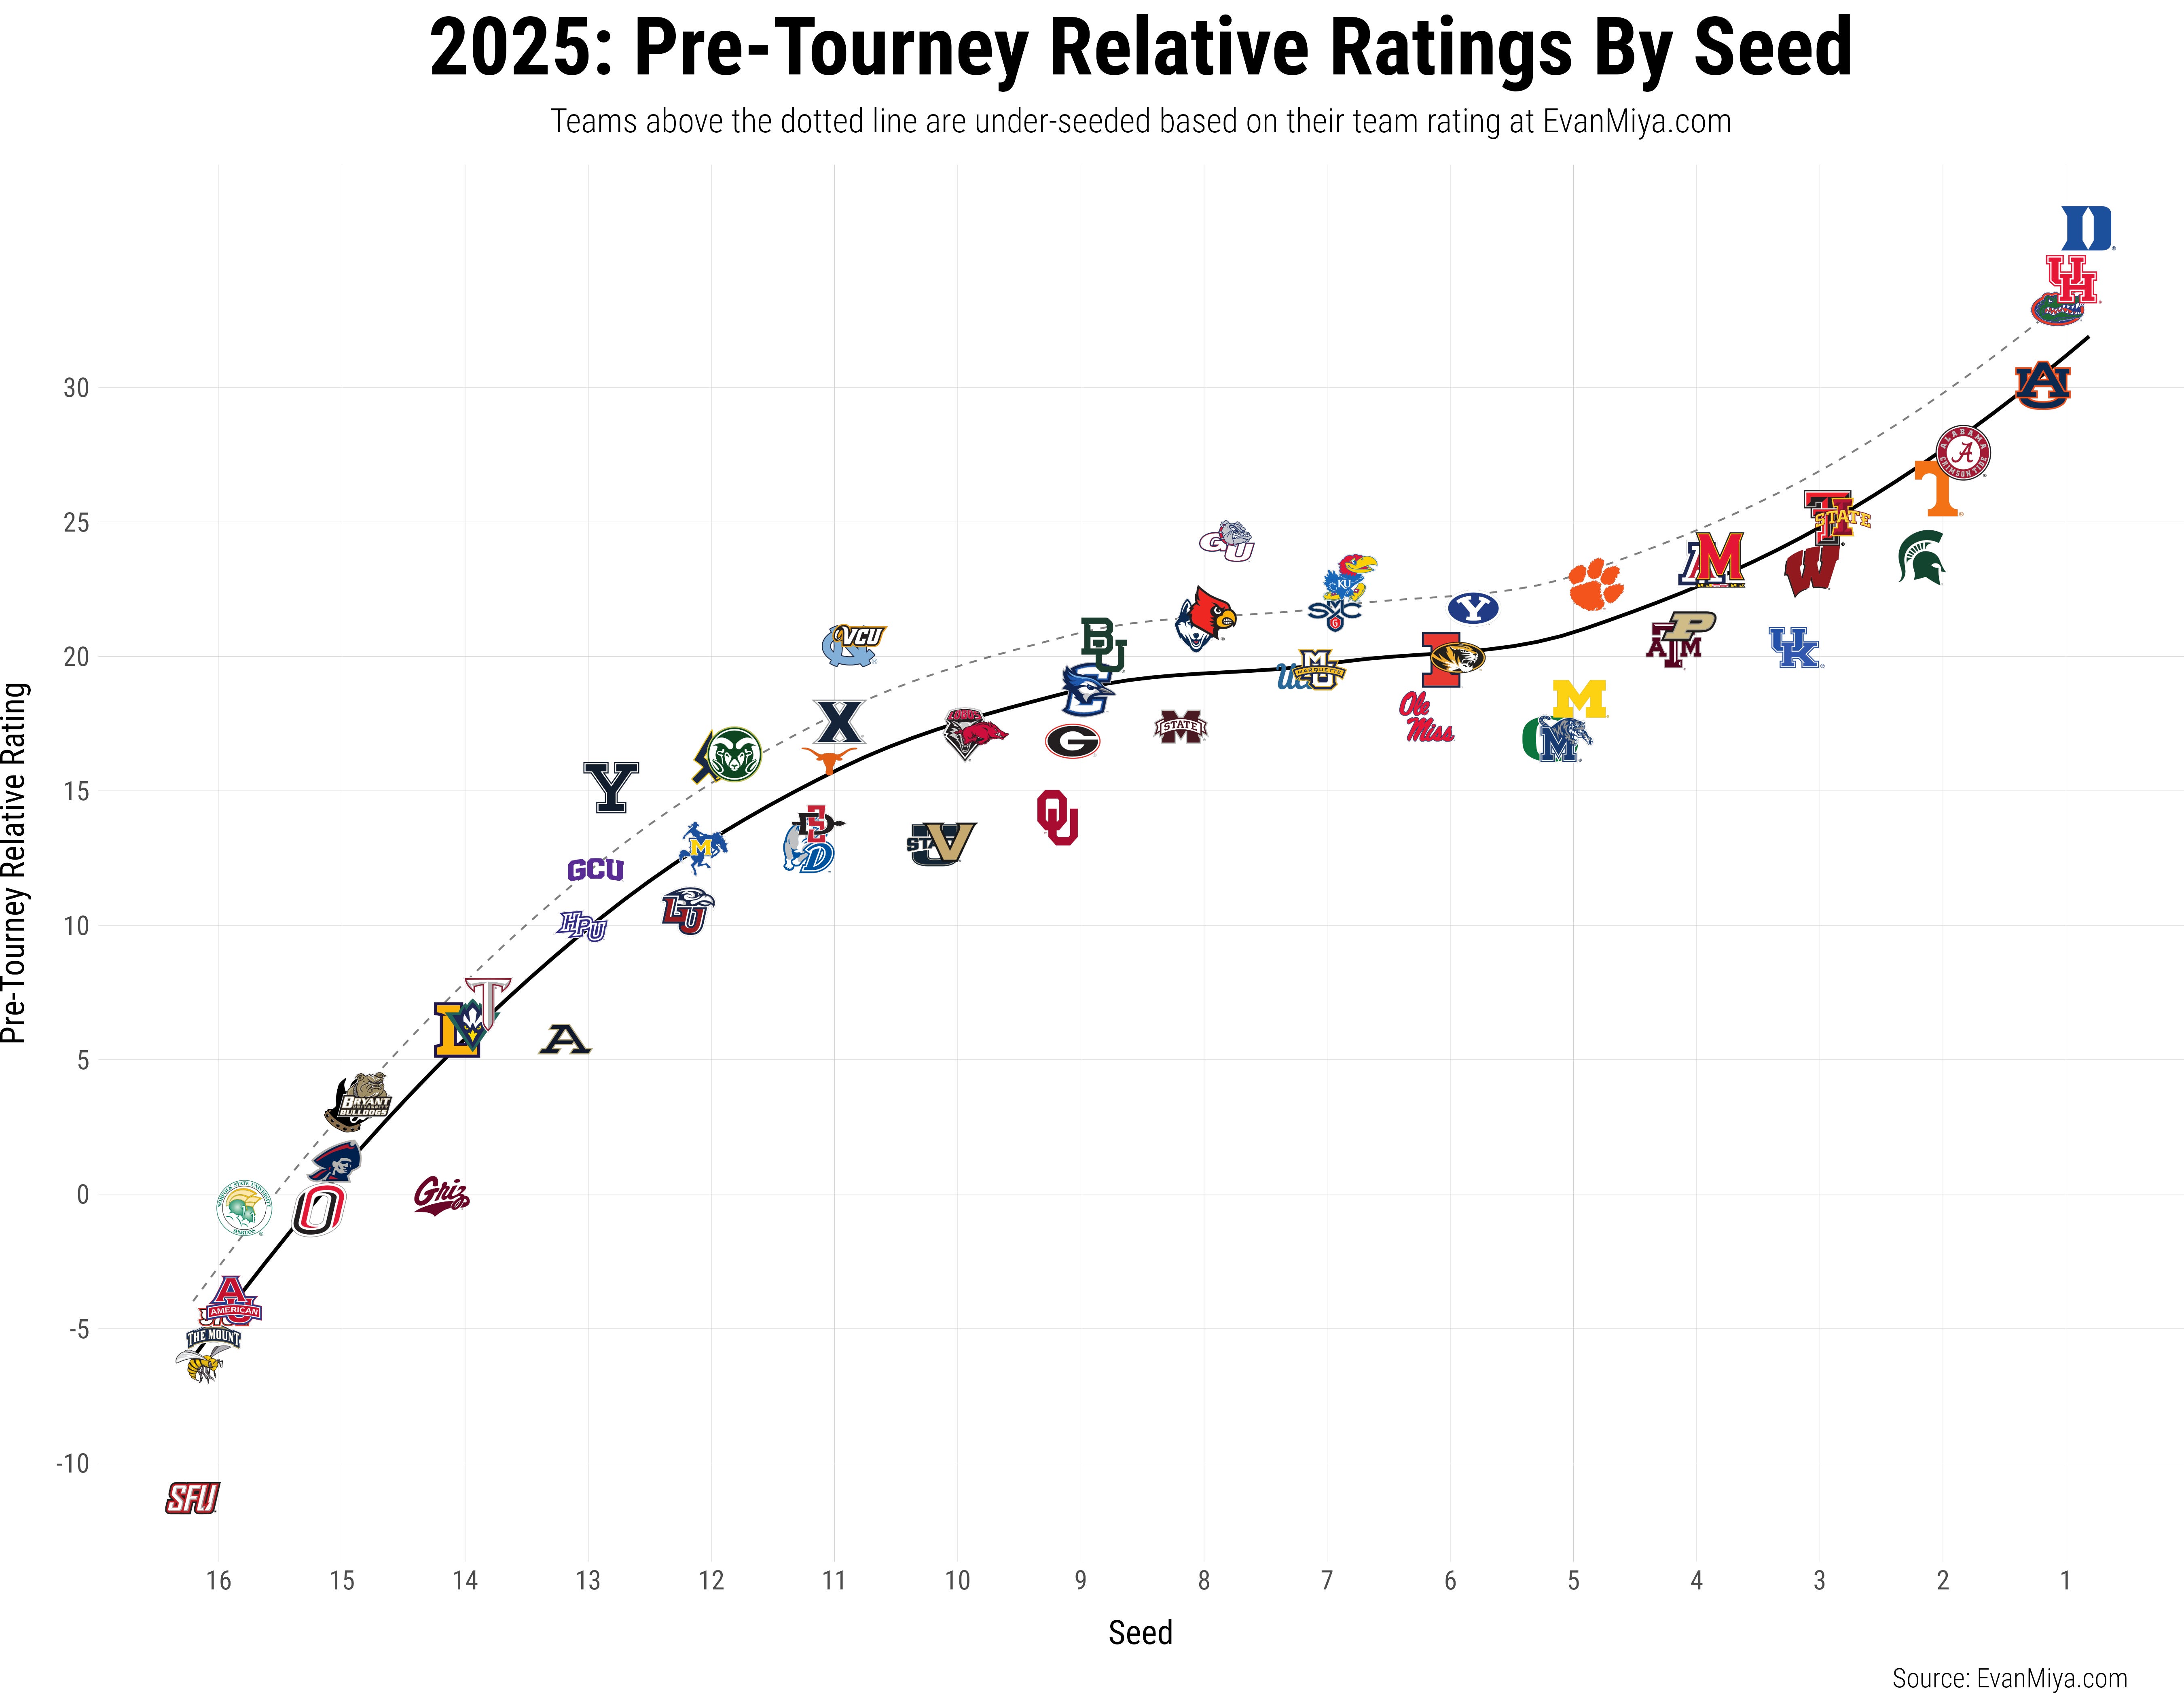
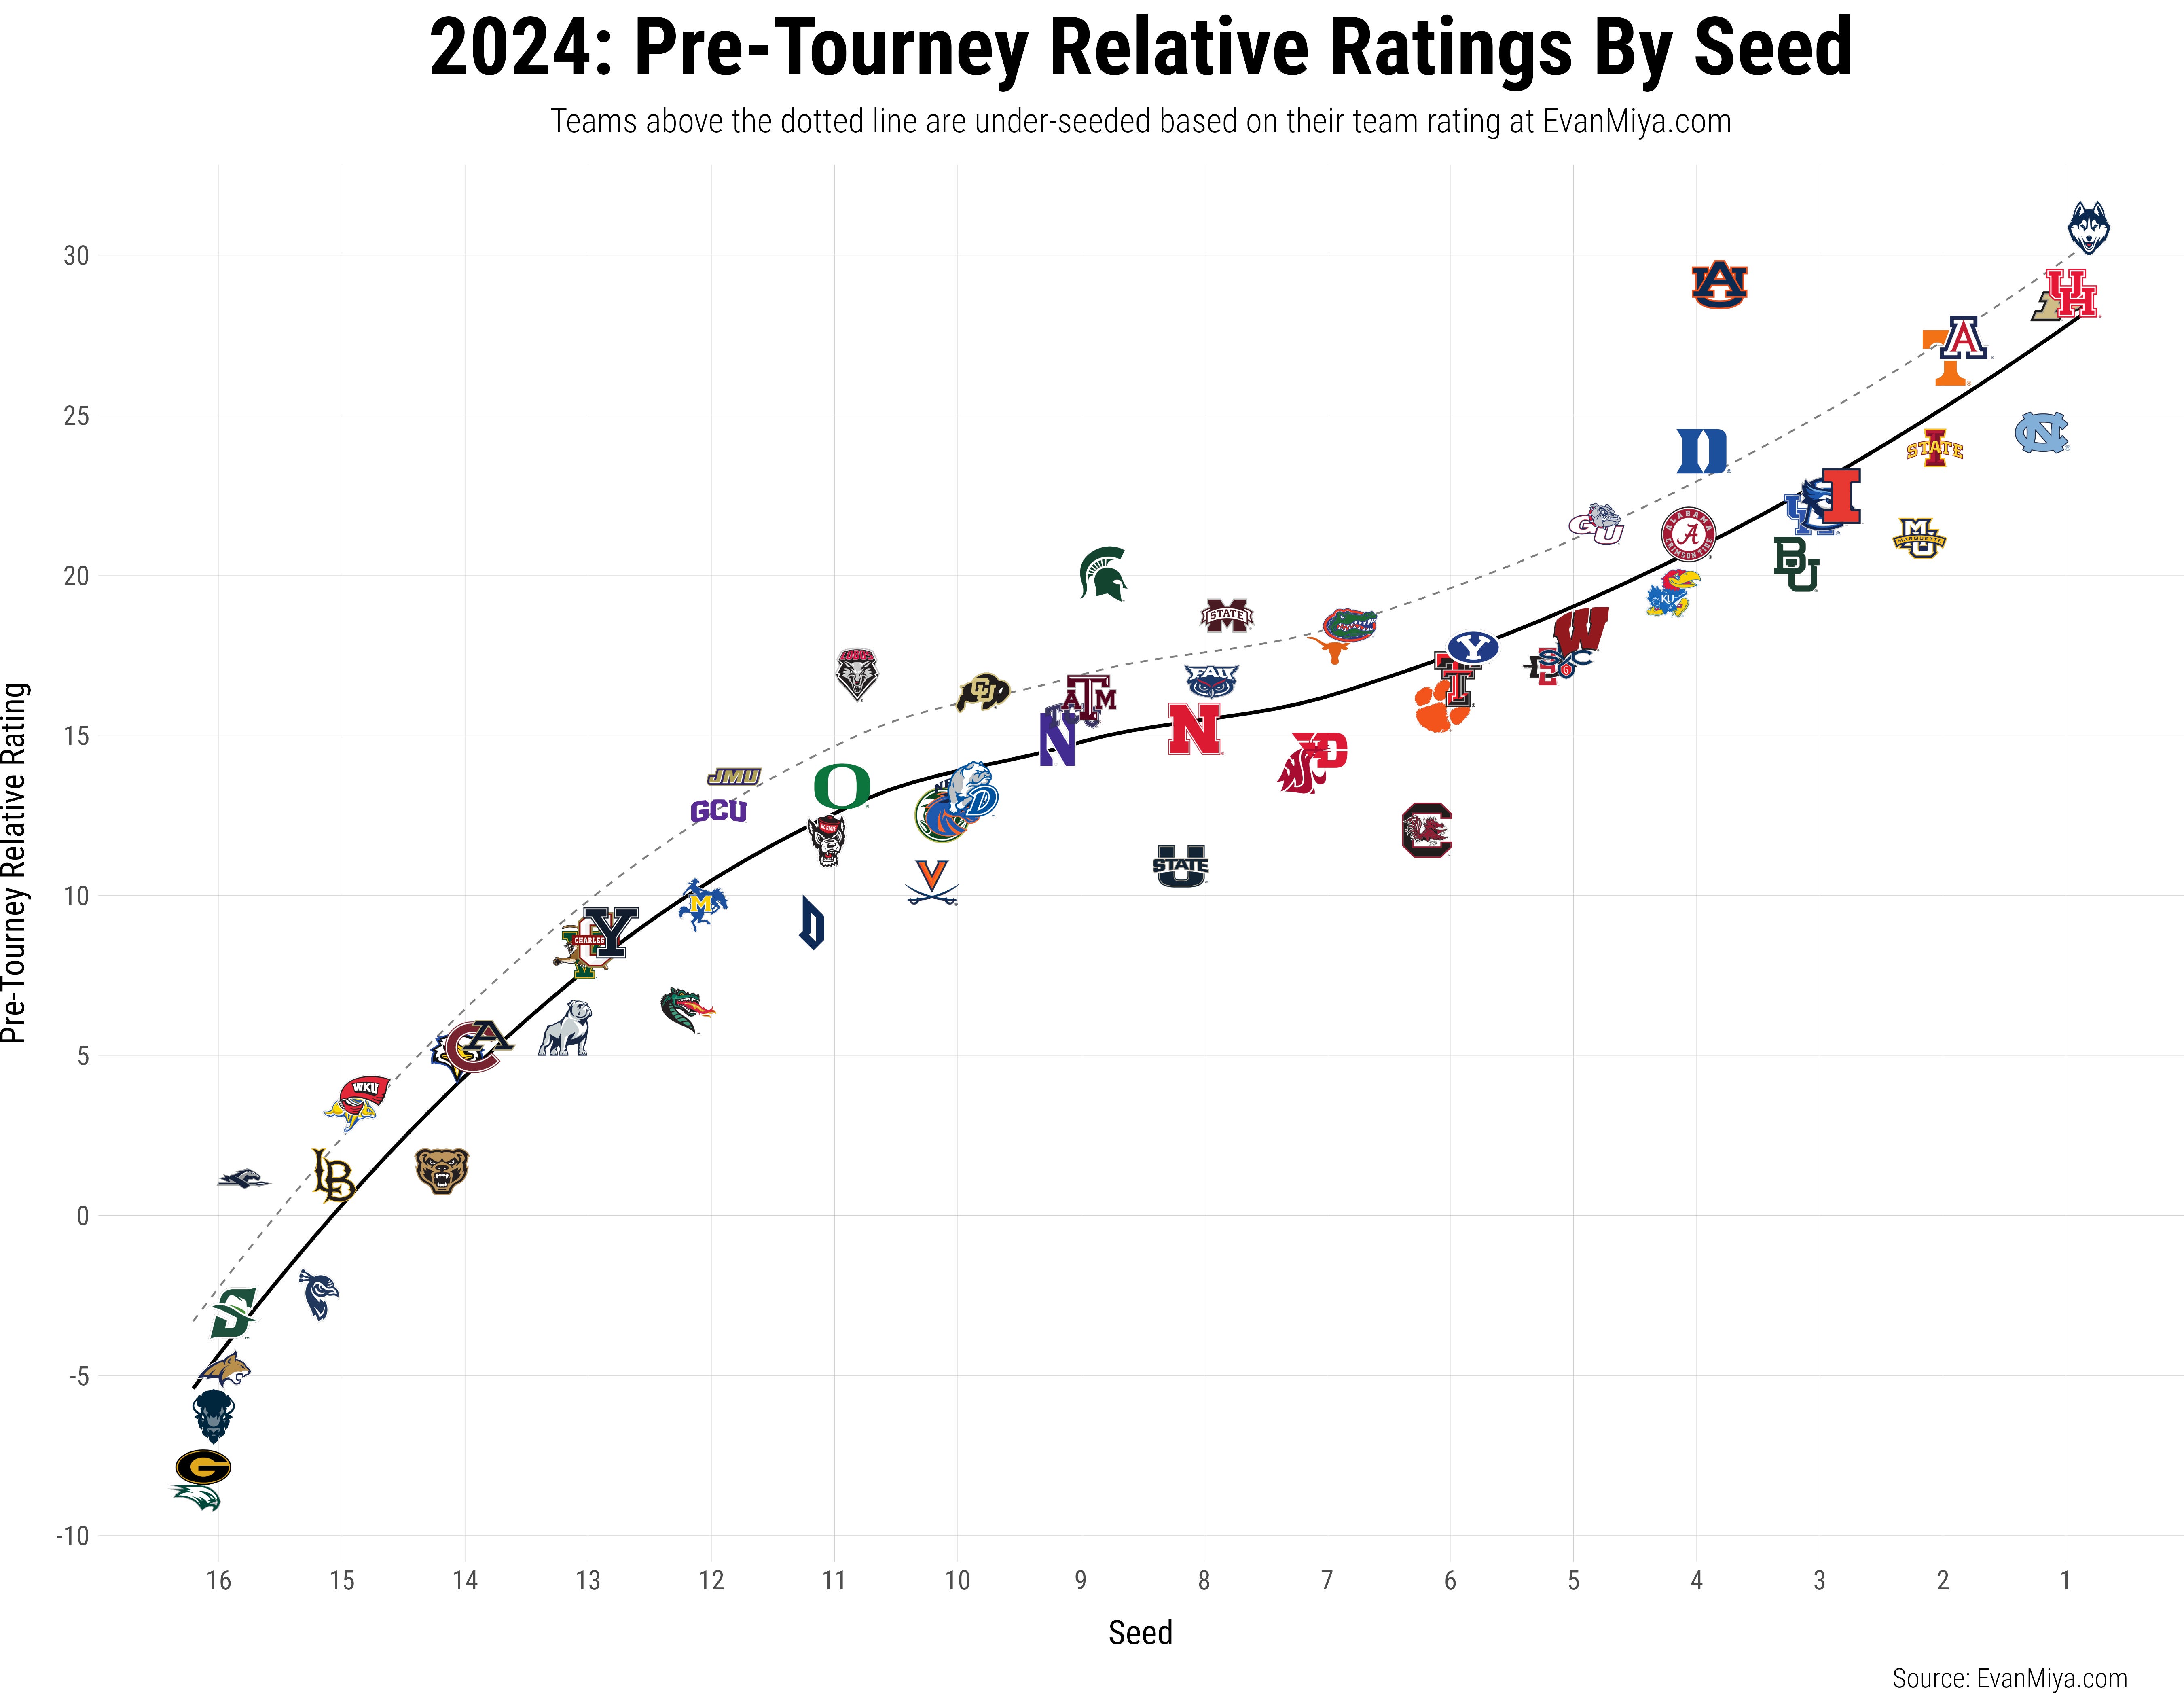
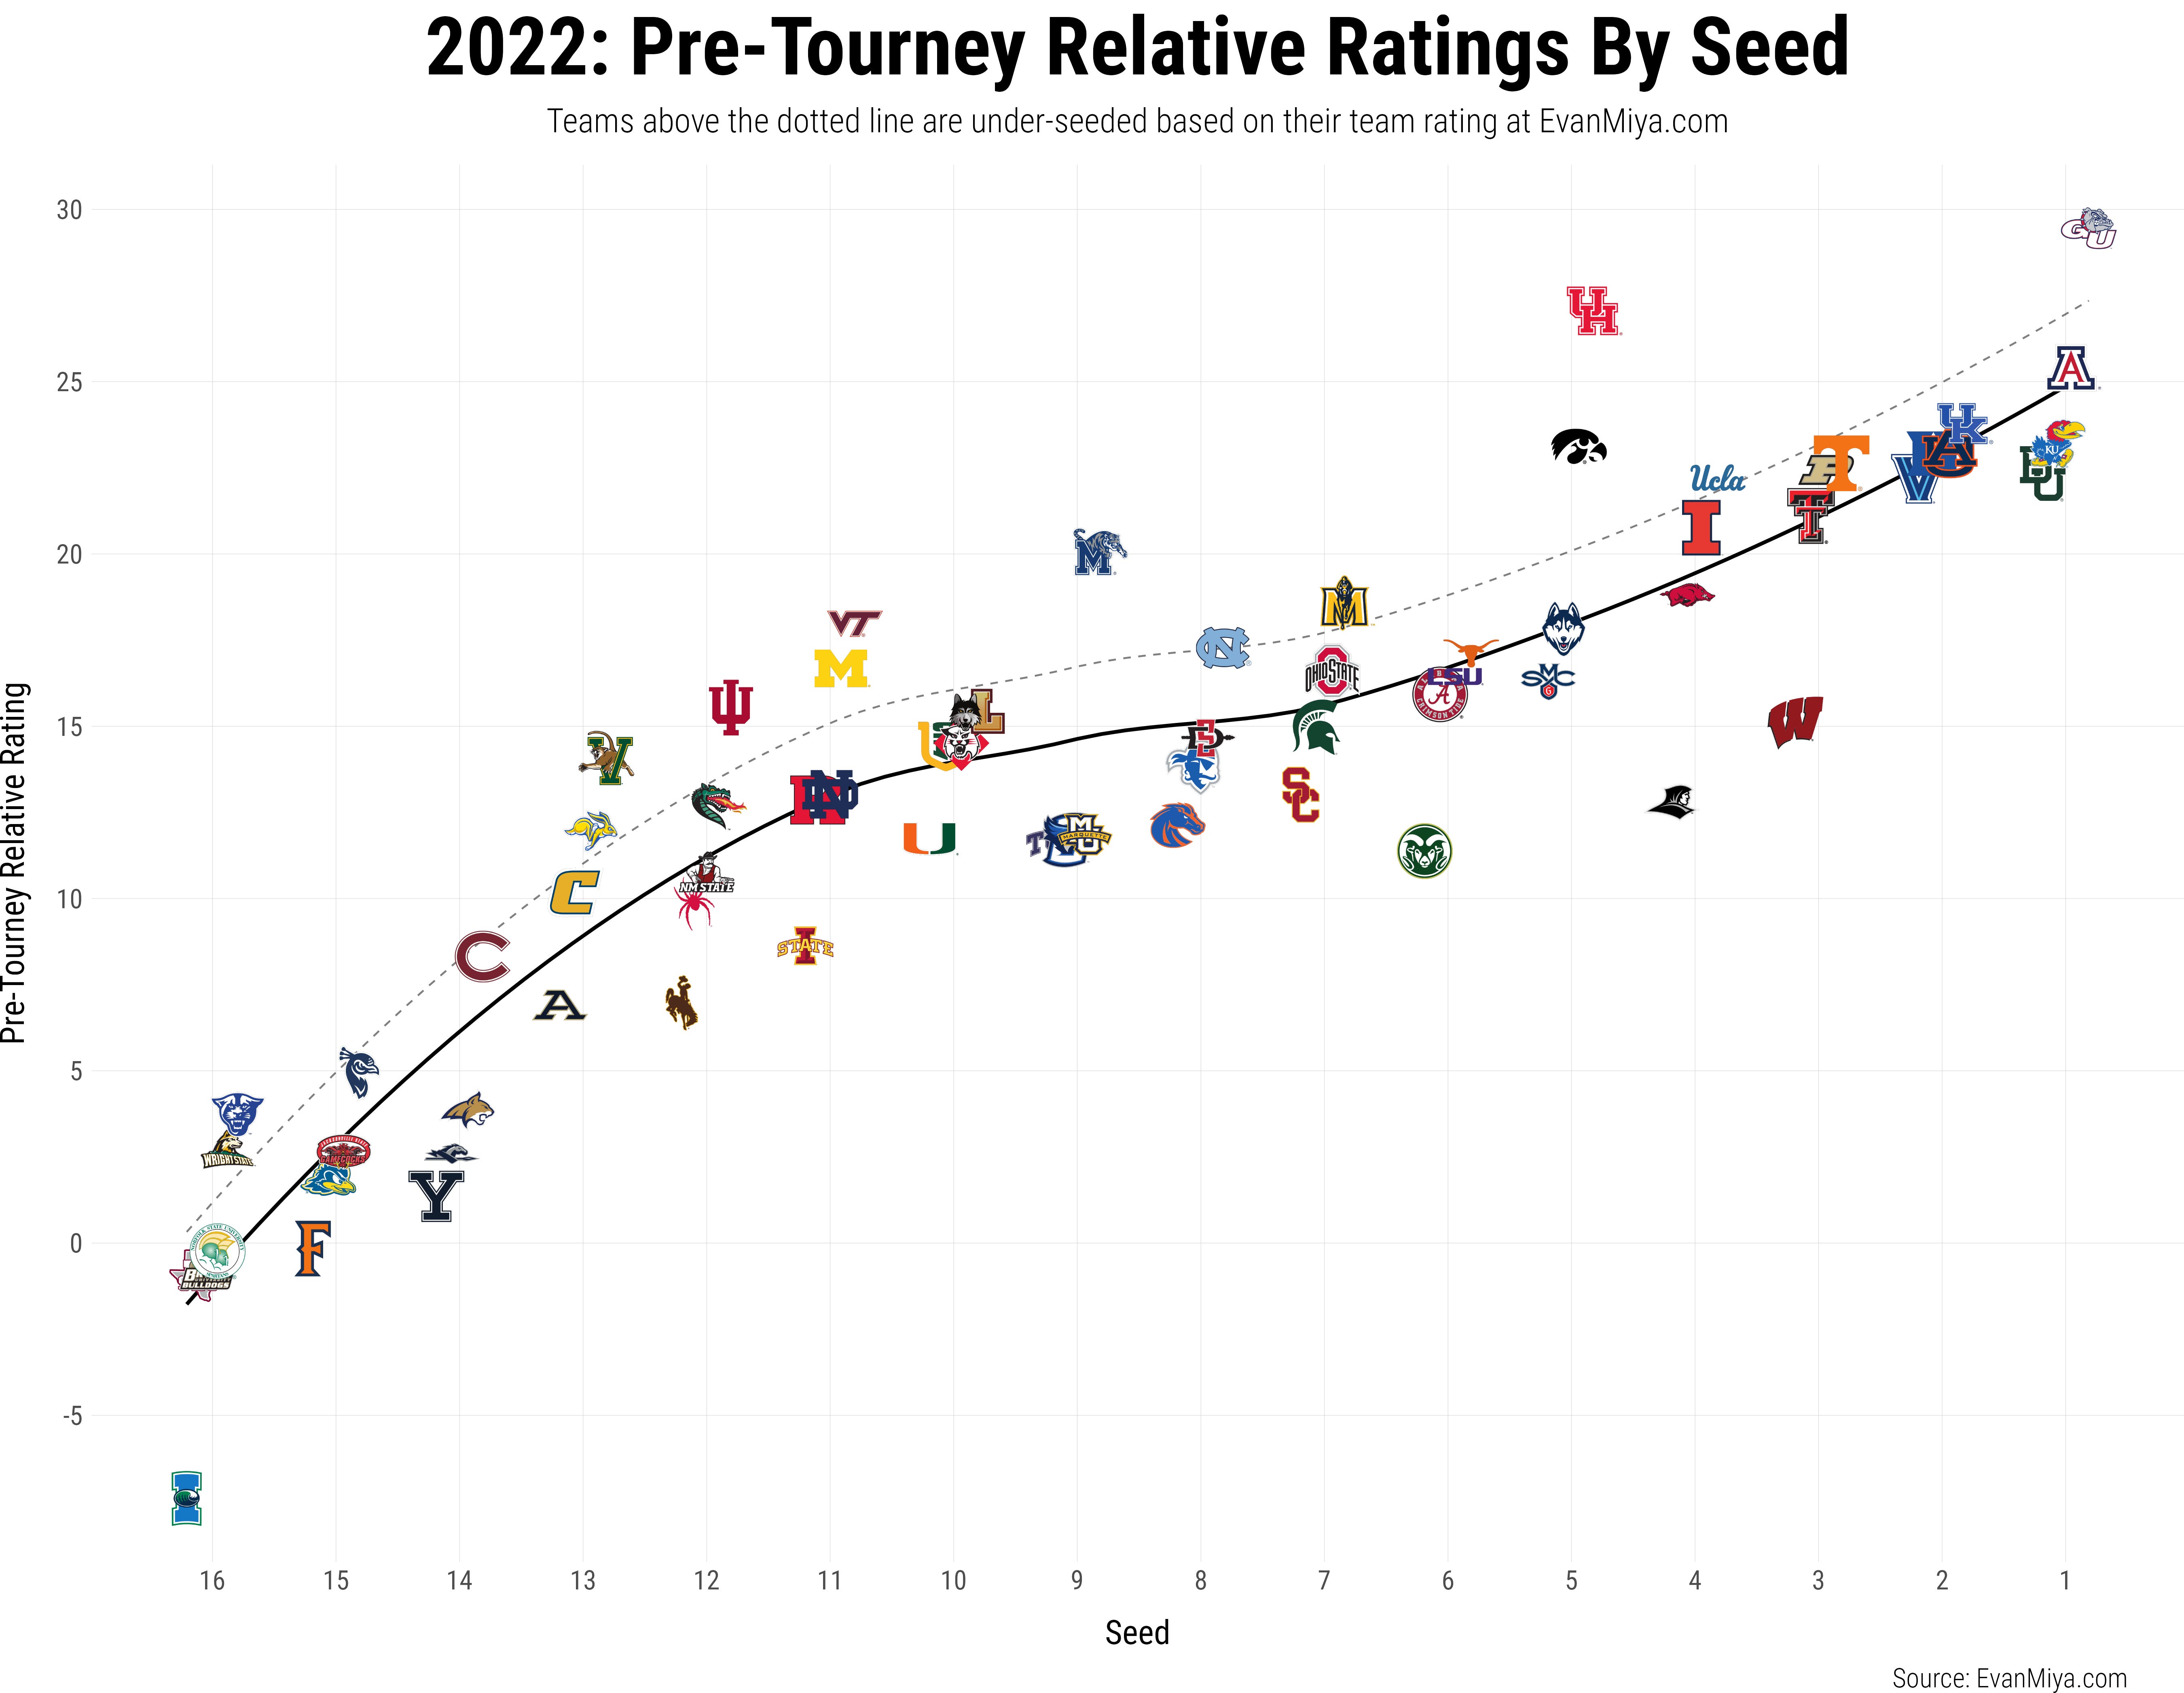
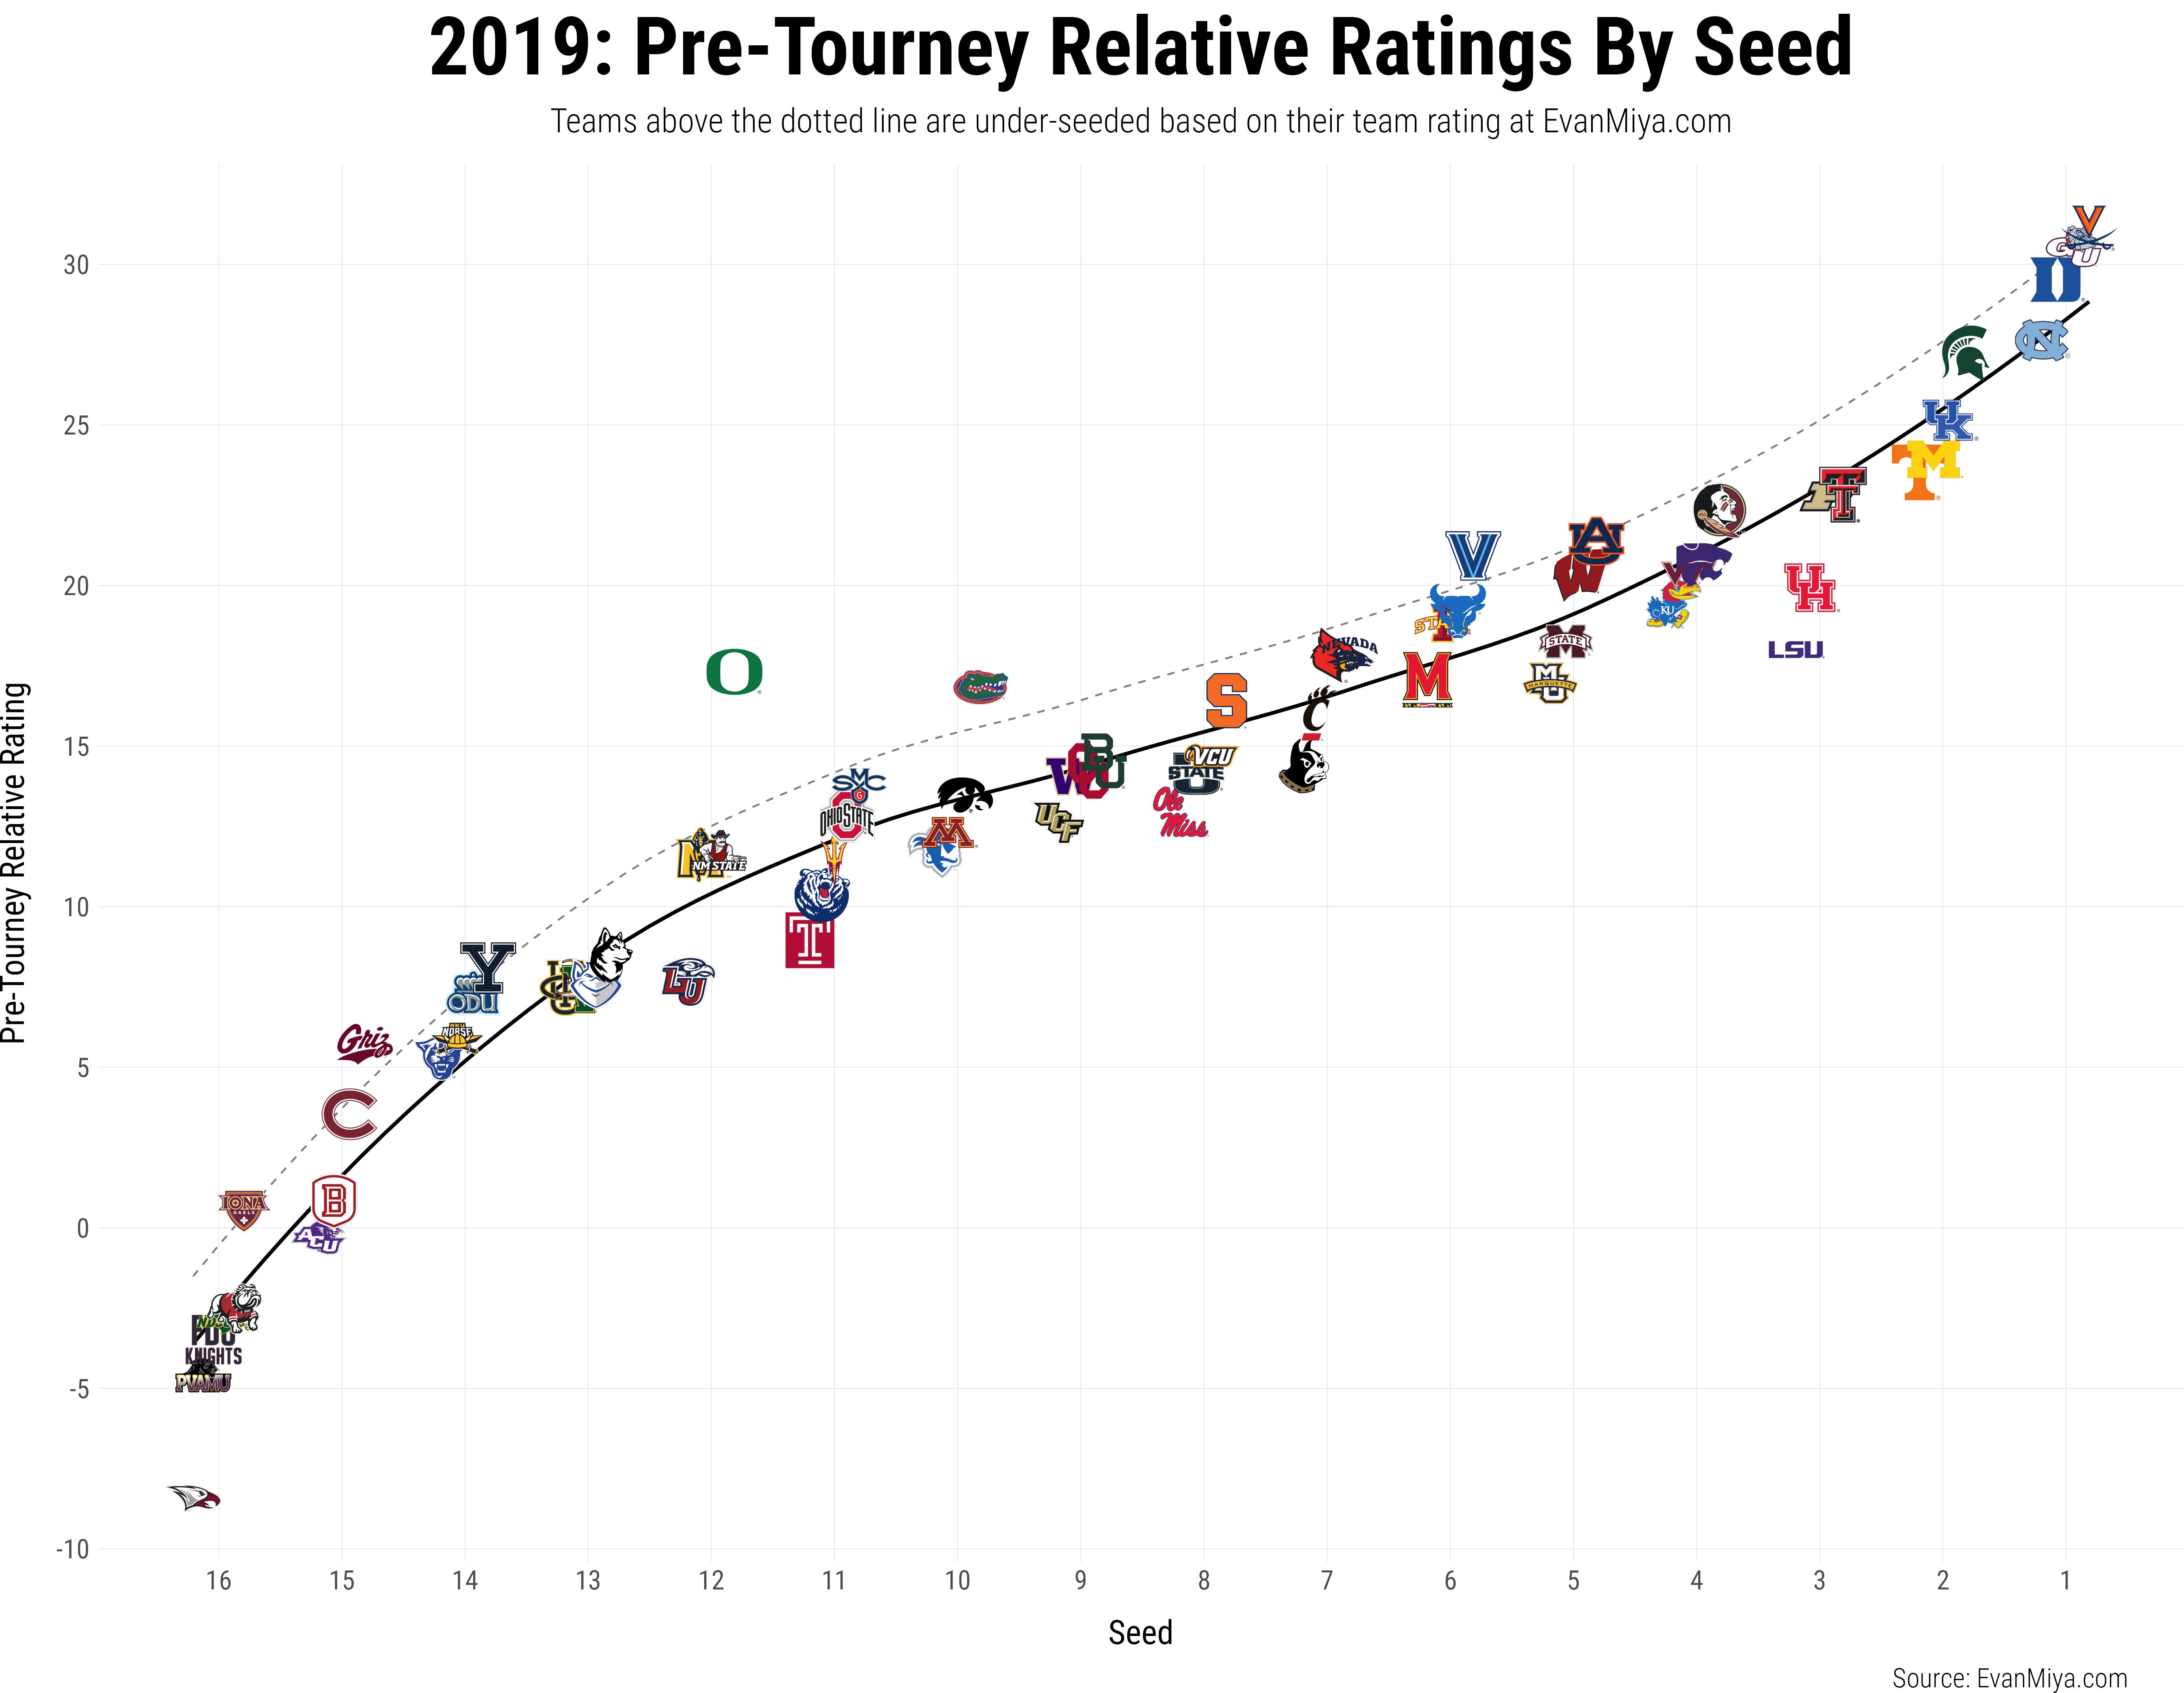
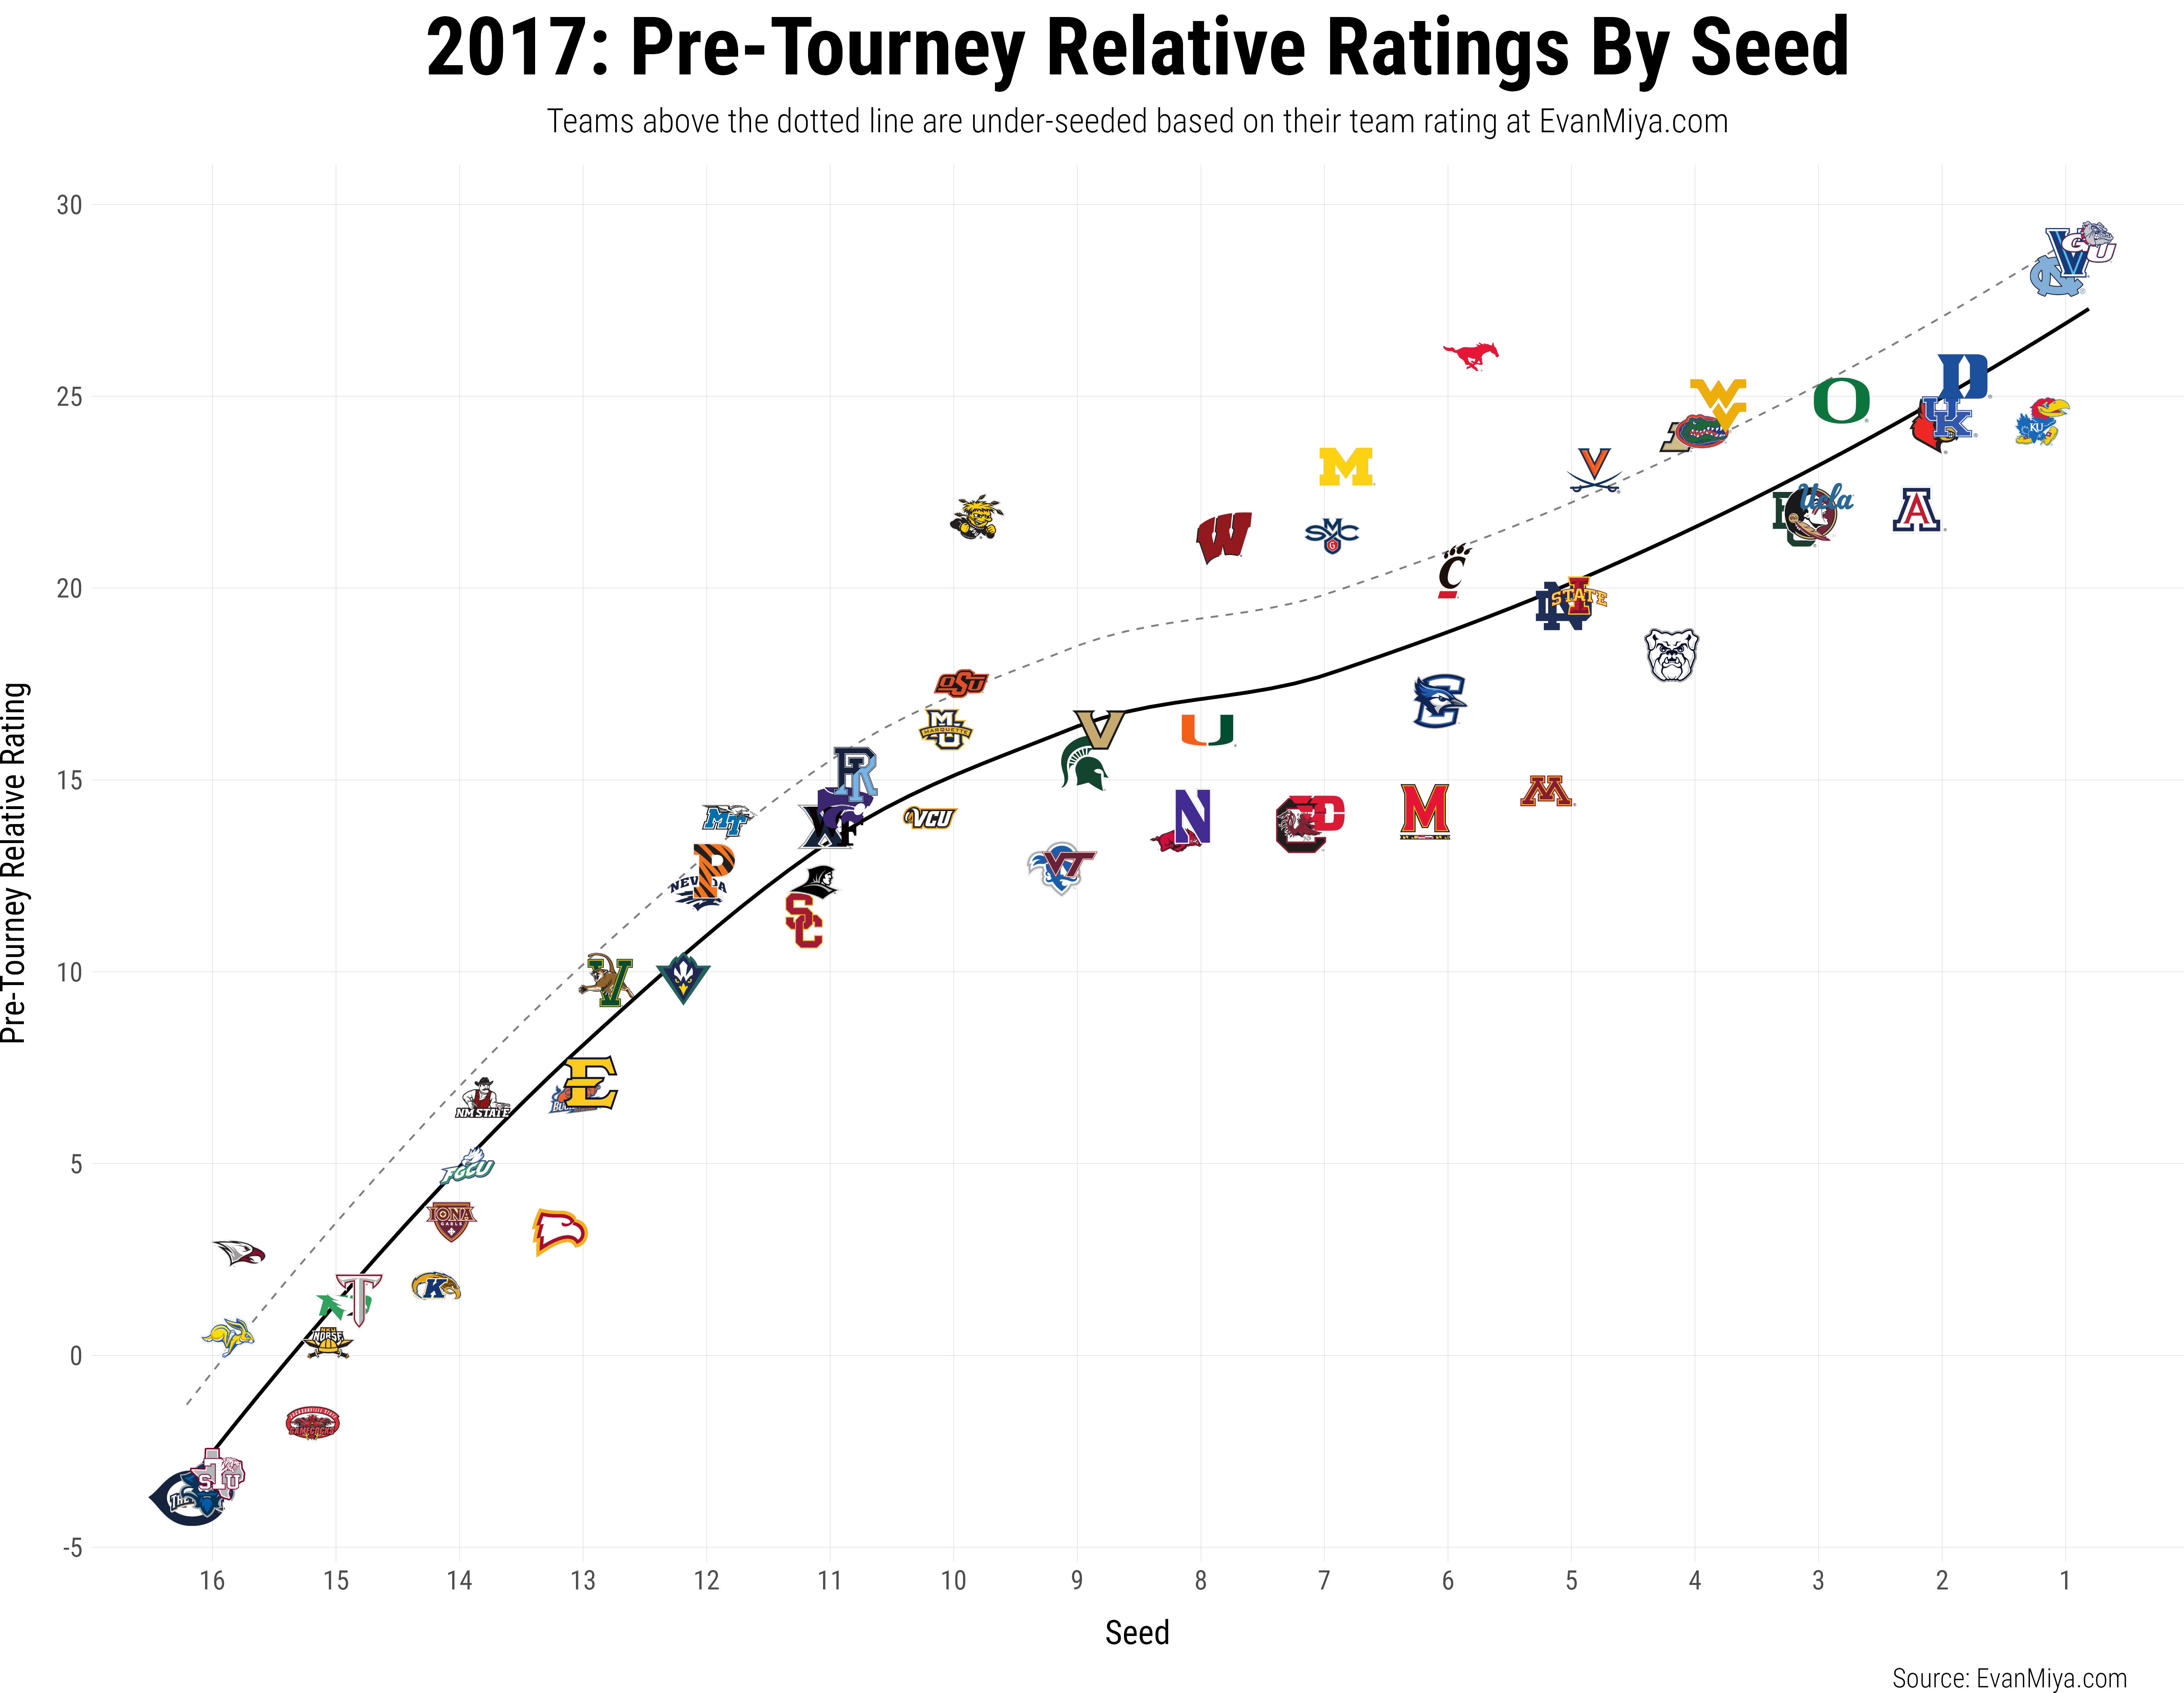
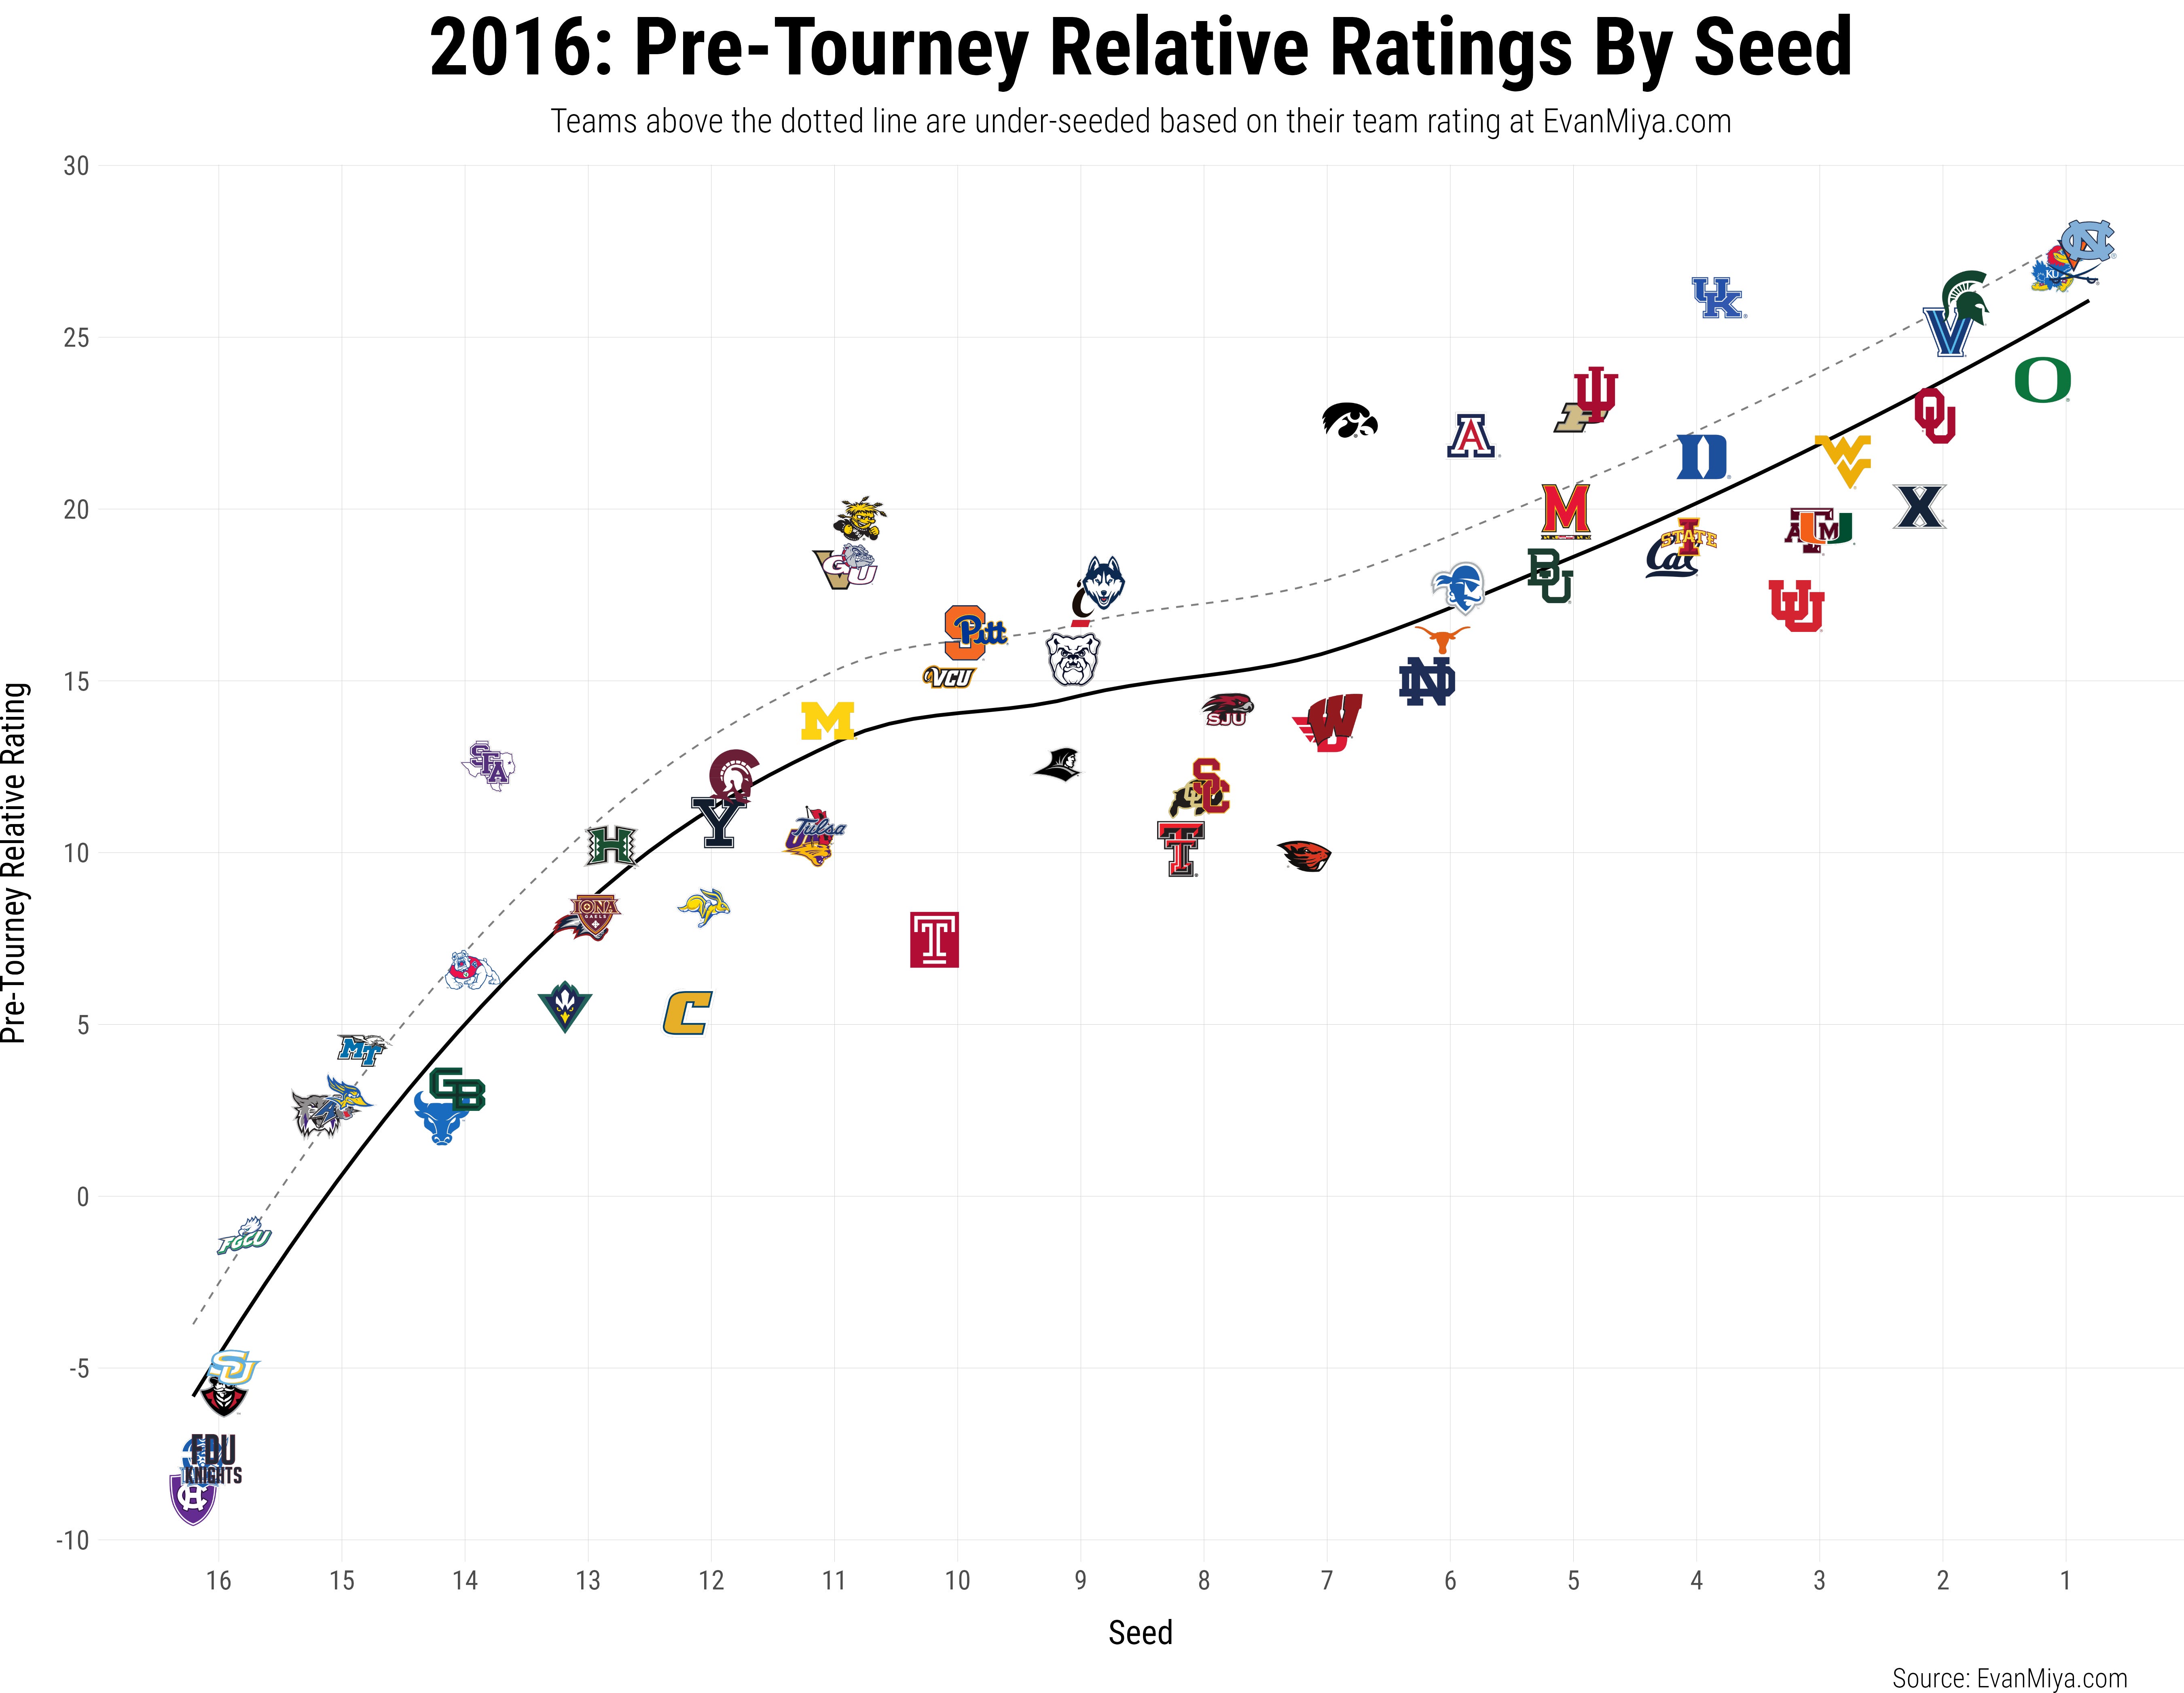
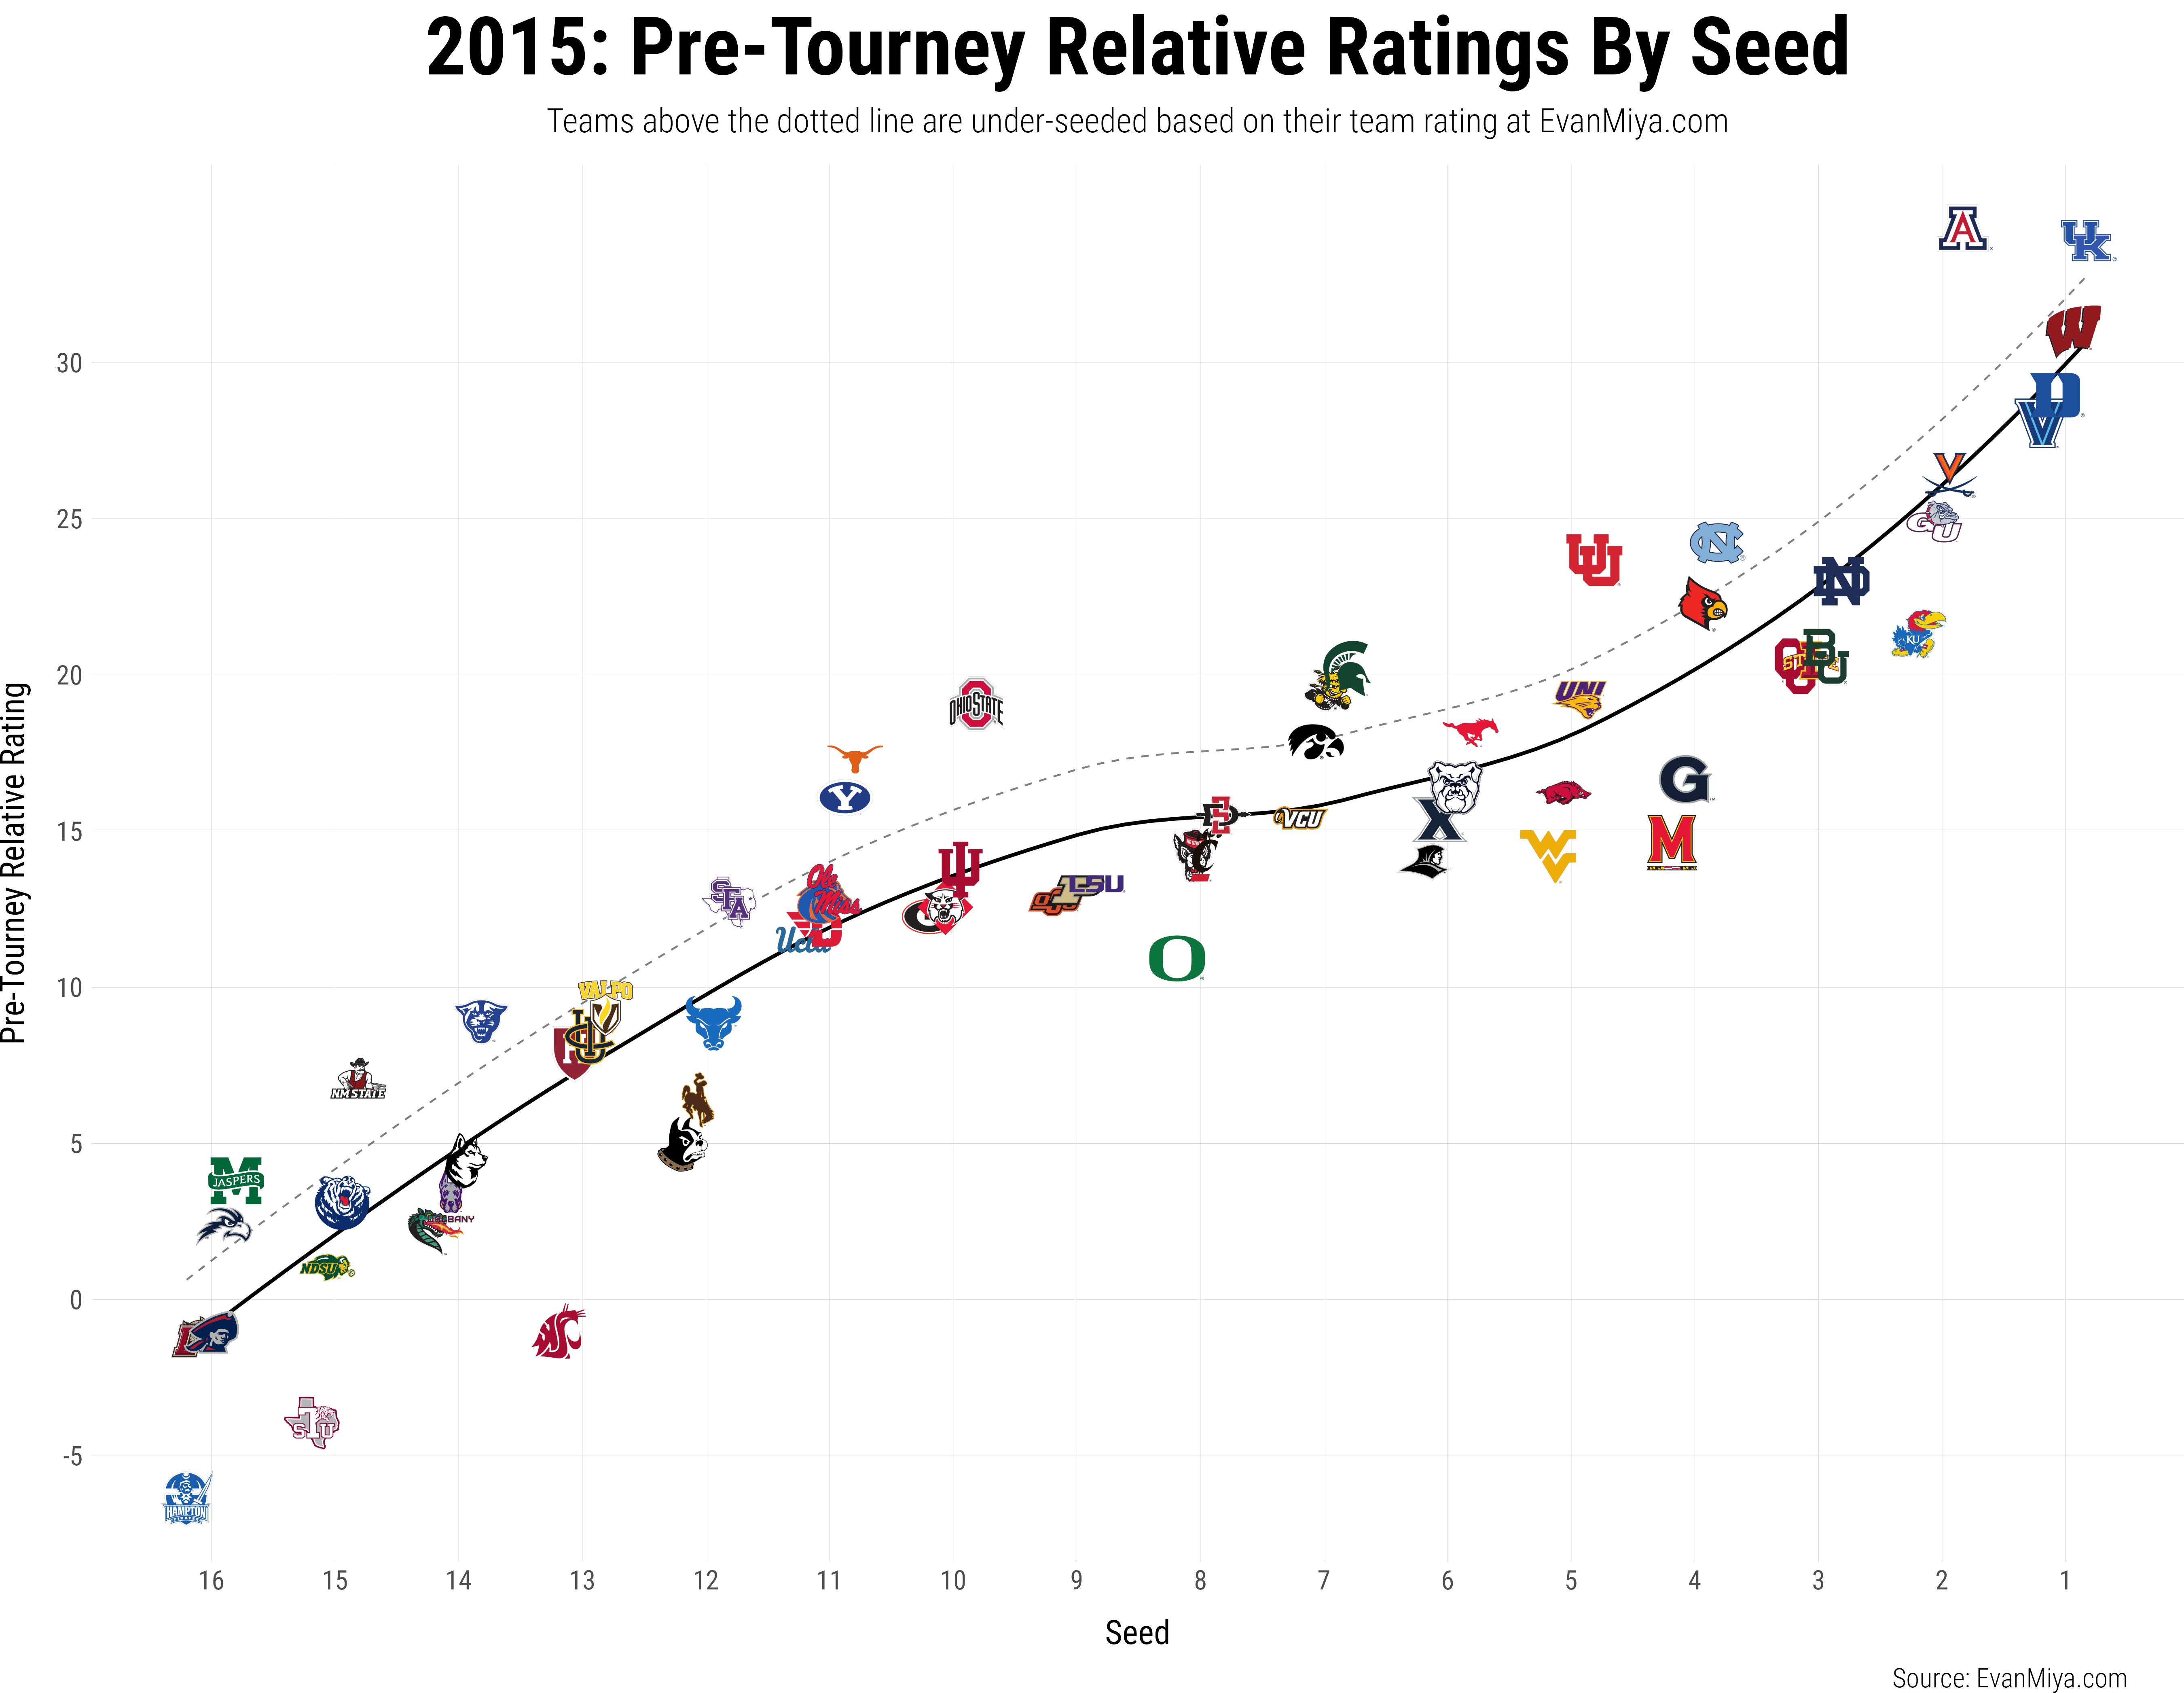
Using some modeling, we can find a typical team rating for every seed and then identify teams significantly stronger than expected at their seed line. As an example, here is every team’s pre-tournament seed in 2024, compared to their Relative Rating:

The solid black line represents a typical Relative Rating for that seed, and the dotted black line shows the threshold for under-seeded teams. In particular, I have found that teams with a pre-tourney Relative Rating at least 2.1 points higher than expected for their seed perform much better in the tournament.
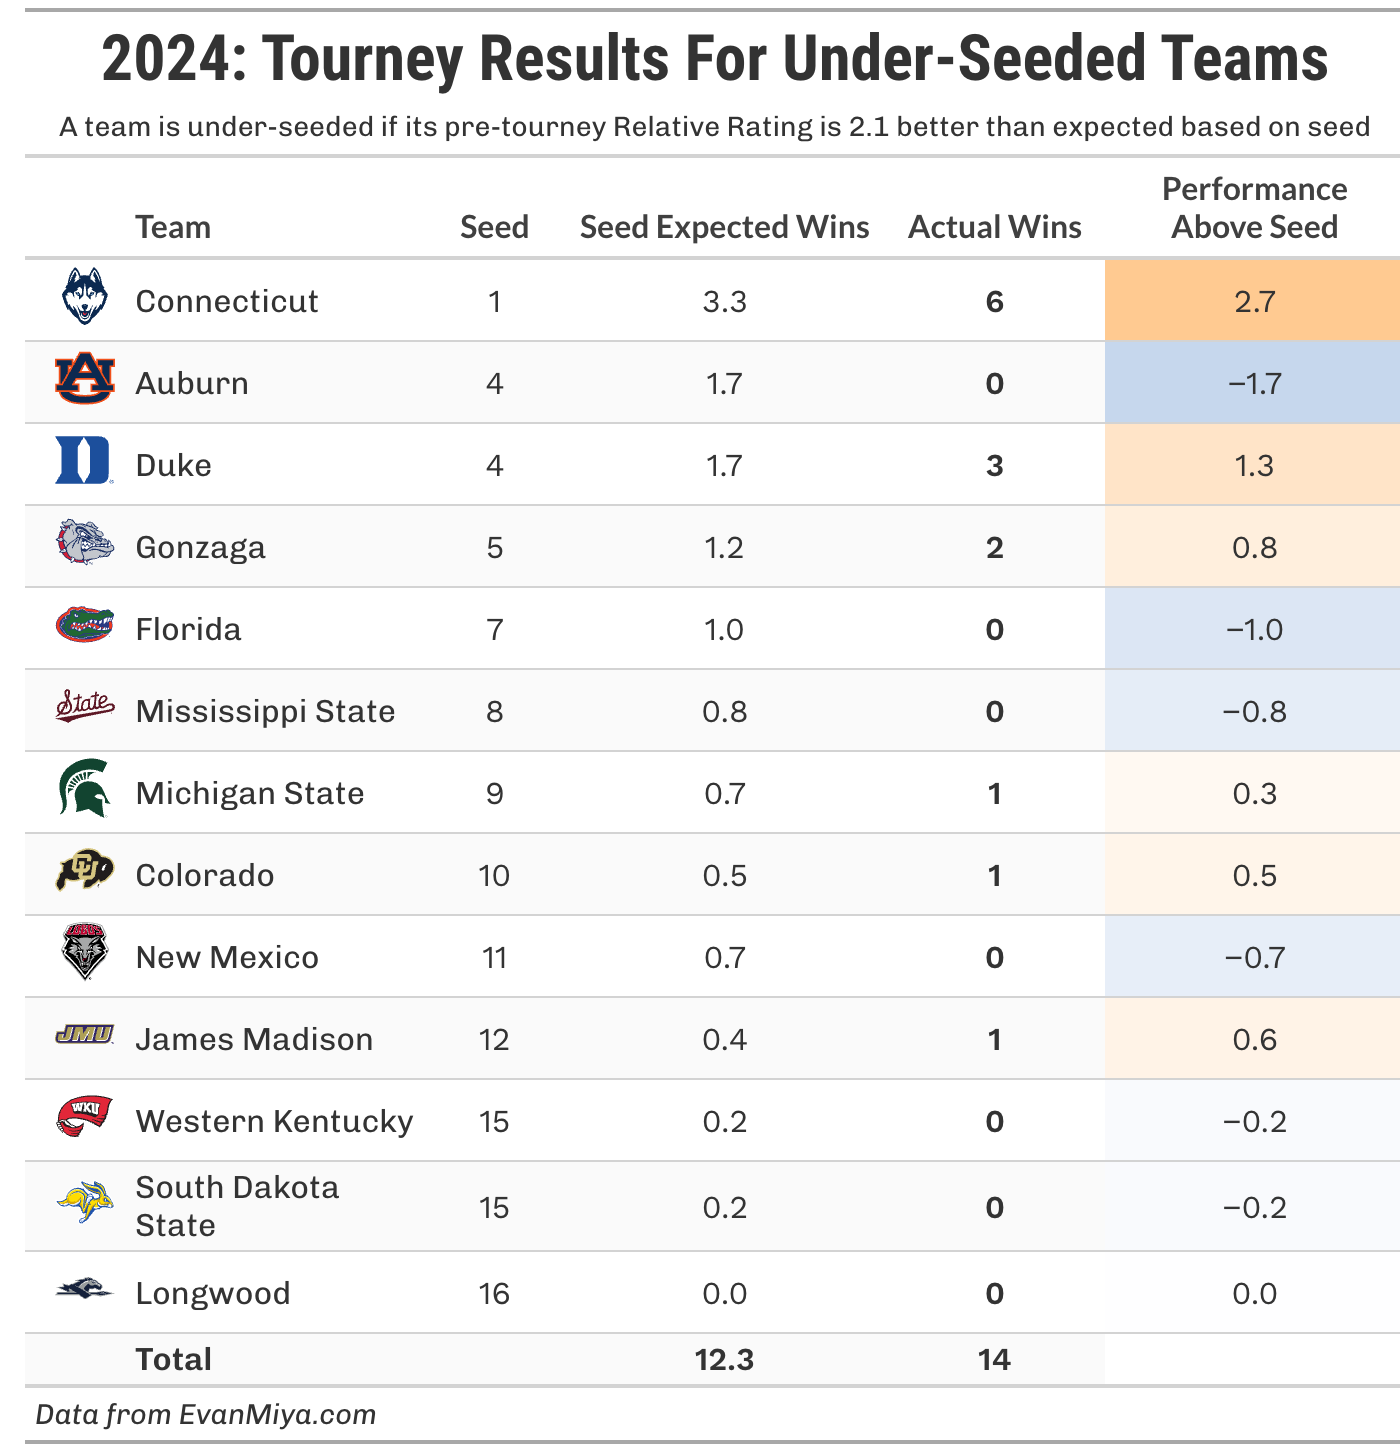
Here are the stats you need to know about these under-seeded teams:
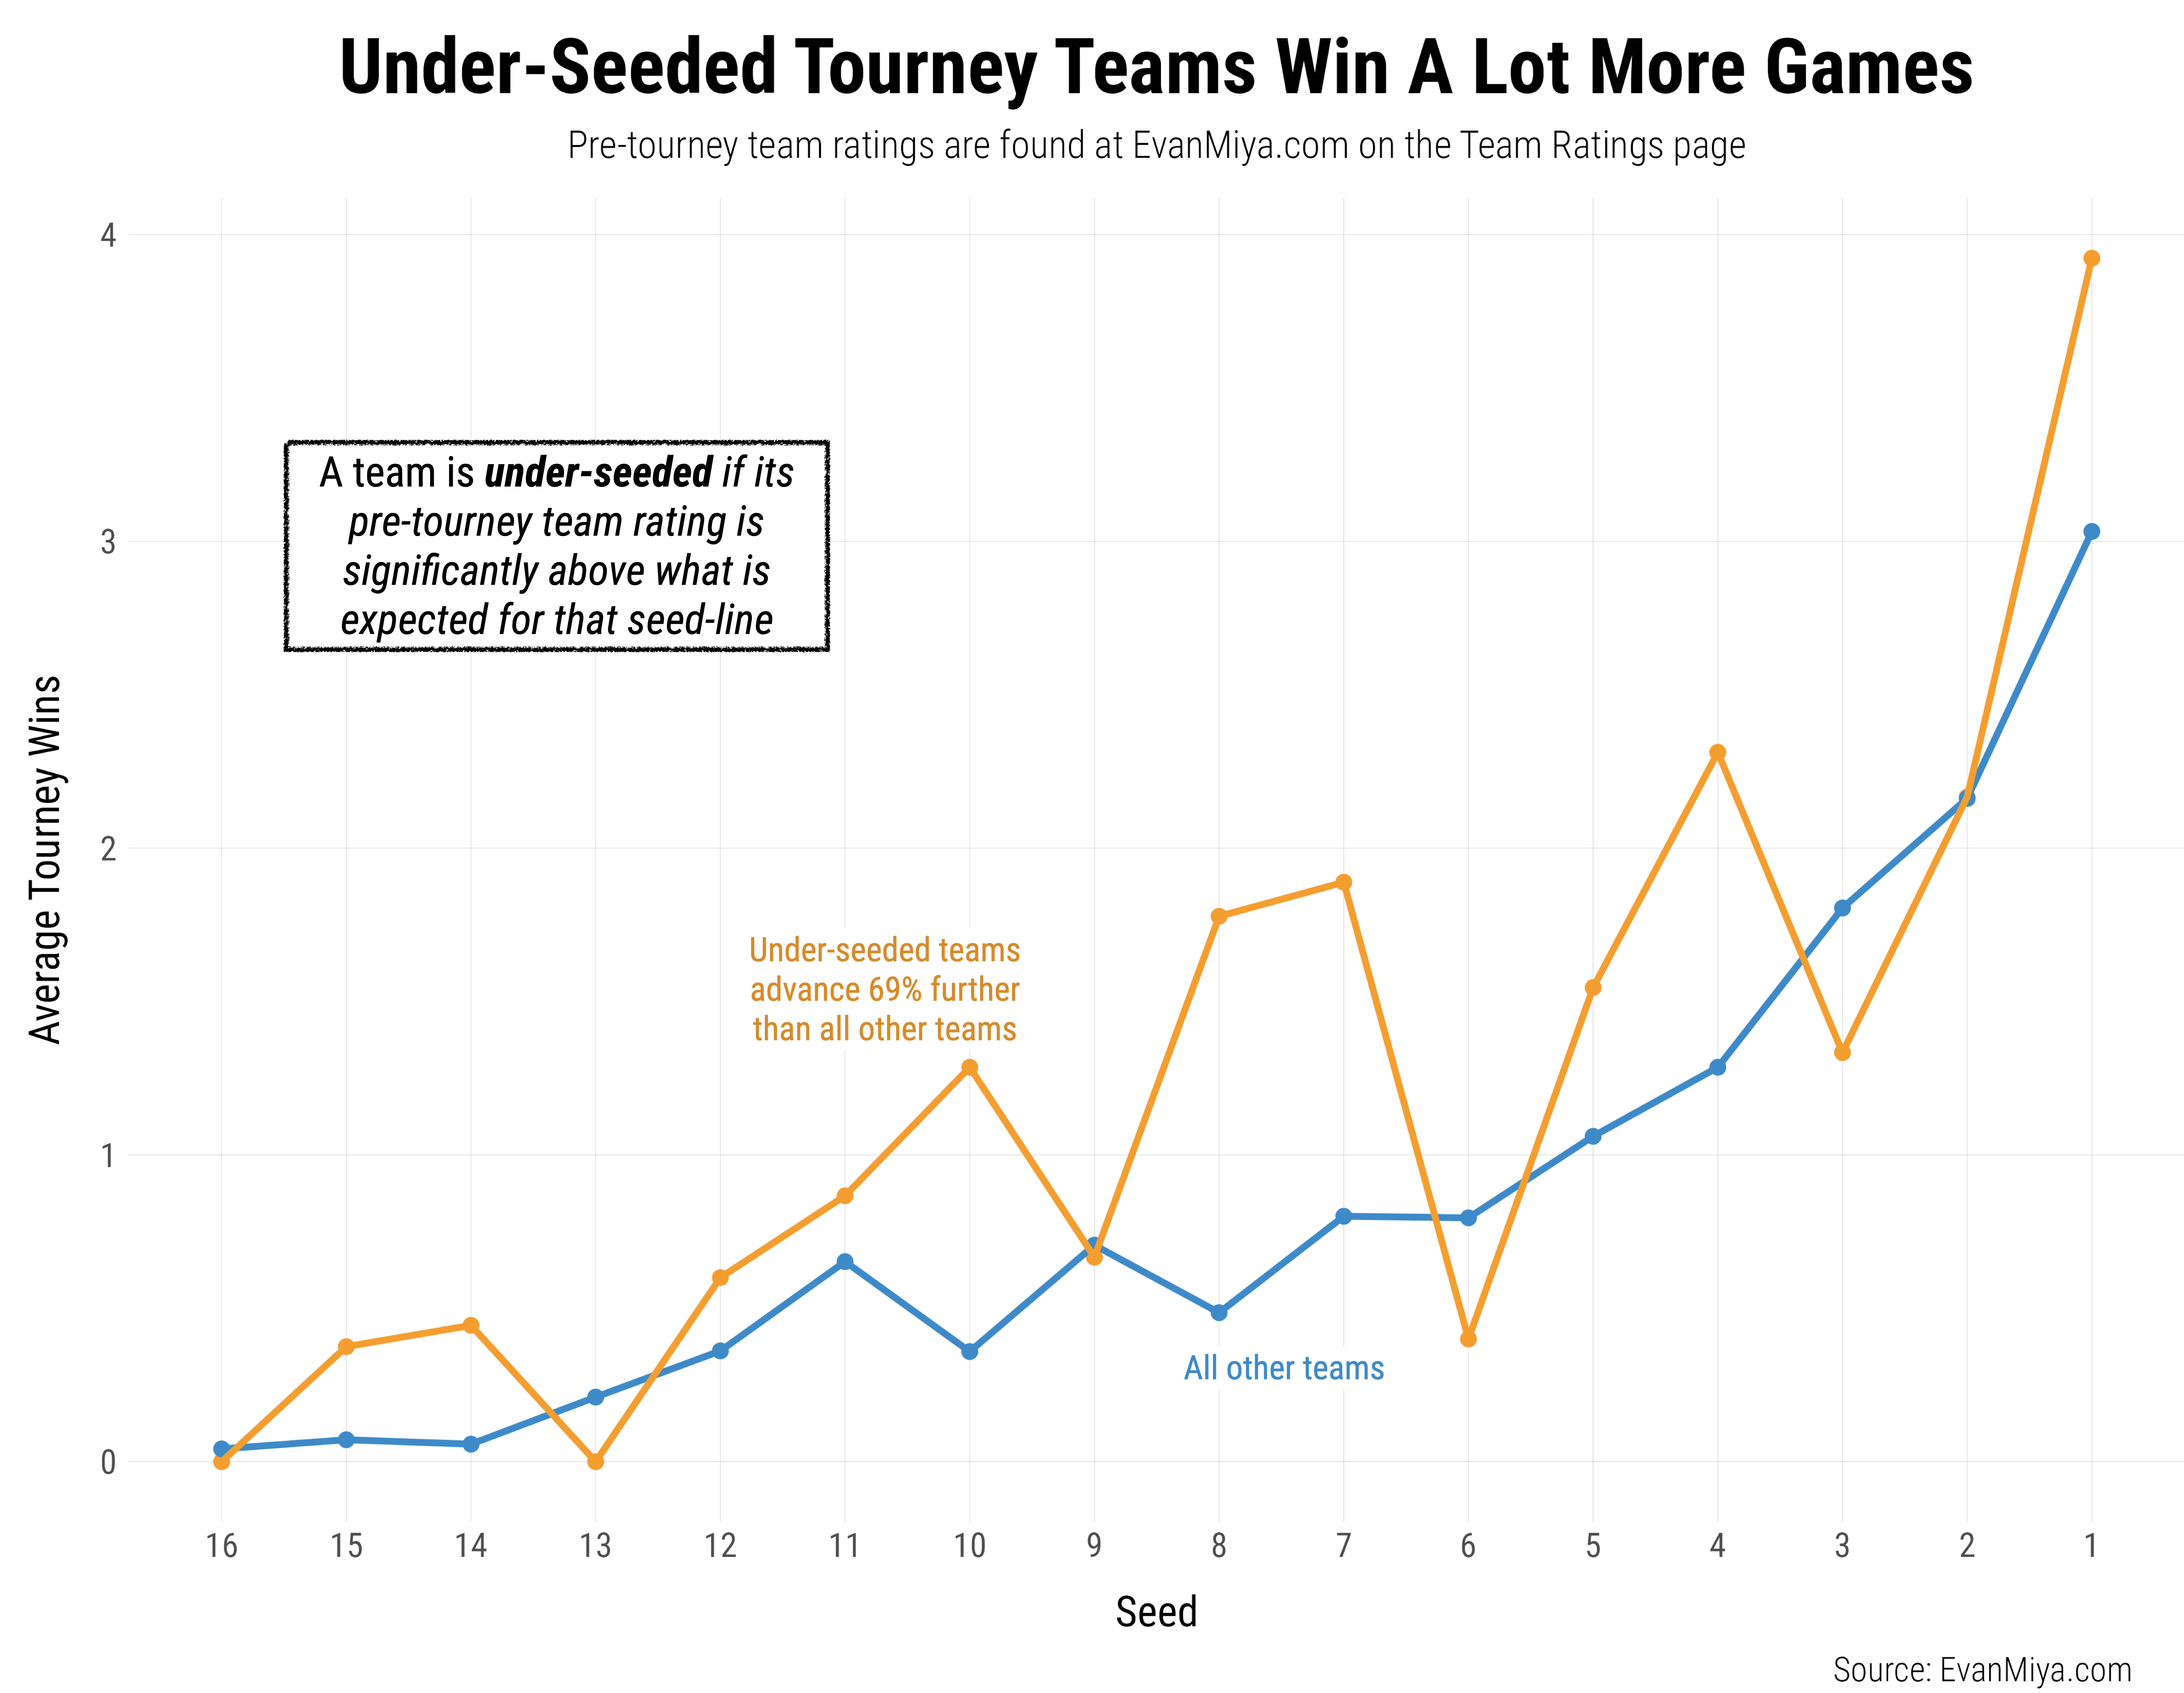
Under-seeded teams advance 69% further than other teams on the same seed line, on average.
About 21% of the teams in the tournament qualify as under-seeded.
The graph below shows the average number of tournament wins by seed, comparing the under-seeded teams (in orange) to all other teams (in blue):
Calculating the typical Relative Rating per seed is specific to each year, so I will put out a graphic on “Bracket Monday” highlighting those teams for 2026.
Pre-Tourney Graphs By Year
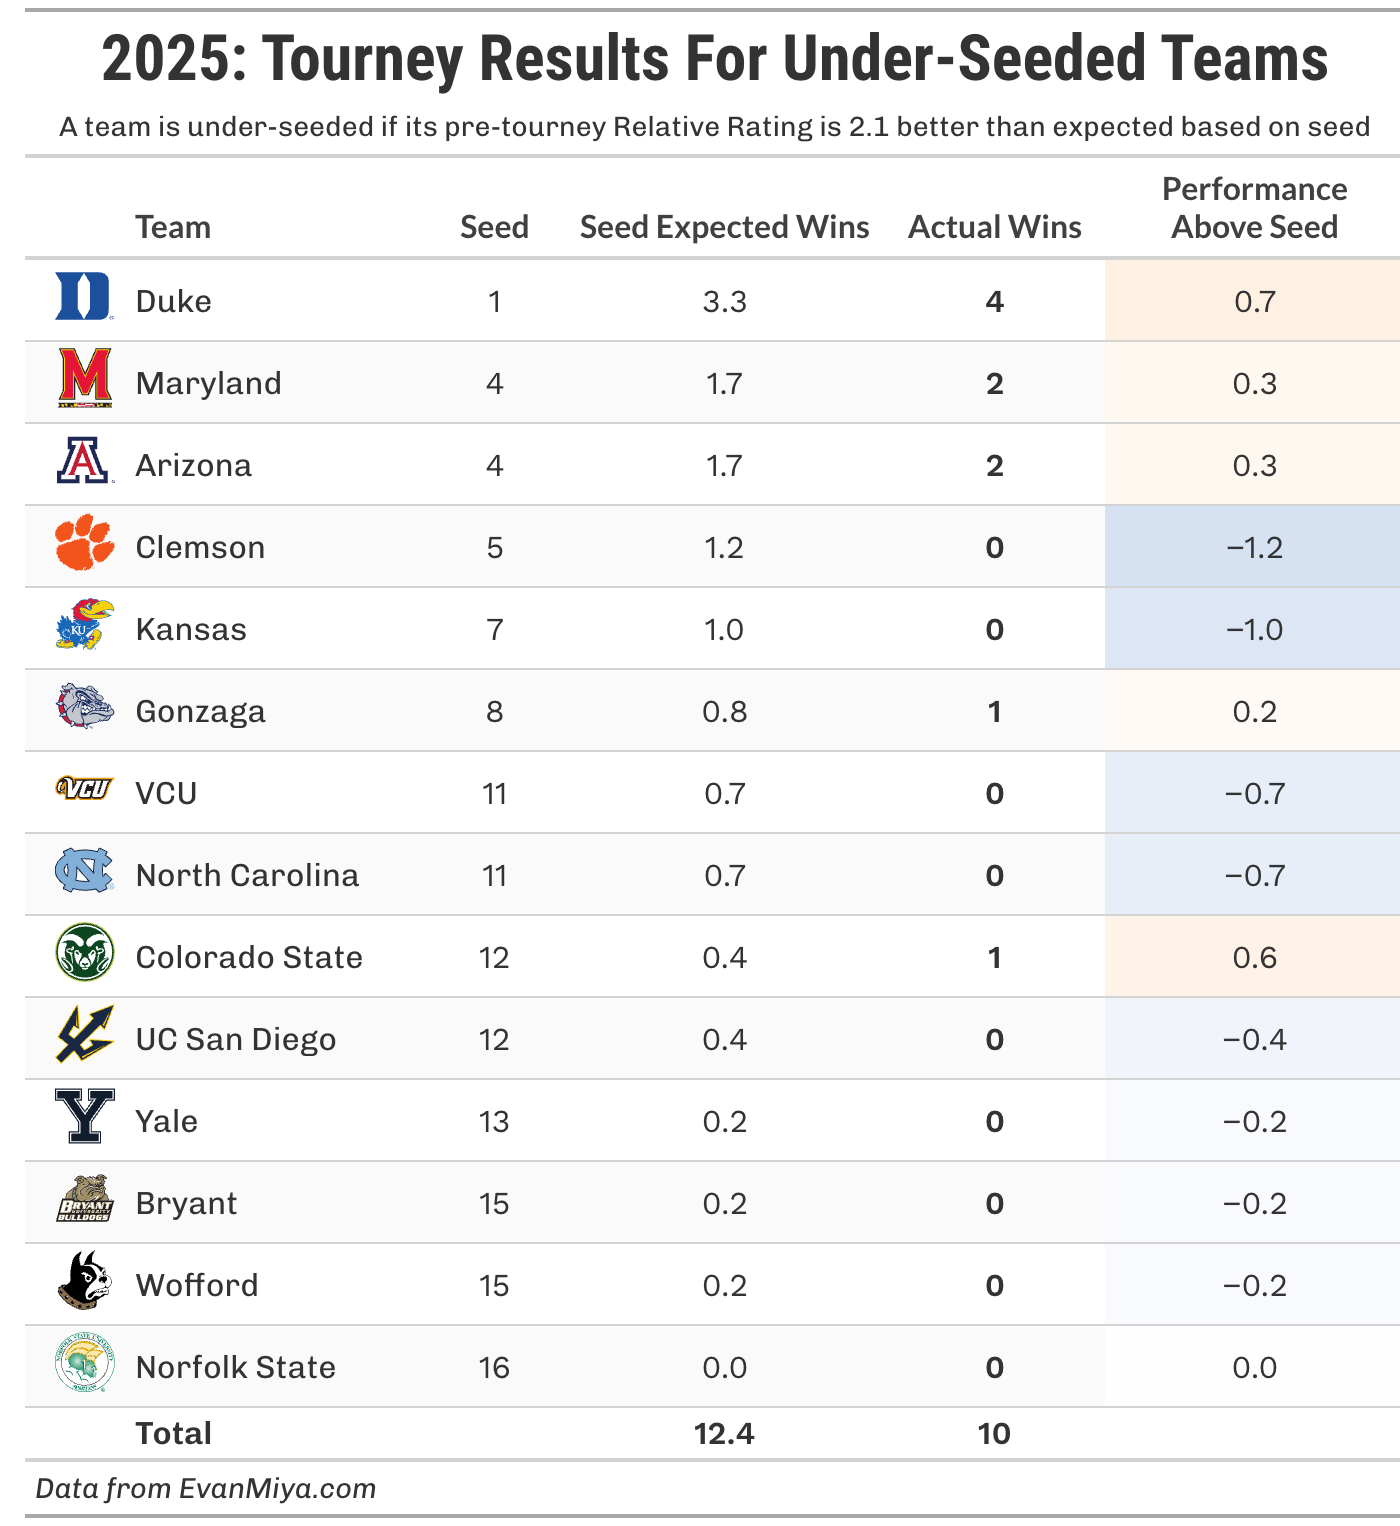
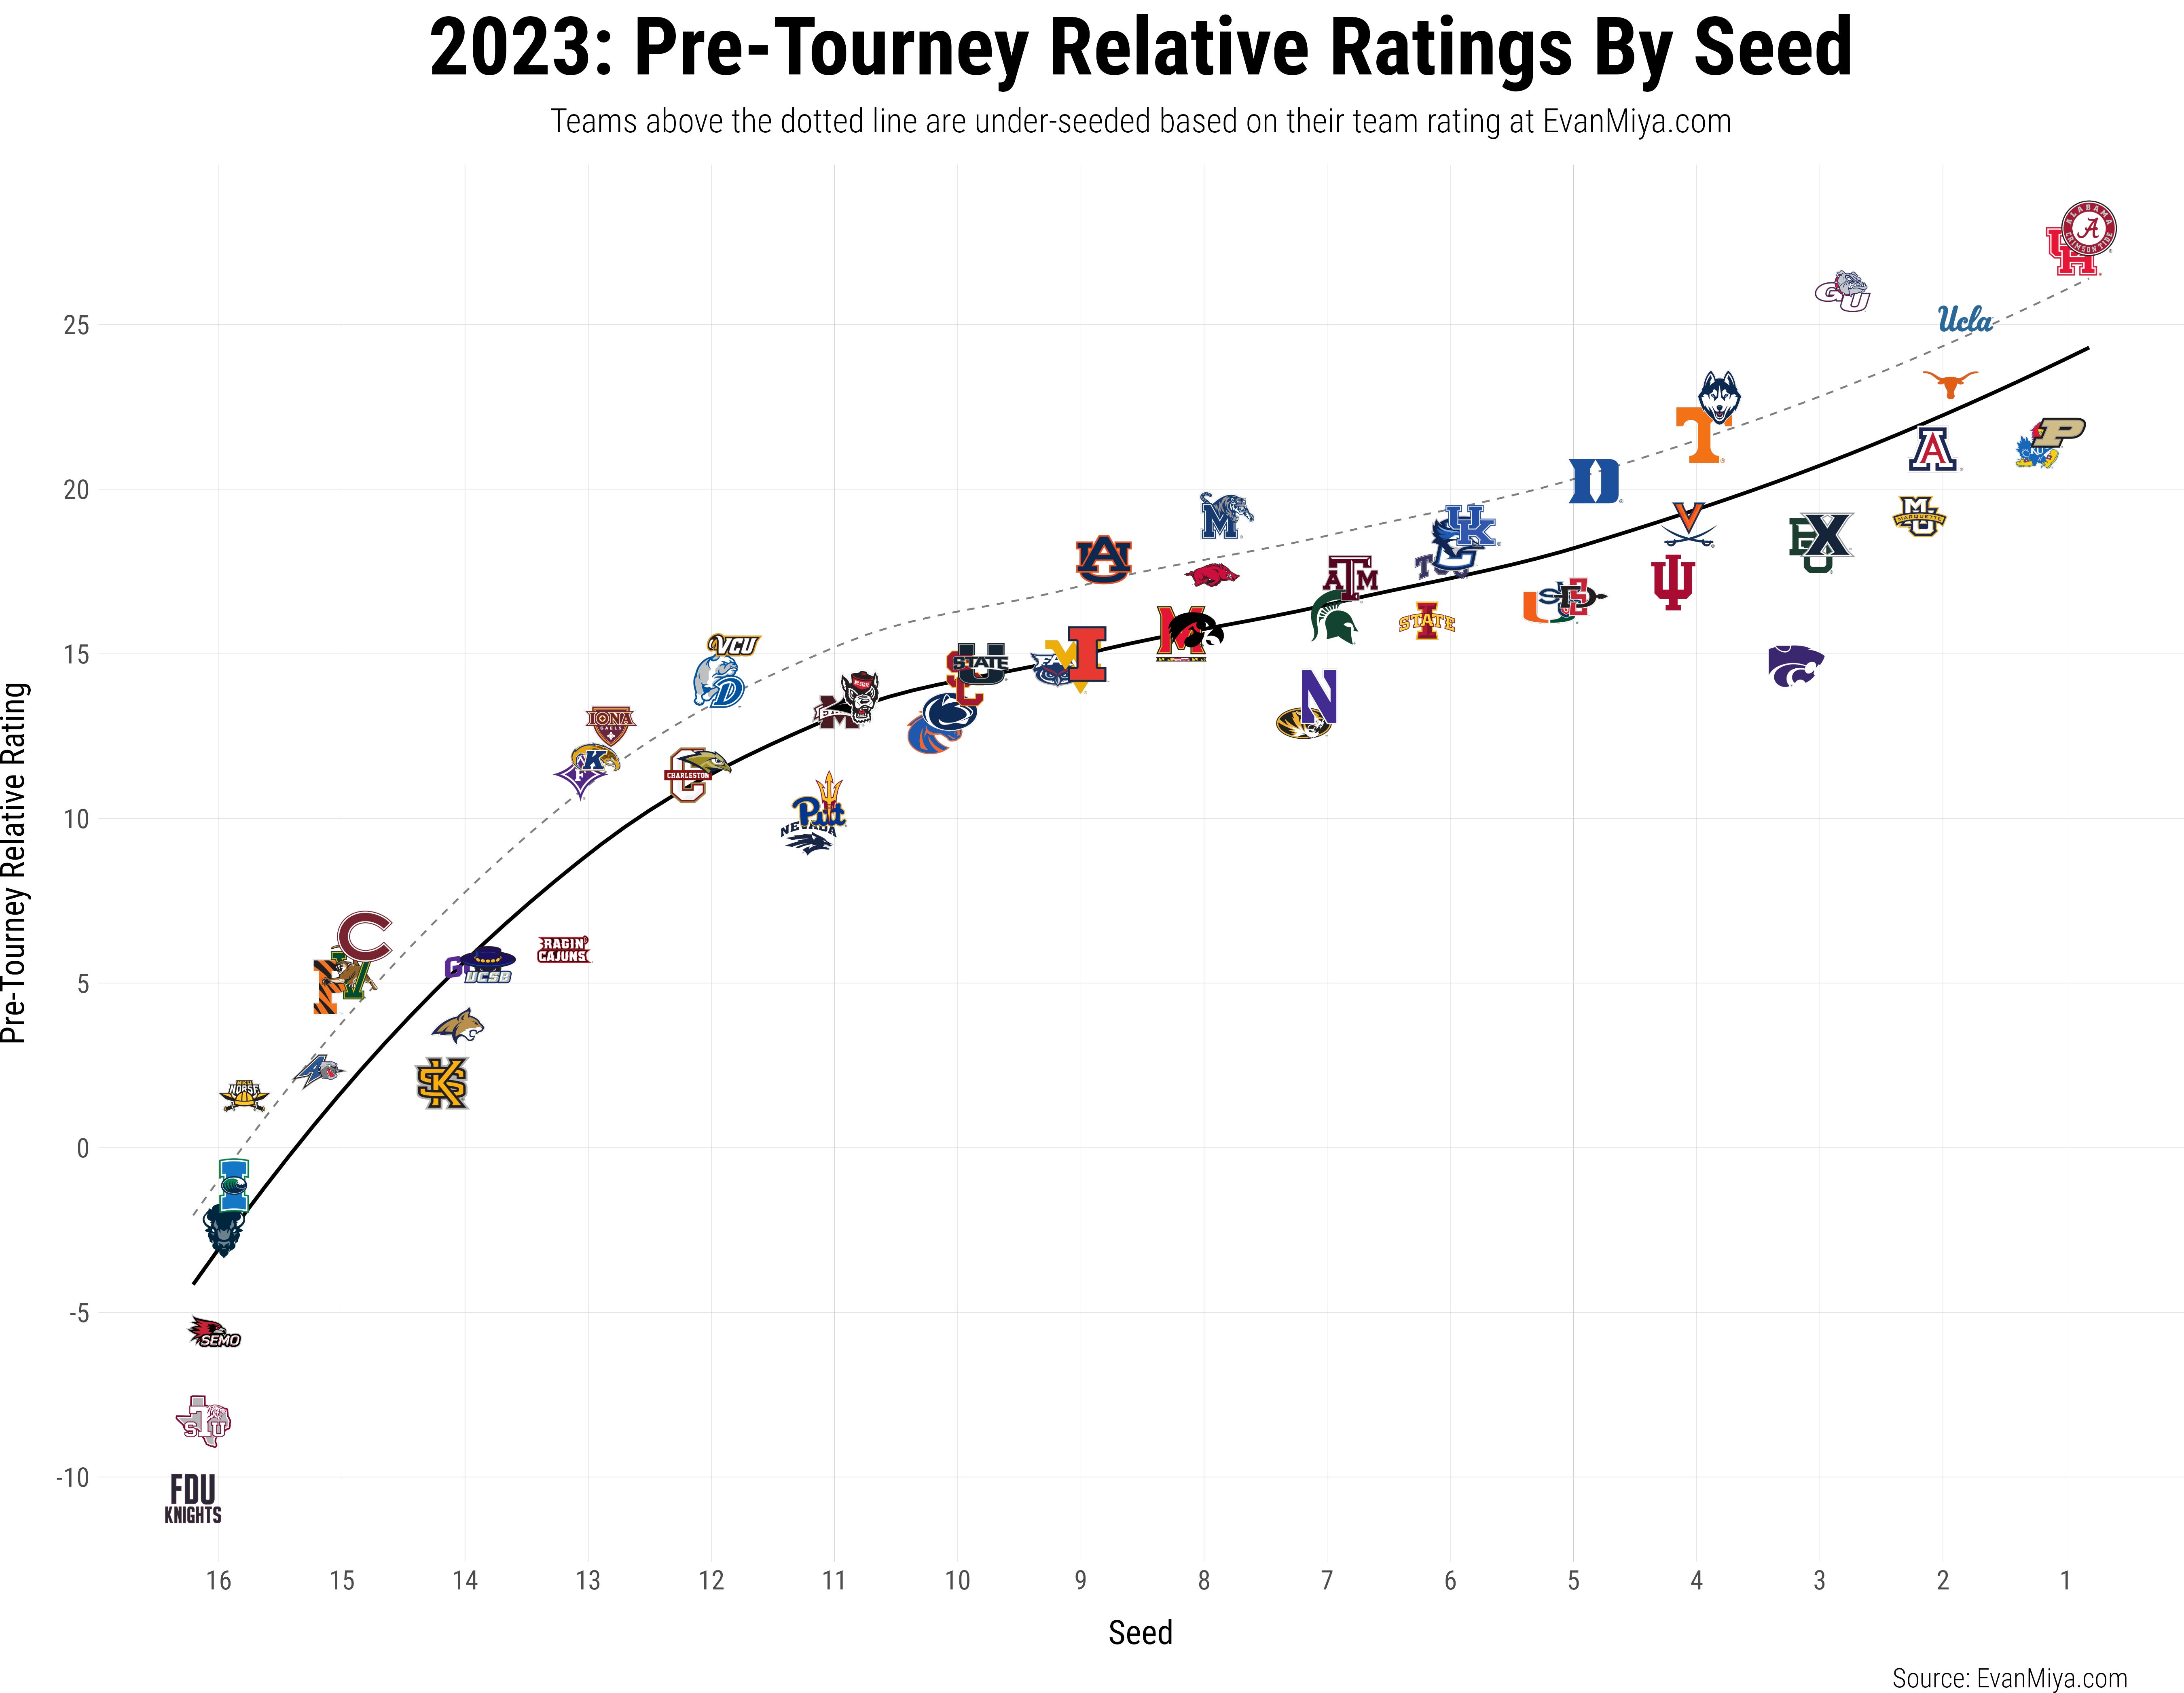
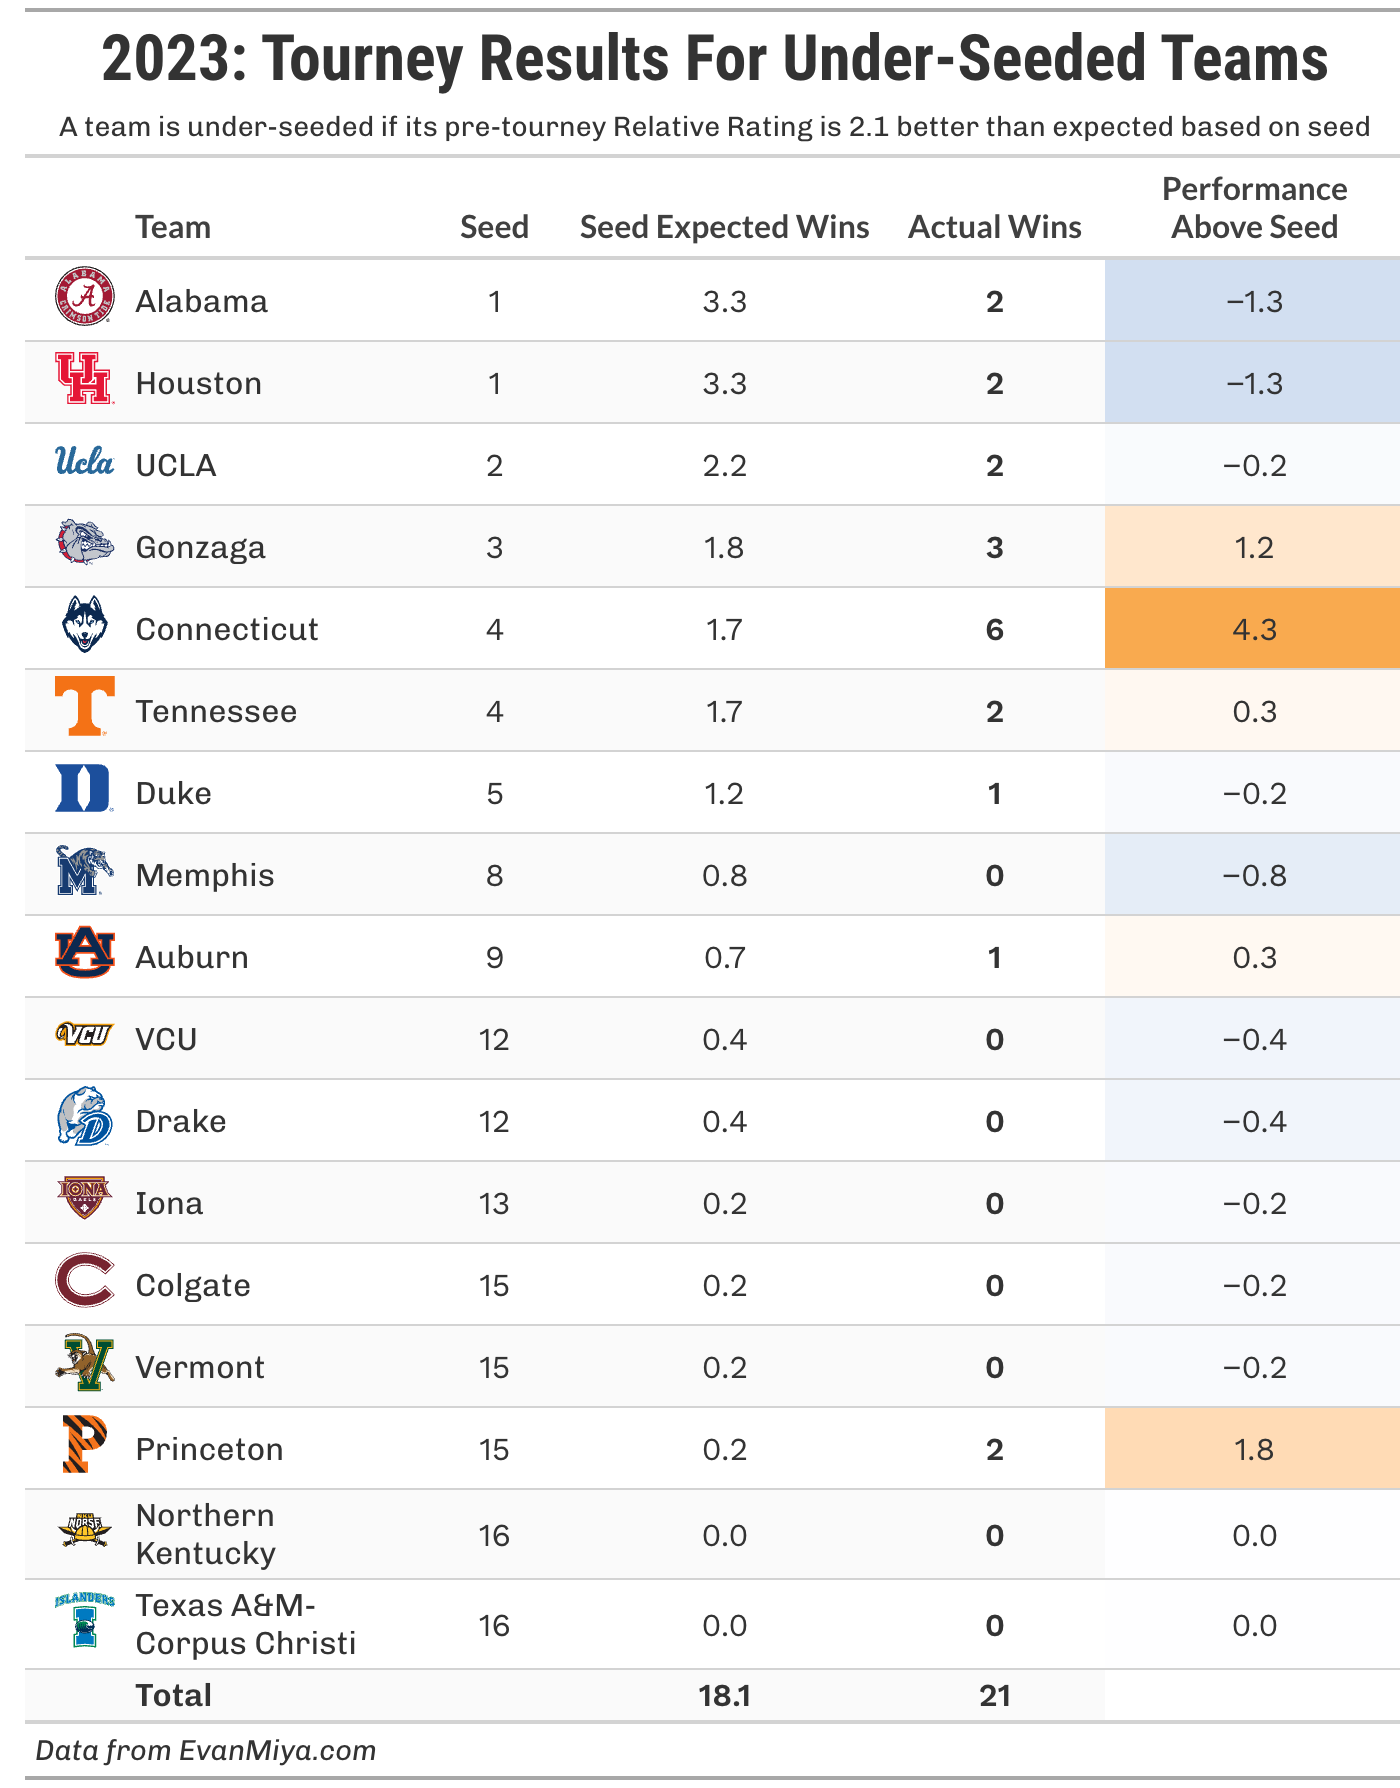
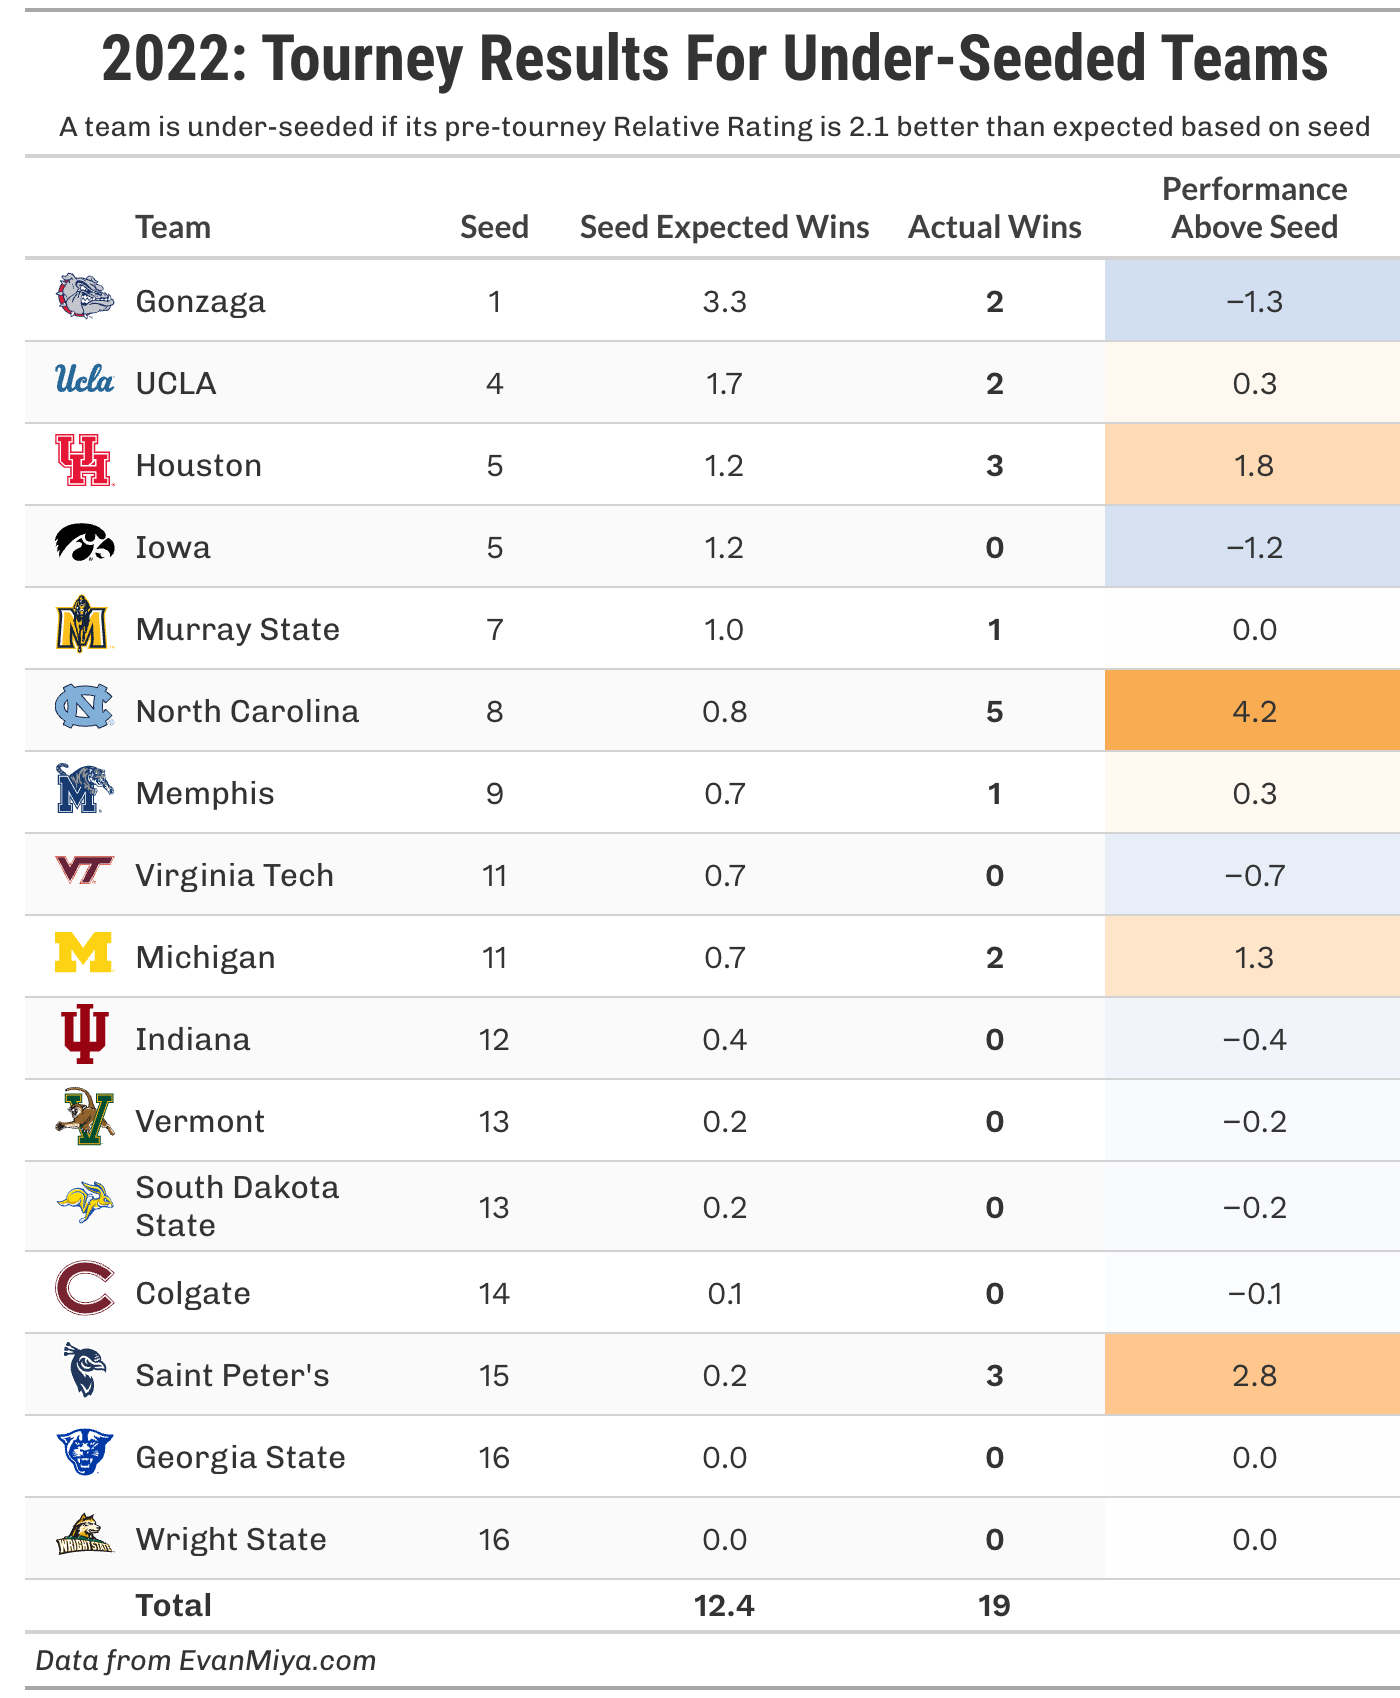
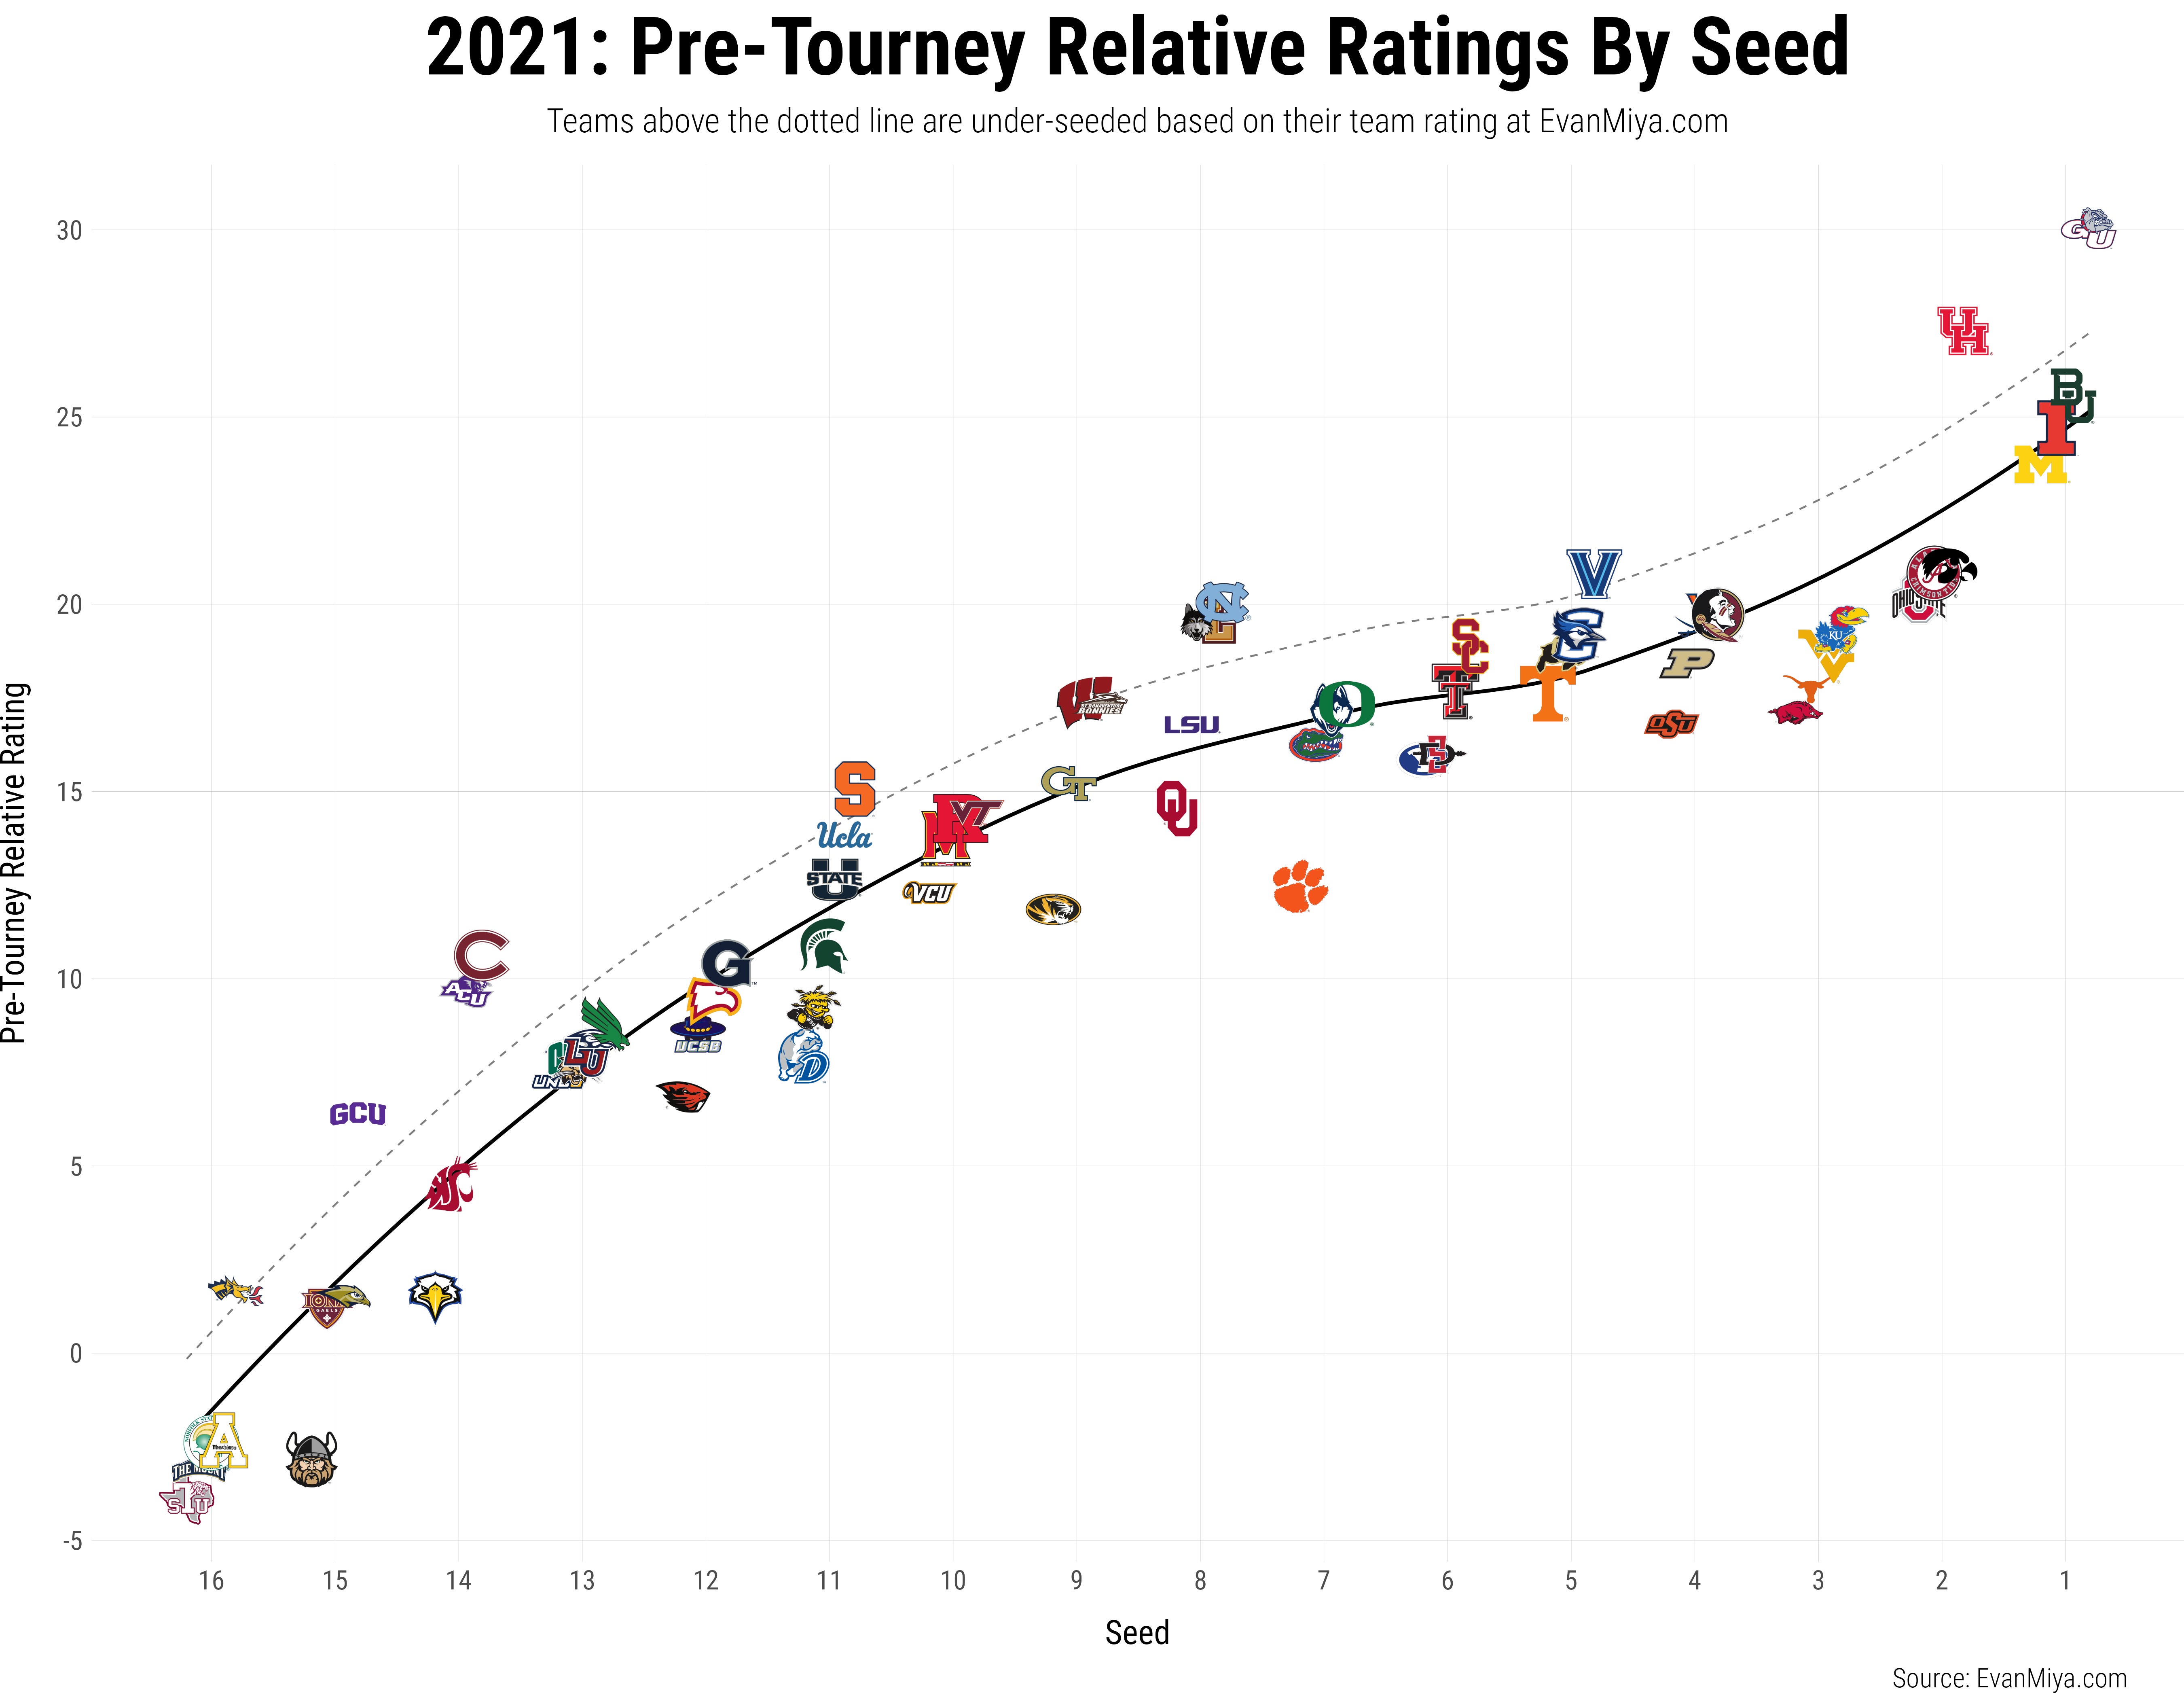
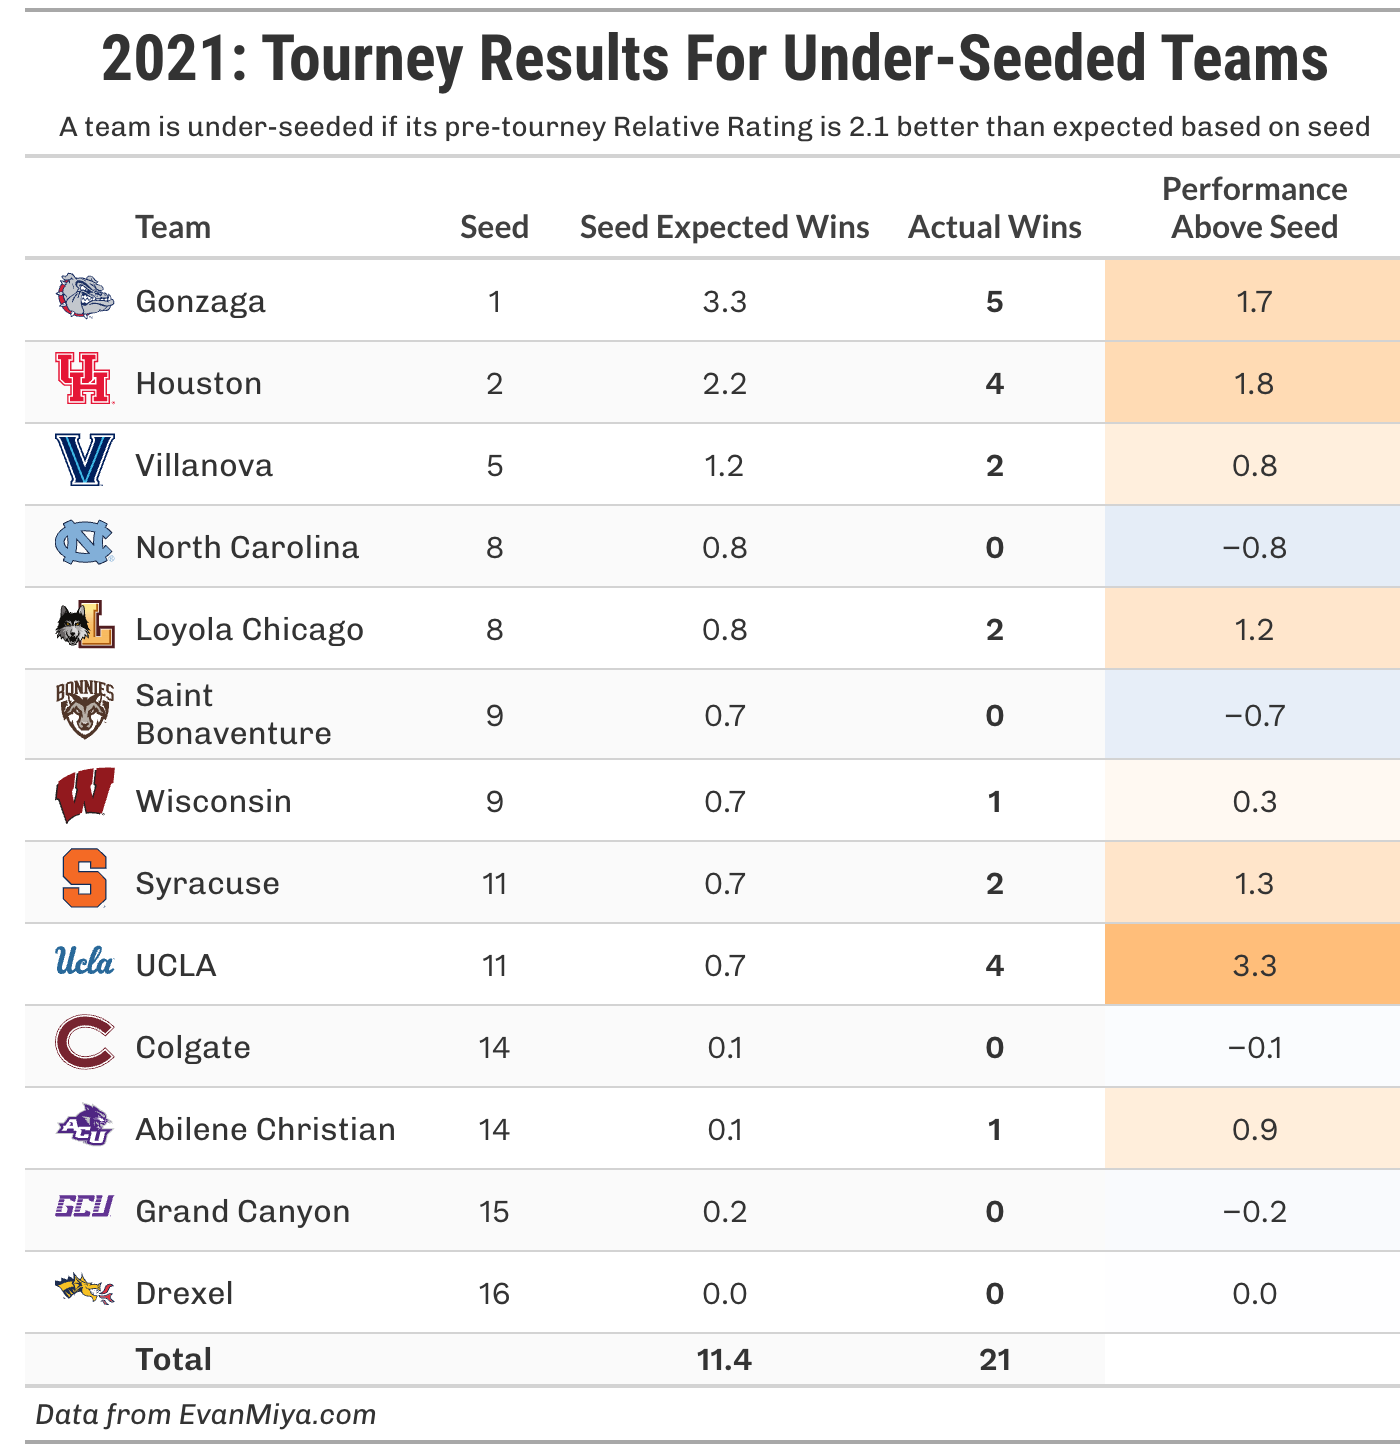
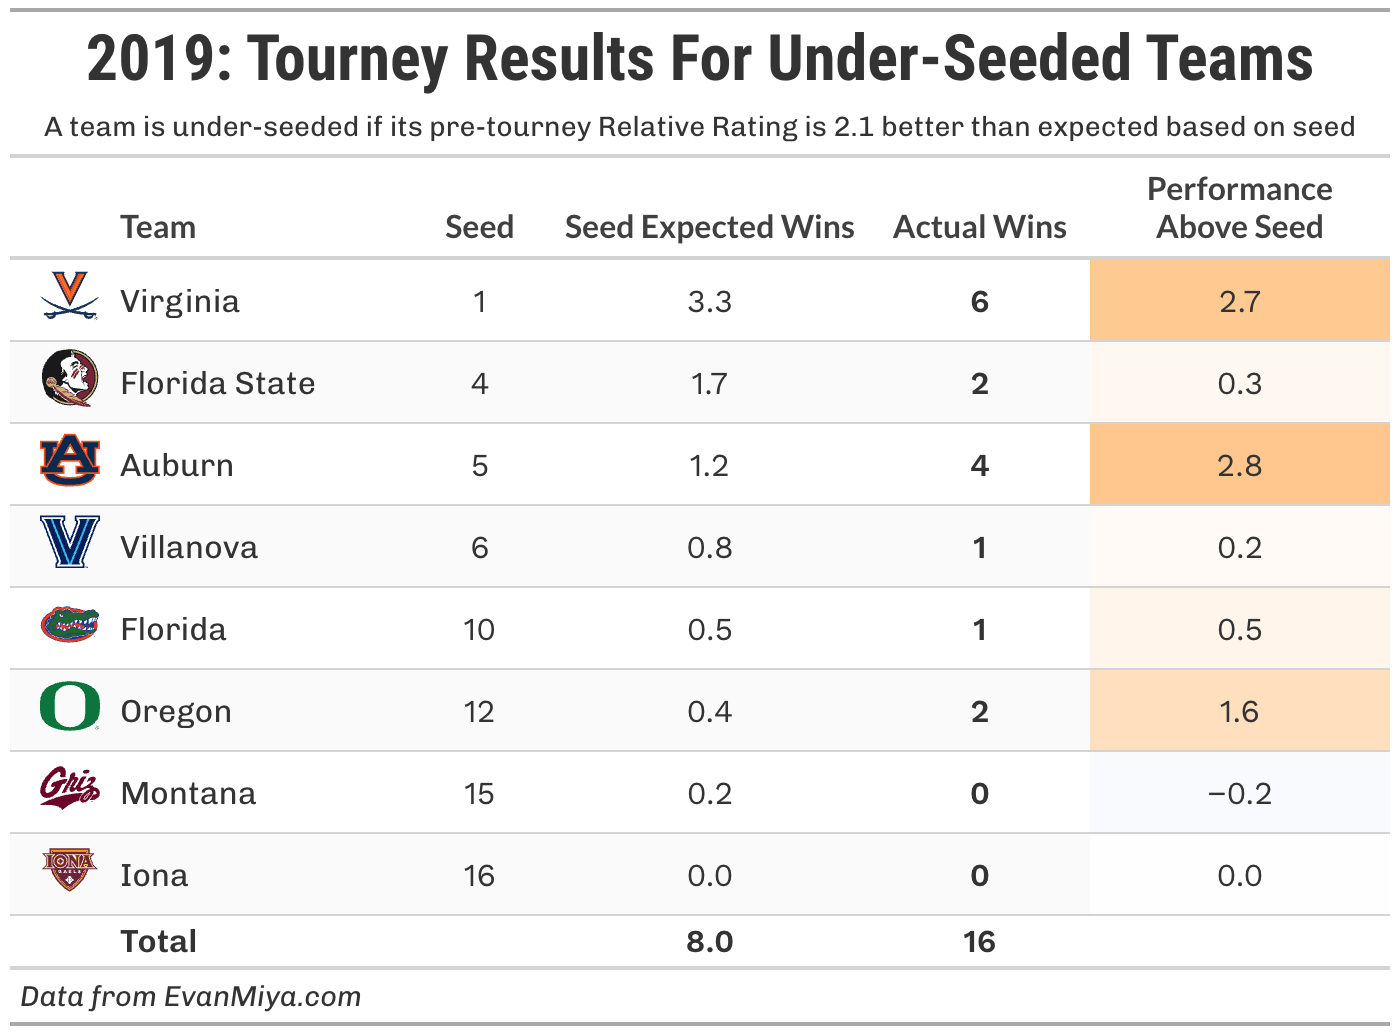
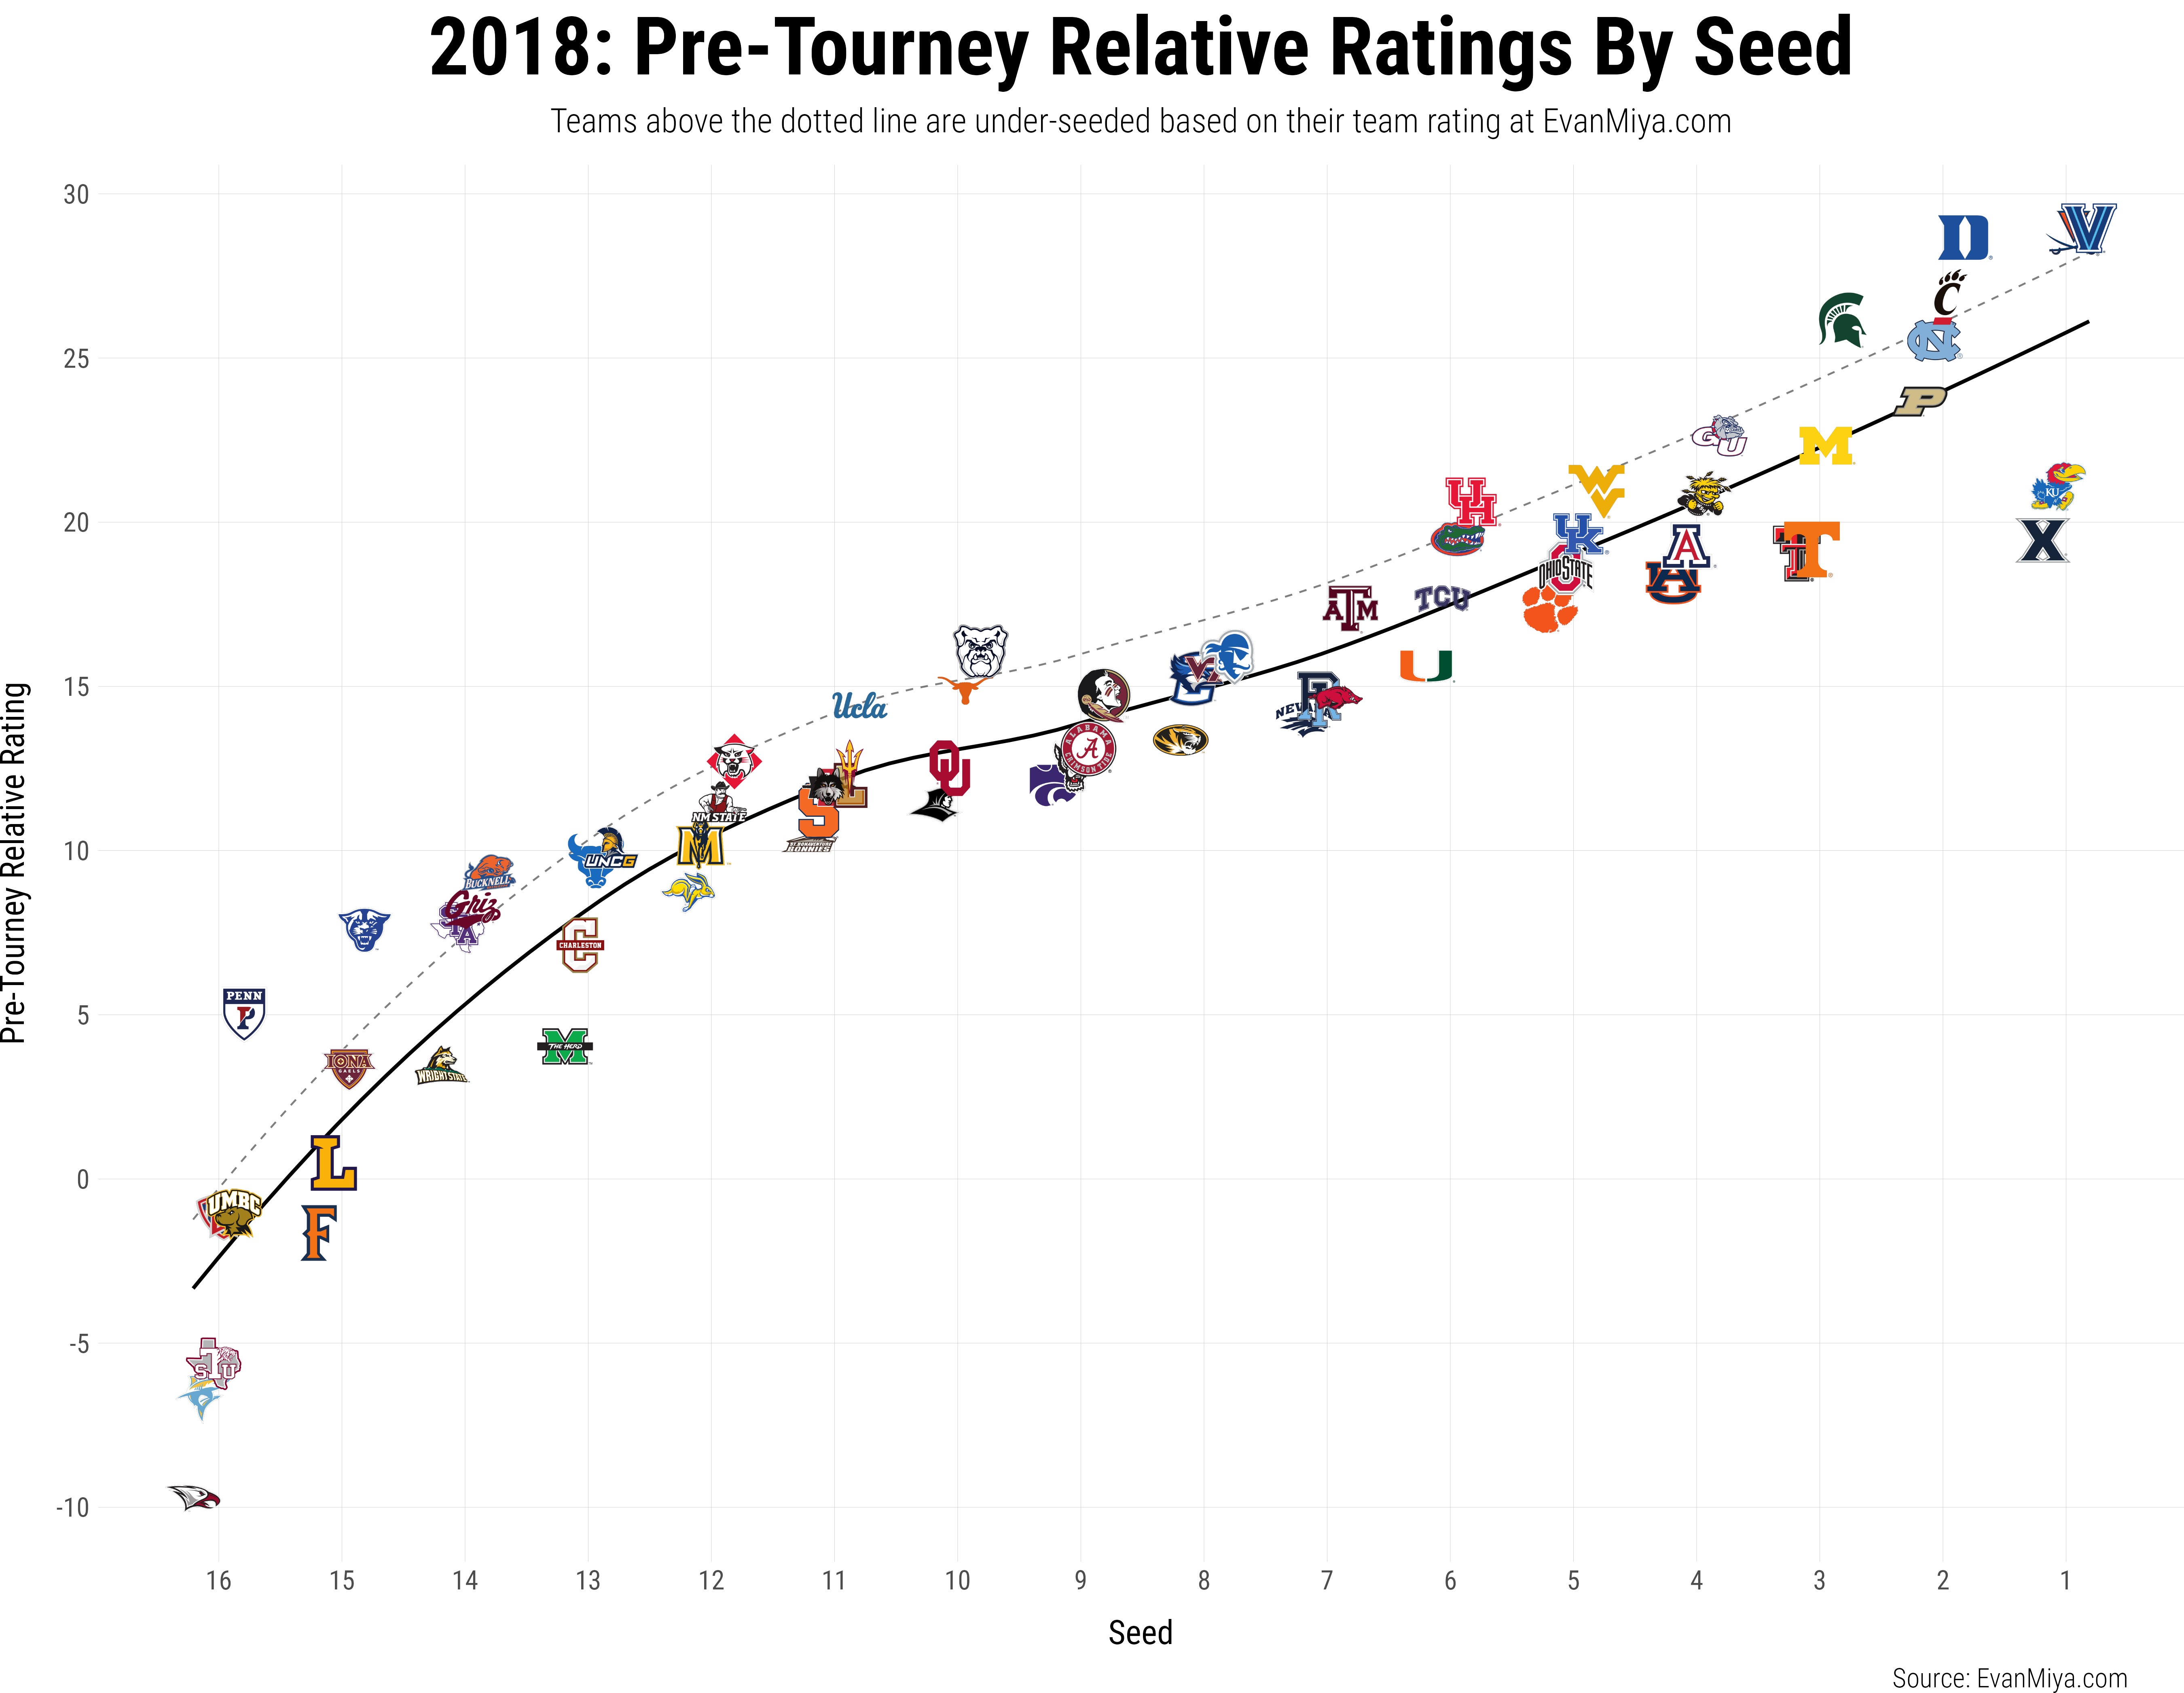
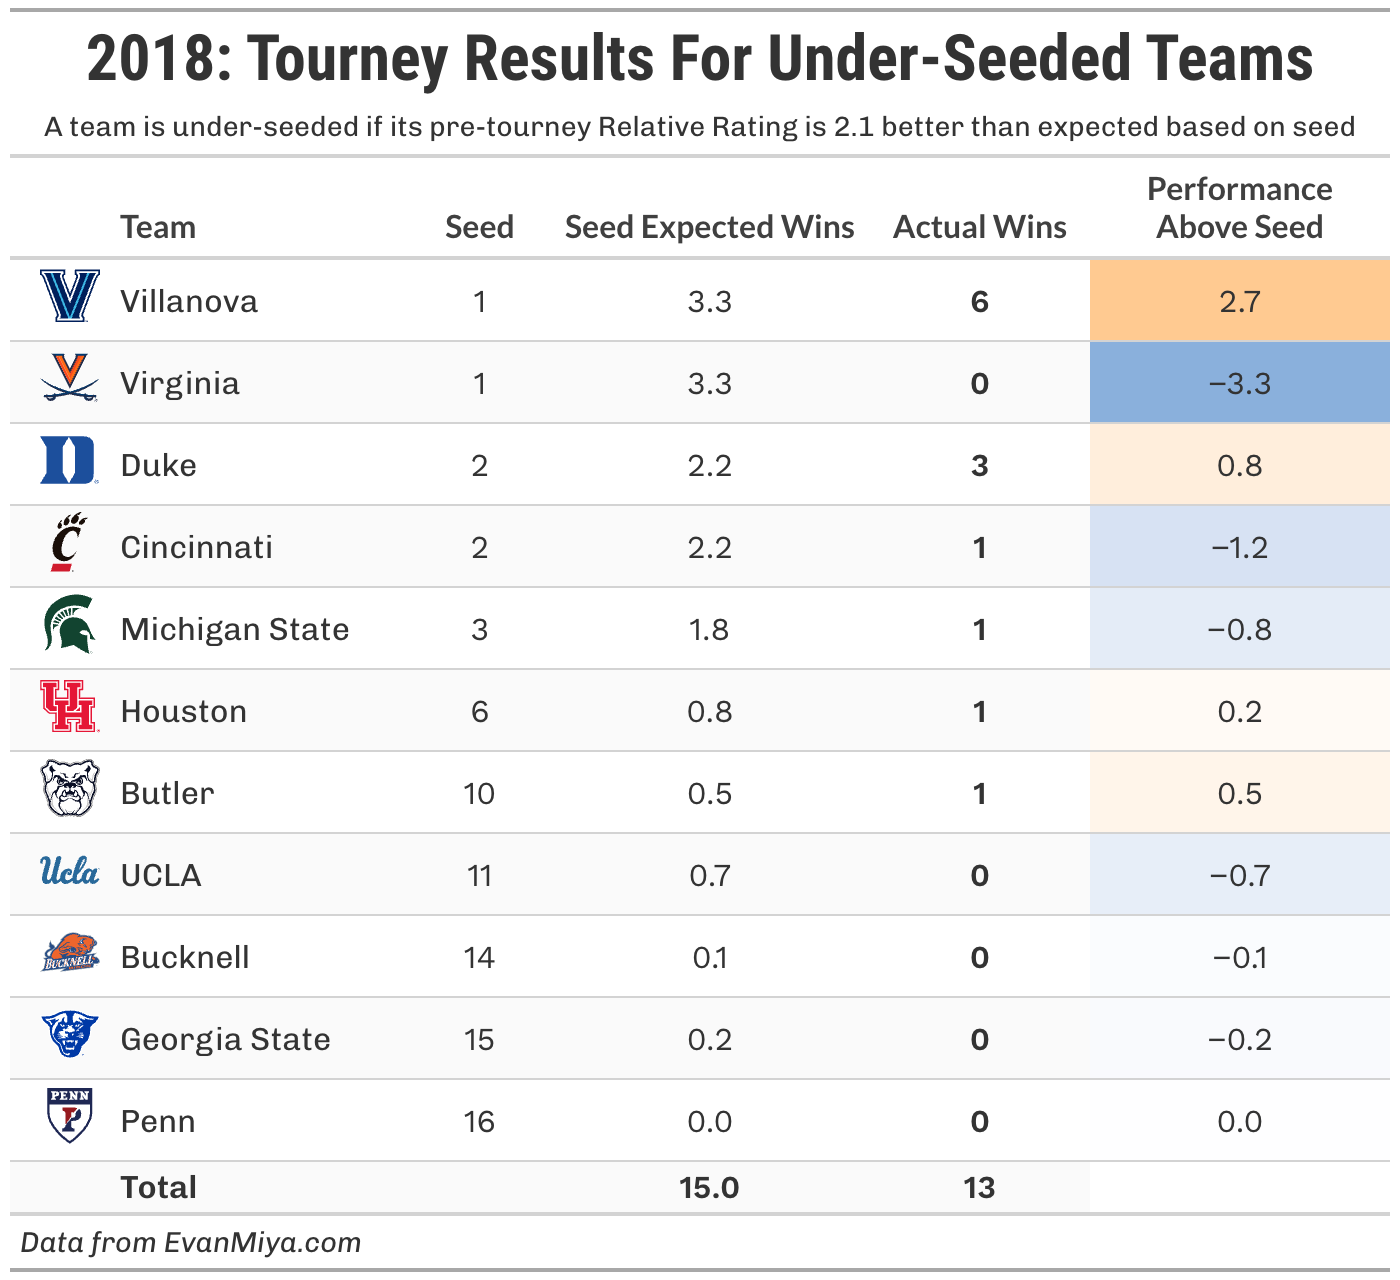
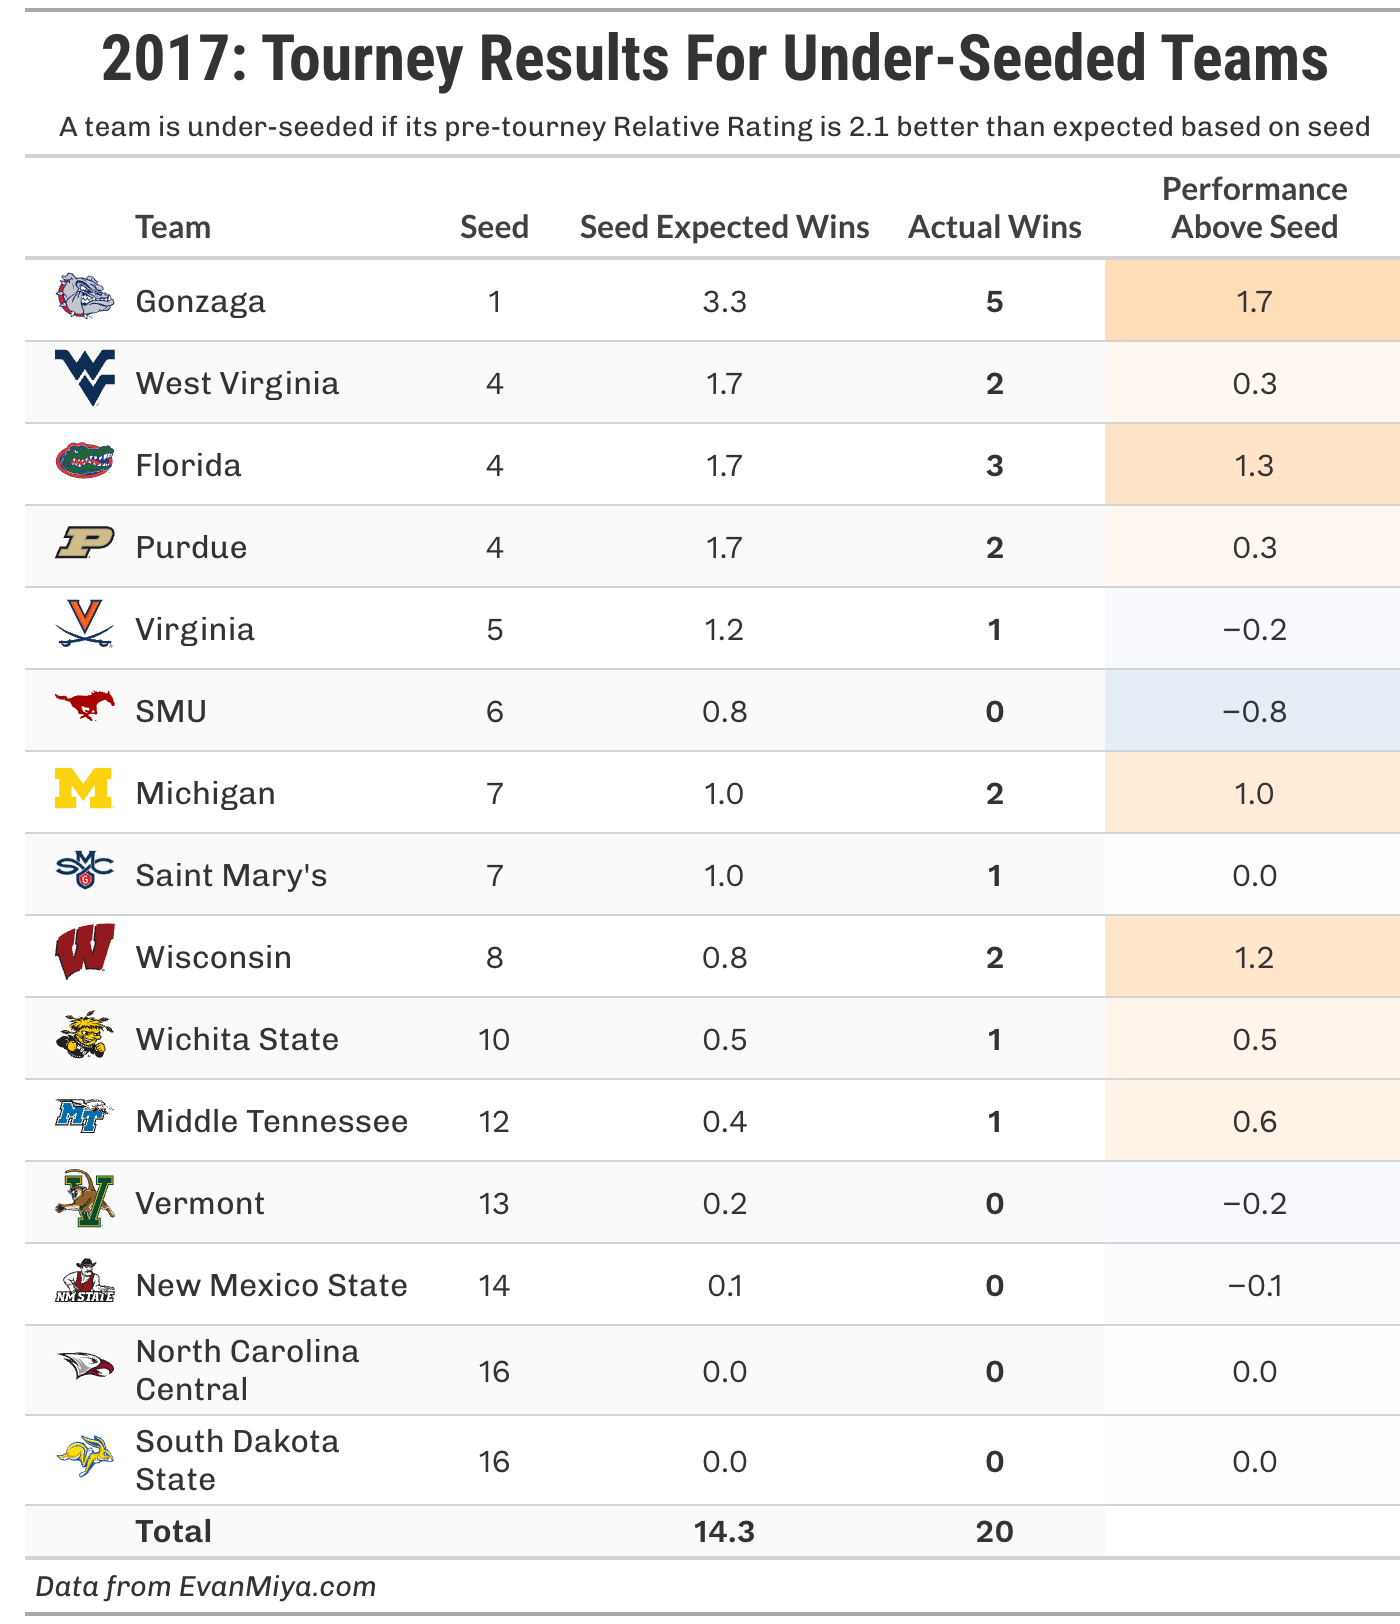
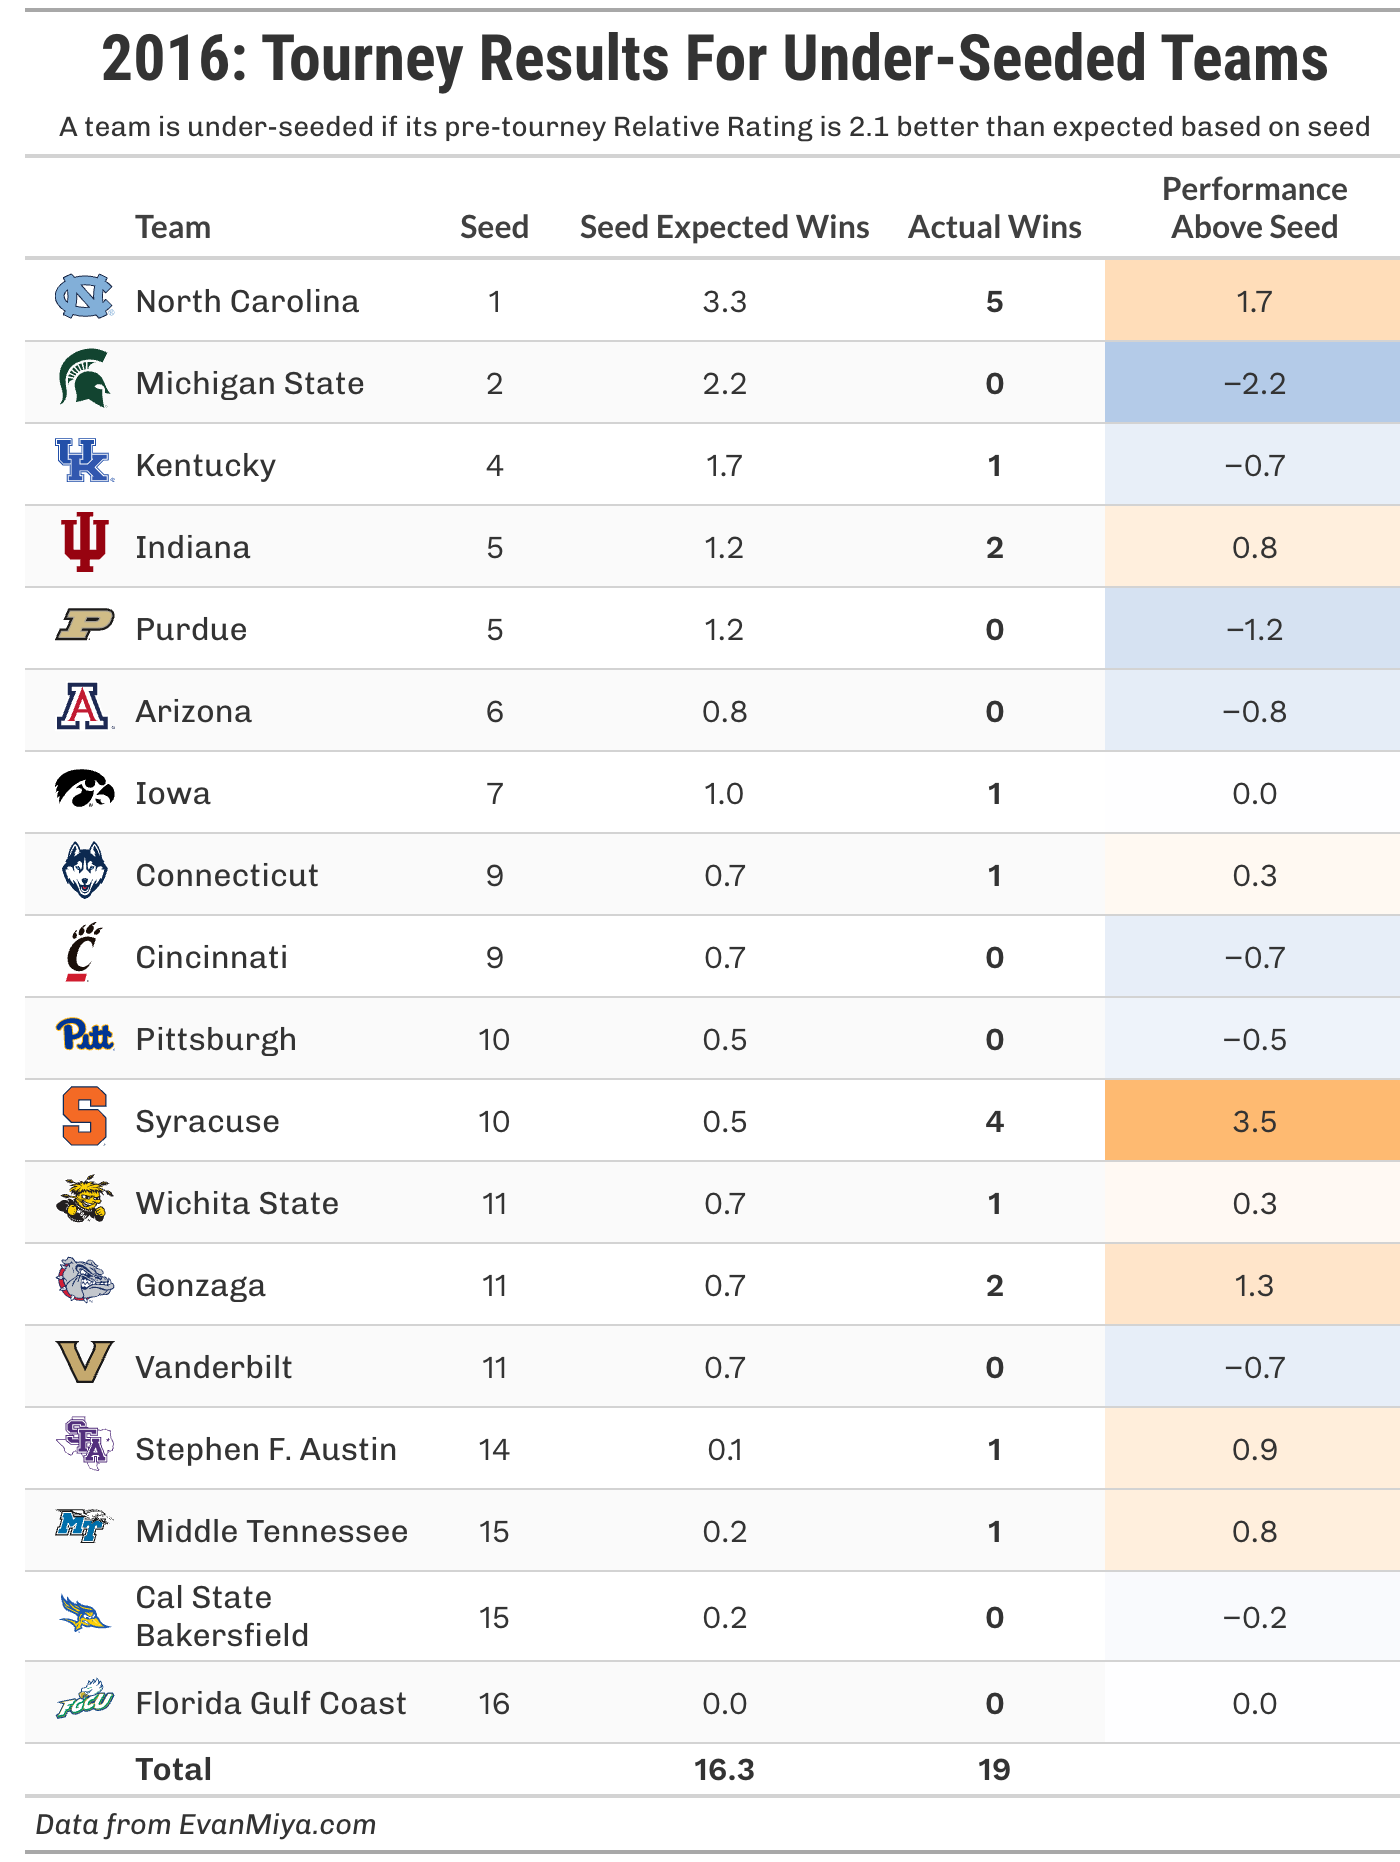
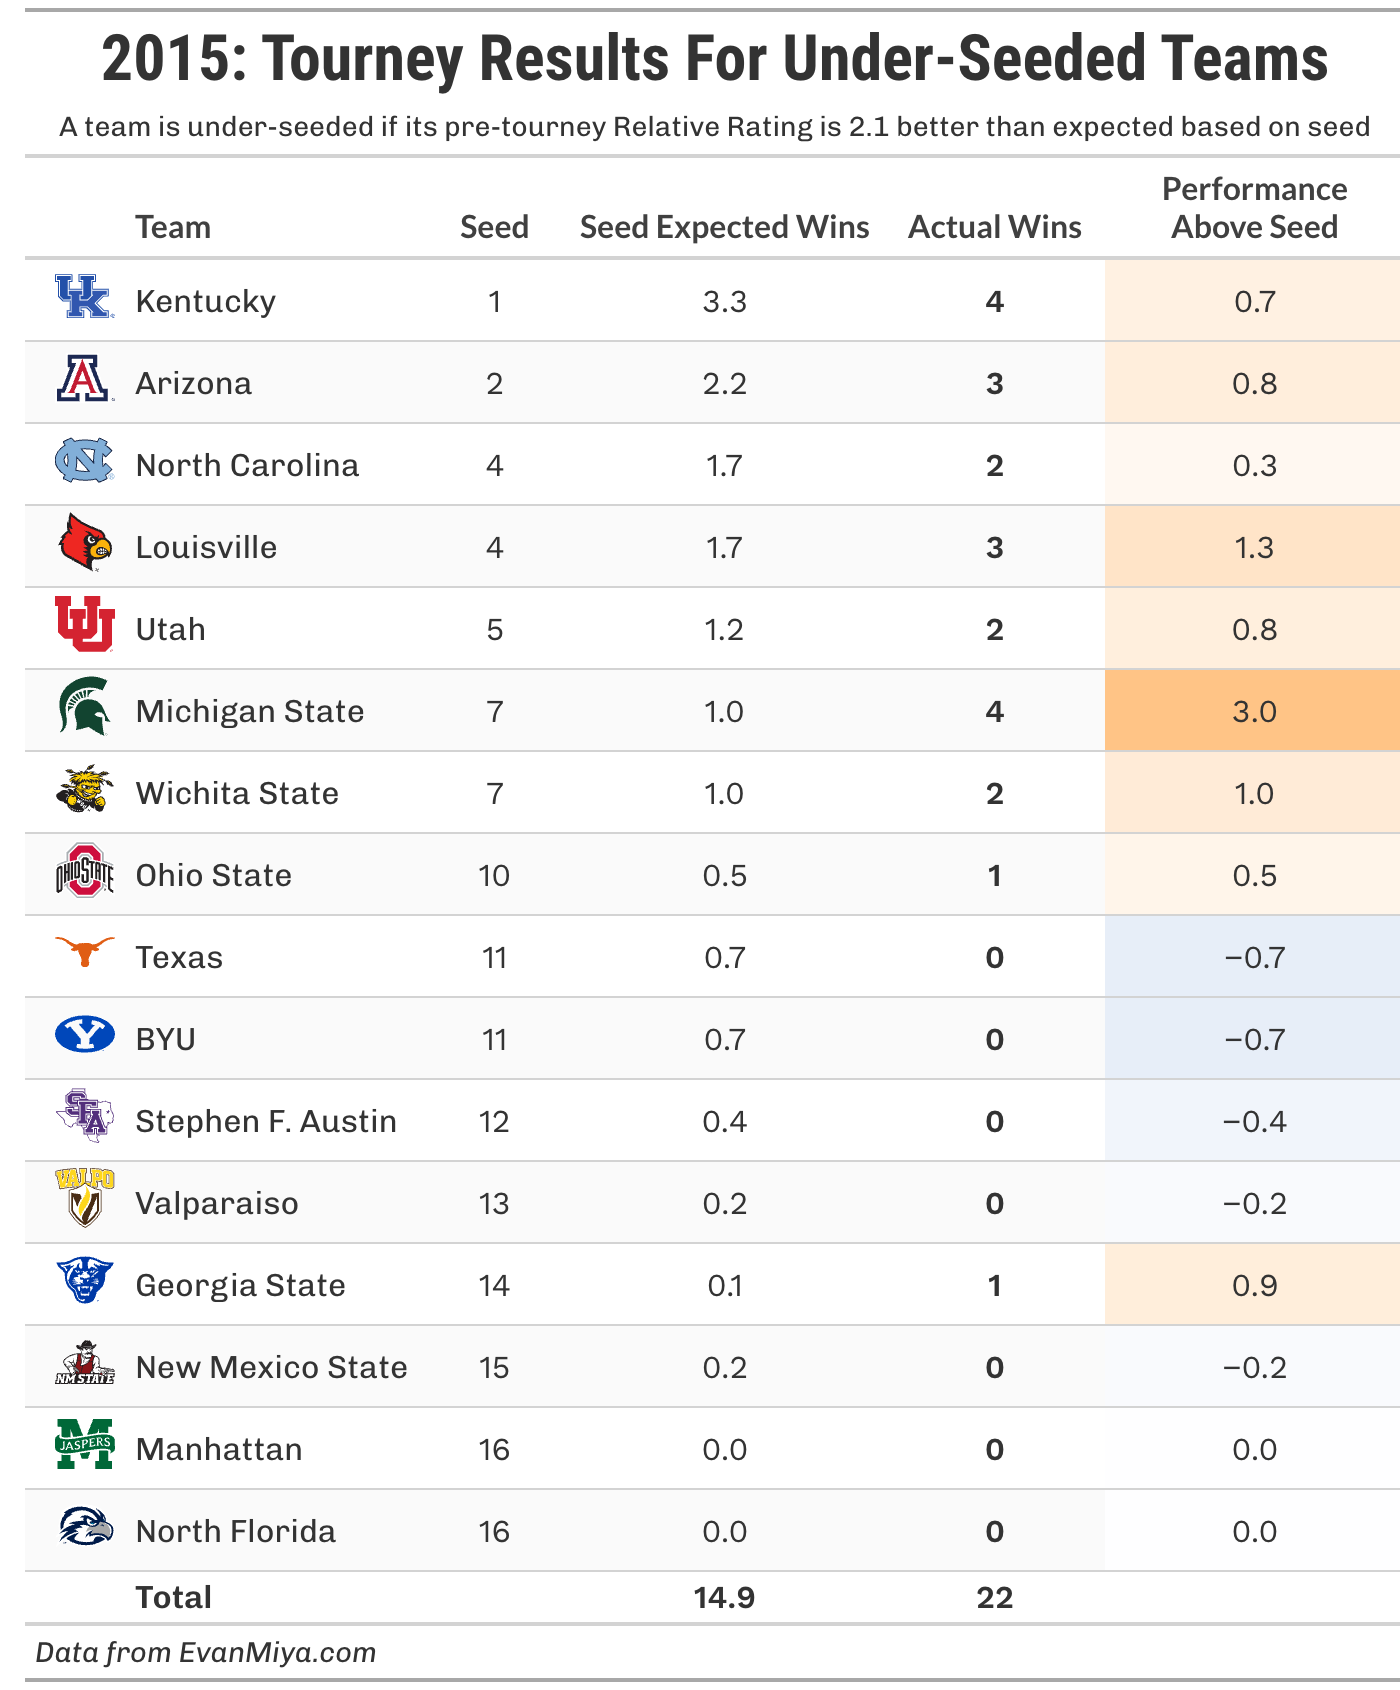
To highlight the success of this method for selecting teams that will advance further in the tournament, I am including a graph of every recent tournament and a table showing how each under-seeded team performed in that bracket.
Admittedly, the 2025 version of this analysis did not do particularly well. Teams labeled as “under-seeded” won only 10 games, which was less than the 12.4 typically expected for teams on those seeds. However, in the past 10 tournaments, the group of teams identified as under-seeded have collectively out-performed seed expectations in eight of the ten tournaments.
2020 (no tournament)
The visualization for relative rating & seed is great
Great article and visuals. Do you have an idea of who is underseeded right now based on bracketology or will you release an article on that when the actual bracket comes out.