

The EvanMiya.com Bracket Primer
Everything from the data that you need to know for your bracket

The bracket is here, and it is beautiful! To give you the best advice for filling out your bracket, I’ve boiled down all the analysis at EvanMiya.com into the most valuable graphics and tools you need.
In this bracket primer, we will discuss:
Who are the true title favorites?
Which teams have the most value based on where they are seeded?
Who are this year’s cinderellas?
What can the “Kill Shot” tell us about tournament success?
Which teams have high ceilings and low floors?
Which teams are the most consistent game-to-game?
Without further ado, let’s dive in!
Predicted Efficiency Landscape
The place to start is by examining each tournament team’s predicted strength at EvanMiya.com and comparing offensive and defensive efficiency. These ratings are adjusted for current injuries, which means teams like Texas Tech (JT Toppin), Duke (Caleb Foster, Patrick Ngongba), UNC (Caleb Wilson), and BYU (Richie Saunders) are appropriately docked for the uncertainty surrounding their players’ availability. You can find complete injury reports, updated daily, in the Matchup Previews tool at EvanMiya.com.
The graph below shows every team’s predicted offensive rating and defensive rating, with teams split into tiers based on their tournament potential:
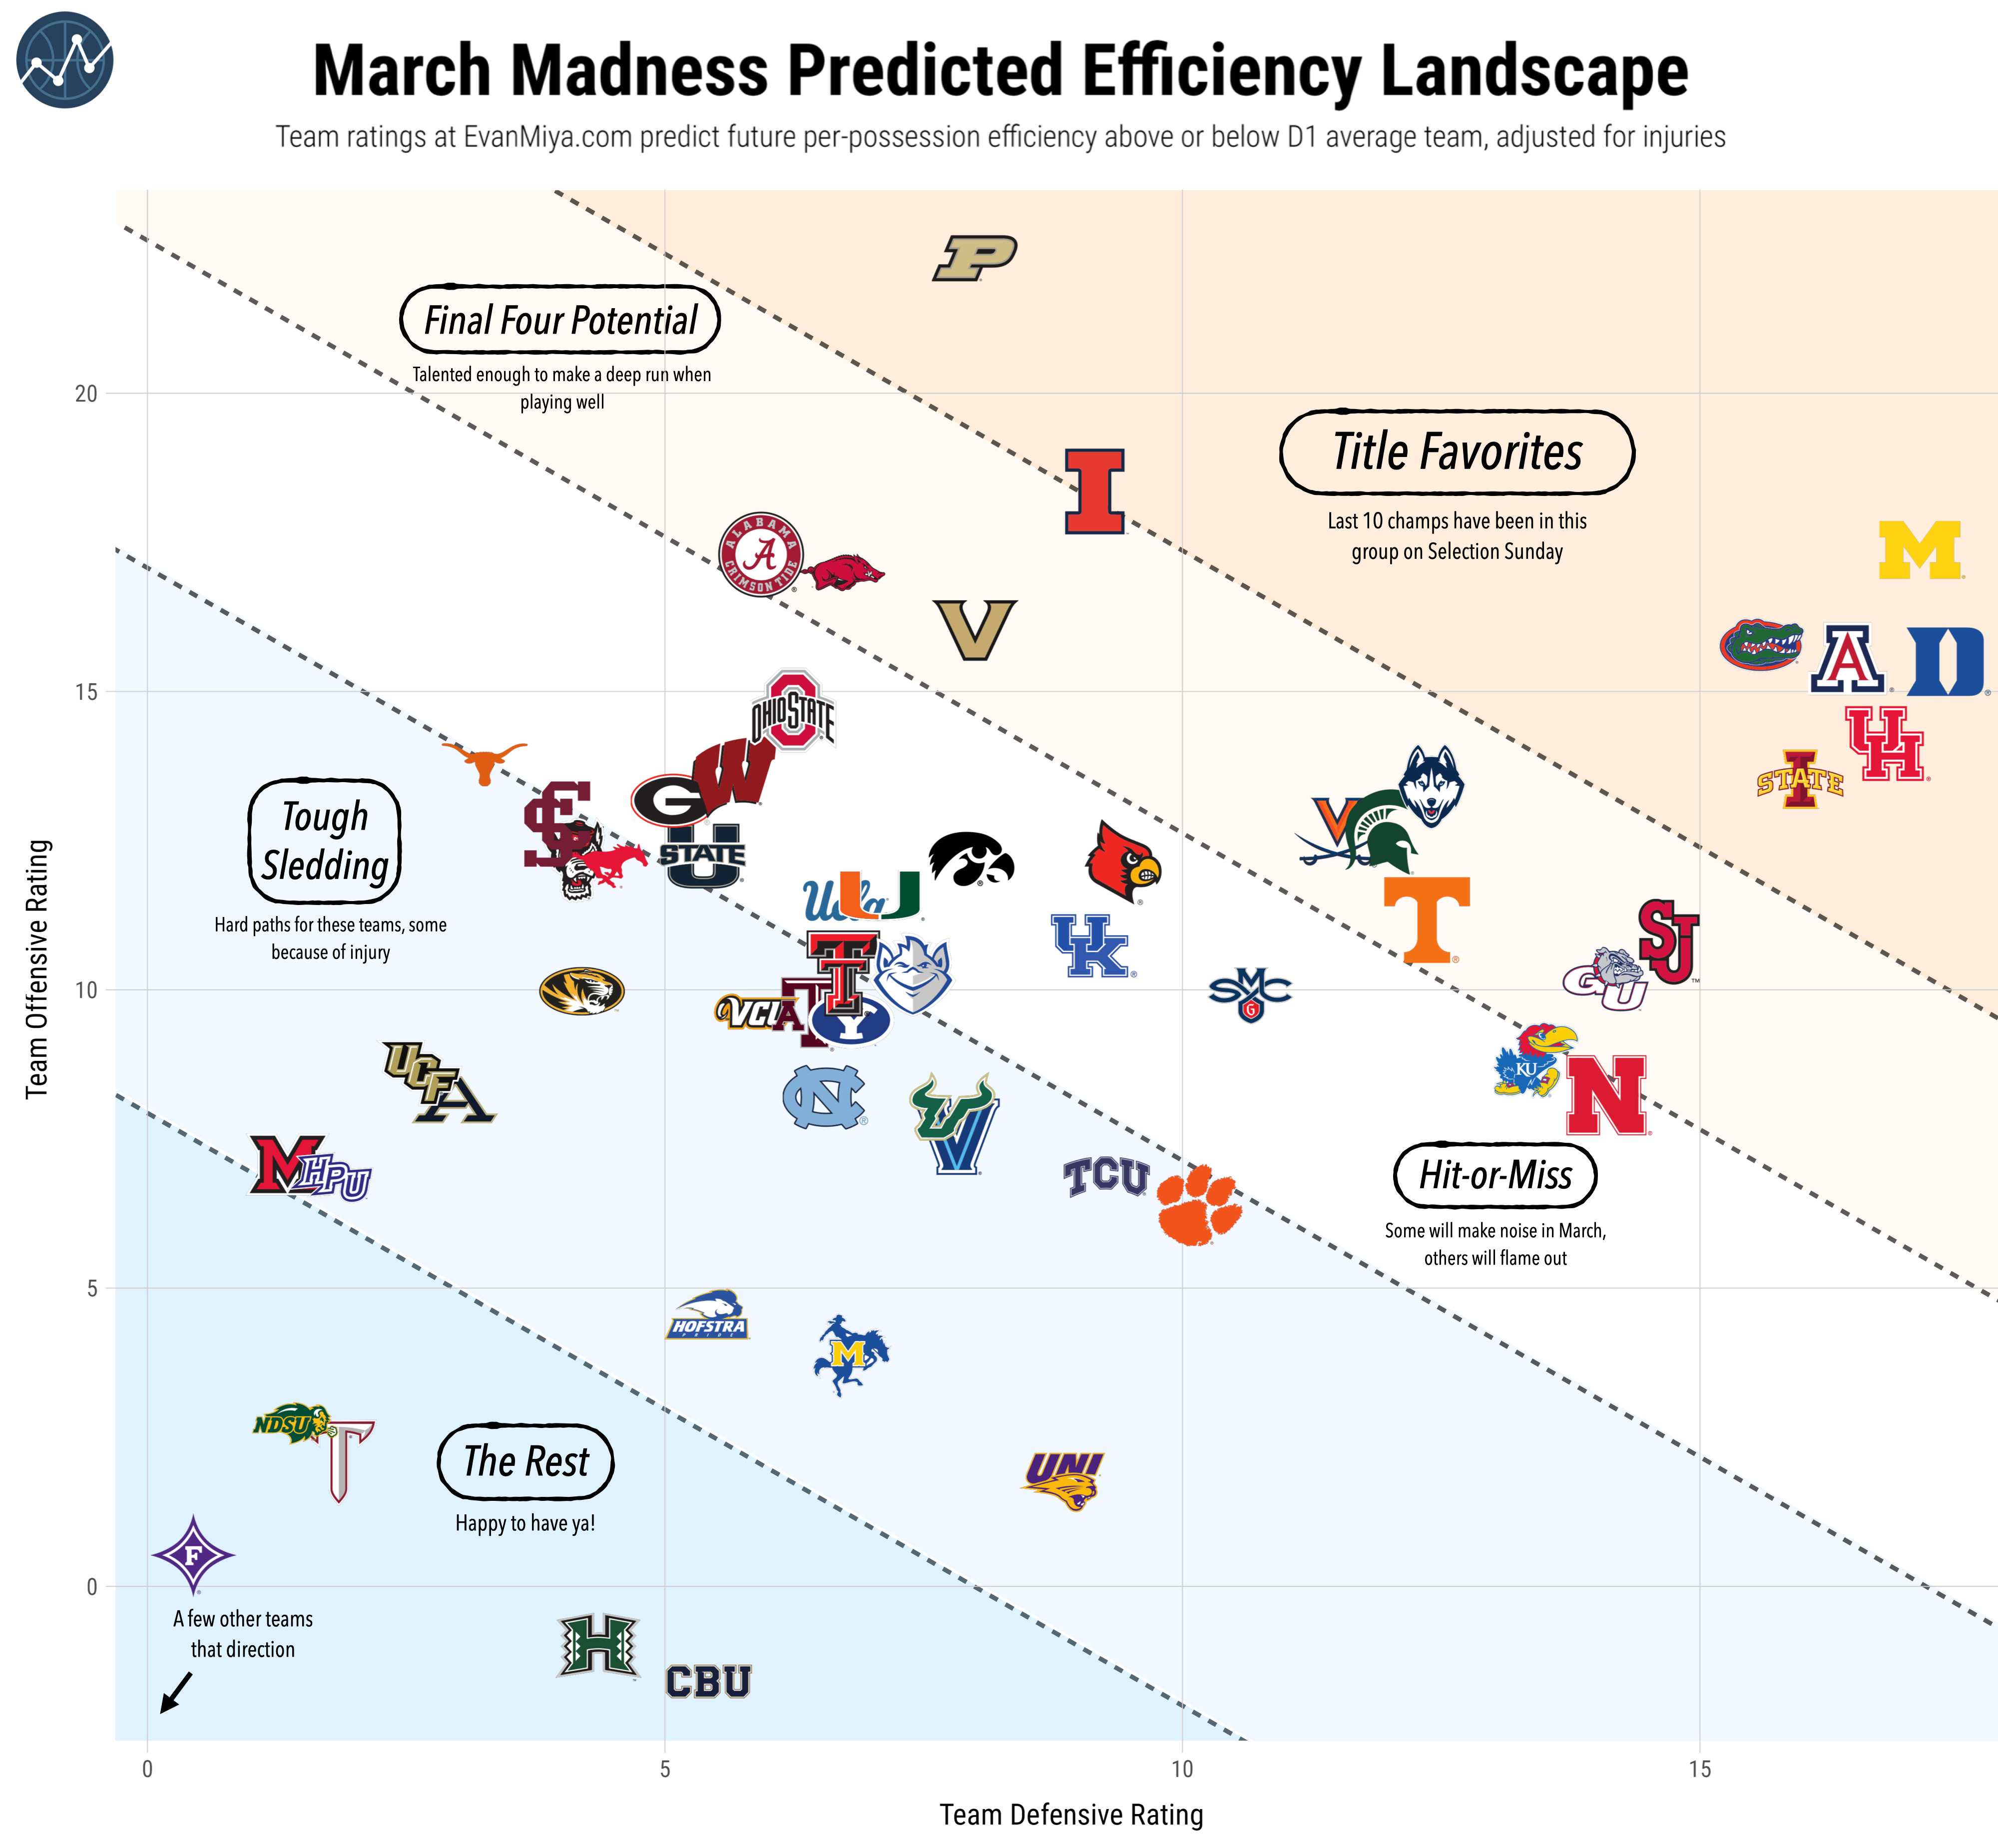
Title Favorites
As mentioned in a previous article, teams heading into the tournament in the “Title Favorites” tier have won the last 10 national titles. This year, eight teams qualify: Michigan (1 seed), Duke (1), Florida (1), Arizona (1), Iowa State (2), Houston (2), Purdue (2), and Illinois (3).
The four 1-seeds, in particular, are strong again this year. According to bracket simulations at EvanMiya.com (at the bottom of the article), there is a 78% chance that a 1-seed will win the title, which is even better than the actual track record of 1-seeds. Since 2000, 18 of the 25 national champs (72%) have been 1-seeds. There is a 9.1% chance that we get consecutive Final Fours with all 1-seeds.
Tournament Team Strength vs Bracket Seed
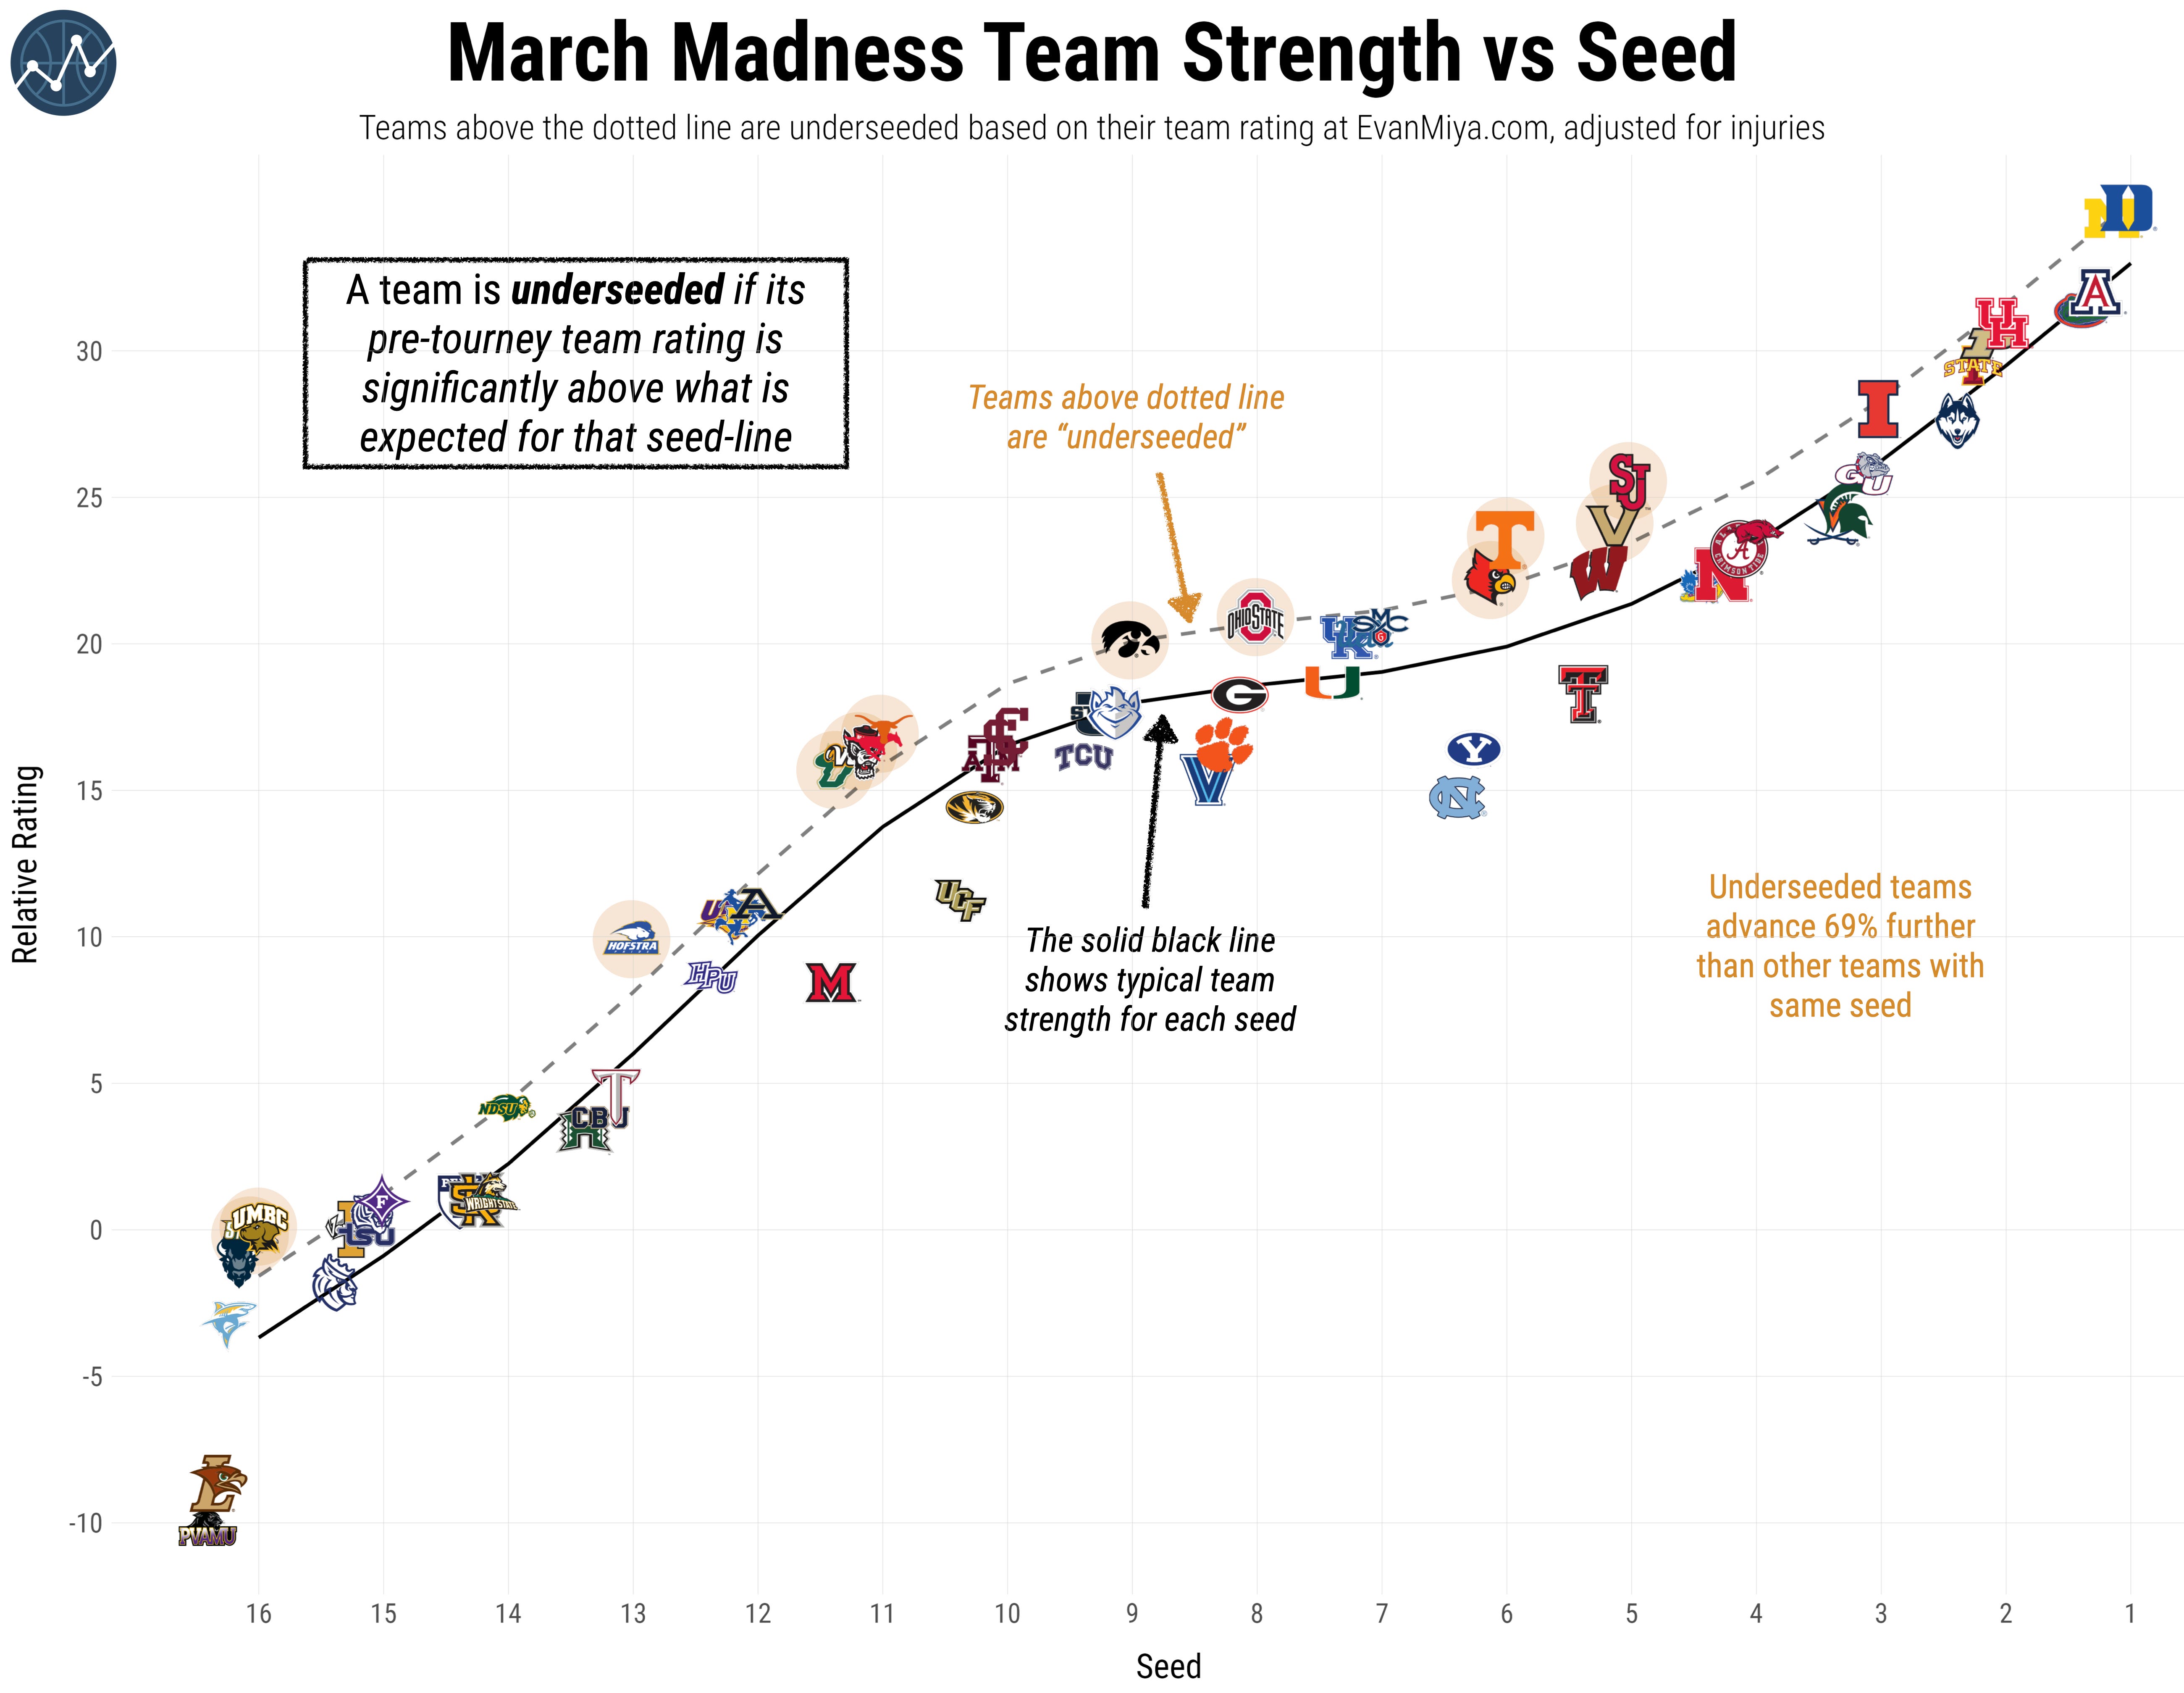
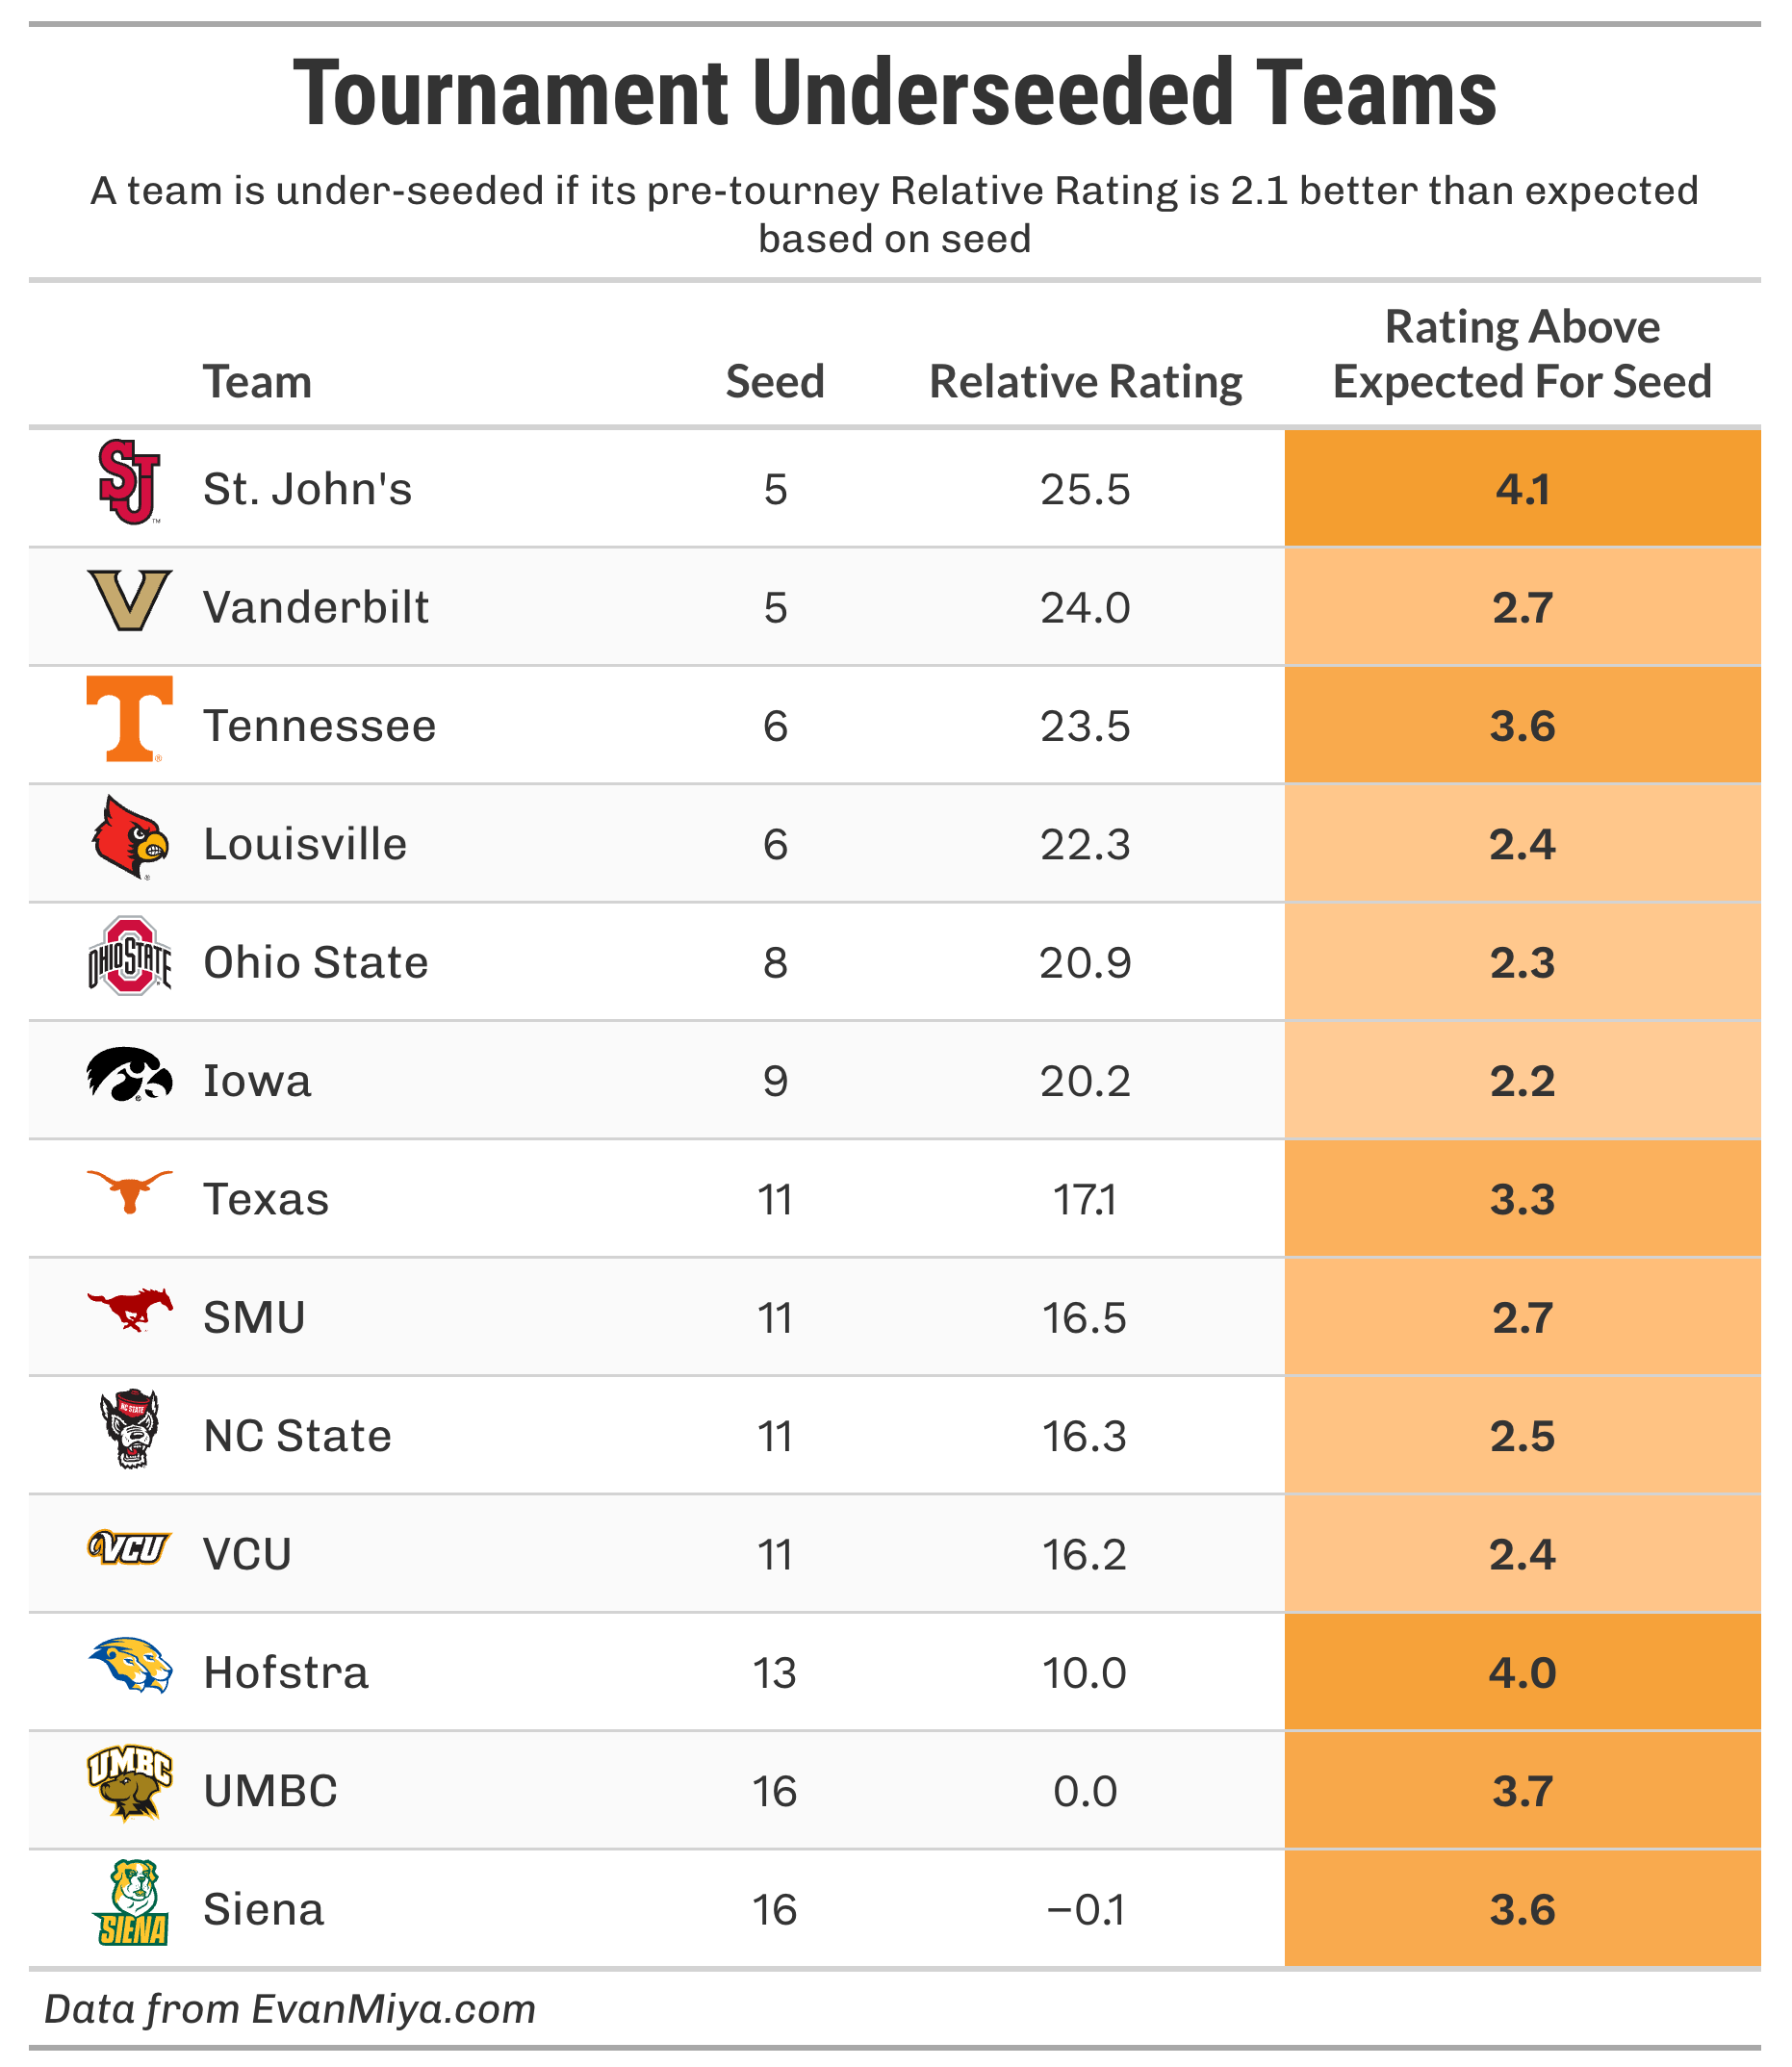
To better understand how these team ratings compare to each team’s seed, I present the graph below, which highlights teams that are much stronger or weaker than usual for their seed. This is really where we can find value in the predictive analytics. Teams highlighted in orange are considered “underseeded” and advance 69% further than other teams with the same seed.
This year, 13 teams qualify as underseeded because they are much better than their seed would suggest. Of these teams, the ones that really stick out are 5-seed St. John’s, 6-seed Tennessee, 11-seed Texas, and 13-seed Hofstra, all of which have a predicted team strength much better than their seed.
This year, the group of 11 seeds is particularly strong relative to other teams around them. VCU is favored to beat 6-seed UNC in their first-round matchup, and the winner of Texas and NC State will be in a pick-em game versus BYU in the first round. Ohio State was always going to have a tough time getting to a Sweet 16, but if there’s any 8-seed to it this year, it’s the Buckeyes.
St. John’s has the best chances of advancing to the Final Four (8.9%) of any team not in the top three seed lines. If they advance past Northern Iowa, they would face the winner of Kansas/Cal Baptist, with a likely Sweet 16 matchup against Duke after that.
On the flip side, some overseeded teams are likelier to come up short in the tournament than usual expectations for their seeds: 5-seed Texas Tech (JT Toppin out), 6-seeds BYU (Richie Saunders out) and North Carolina (Caleb Wilson out), and 8-seed Villanova.
The Kill Shot
This wouldn’t be an EvanMiya.com article without analyzing the “Kill Shot”, any time a team scores 10 or more unanswered points in a game. Teams that go on many of these 10-0 scoring runs are more able to erase a deficit quickly and can also easily close the door on an opponent in a tight contest. Similarly, teams that limit opponents’ “Kill Shots” are more likely to hold on to a lead rather than allow another team back into the game.
Before we jump into analyzing individual tournament teams, here are the stats about scoring runs that you need to know:
A team with at least one 10-0 run wins 71% of the time
A team with more Kill Shots than the opponent wins 81% of the time
A team with 2 Kill Shots in a game wins 88% of the time
A 15-0 run leads to a win 86% of the time
A 20-0 run leads to a win 91% of the time
The graph below shows the landscape of tourney teams in 2026 in terms of scoring runs per game and scoring runs conceded per game, adjusted for opponent quality:
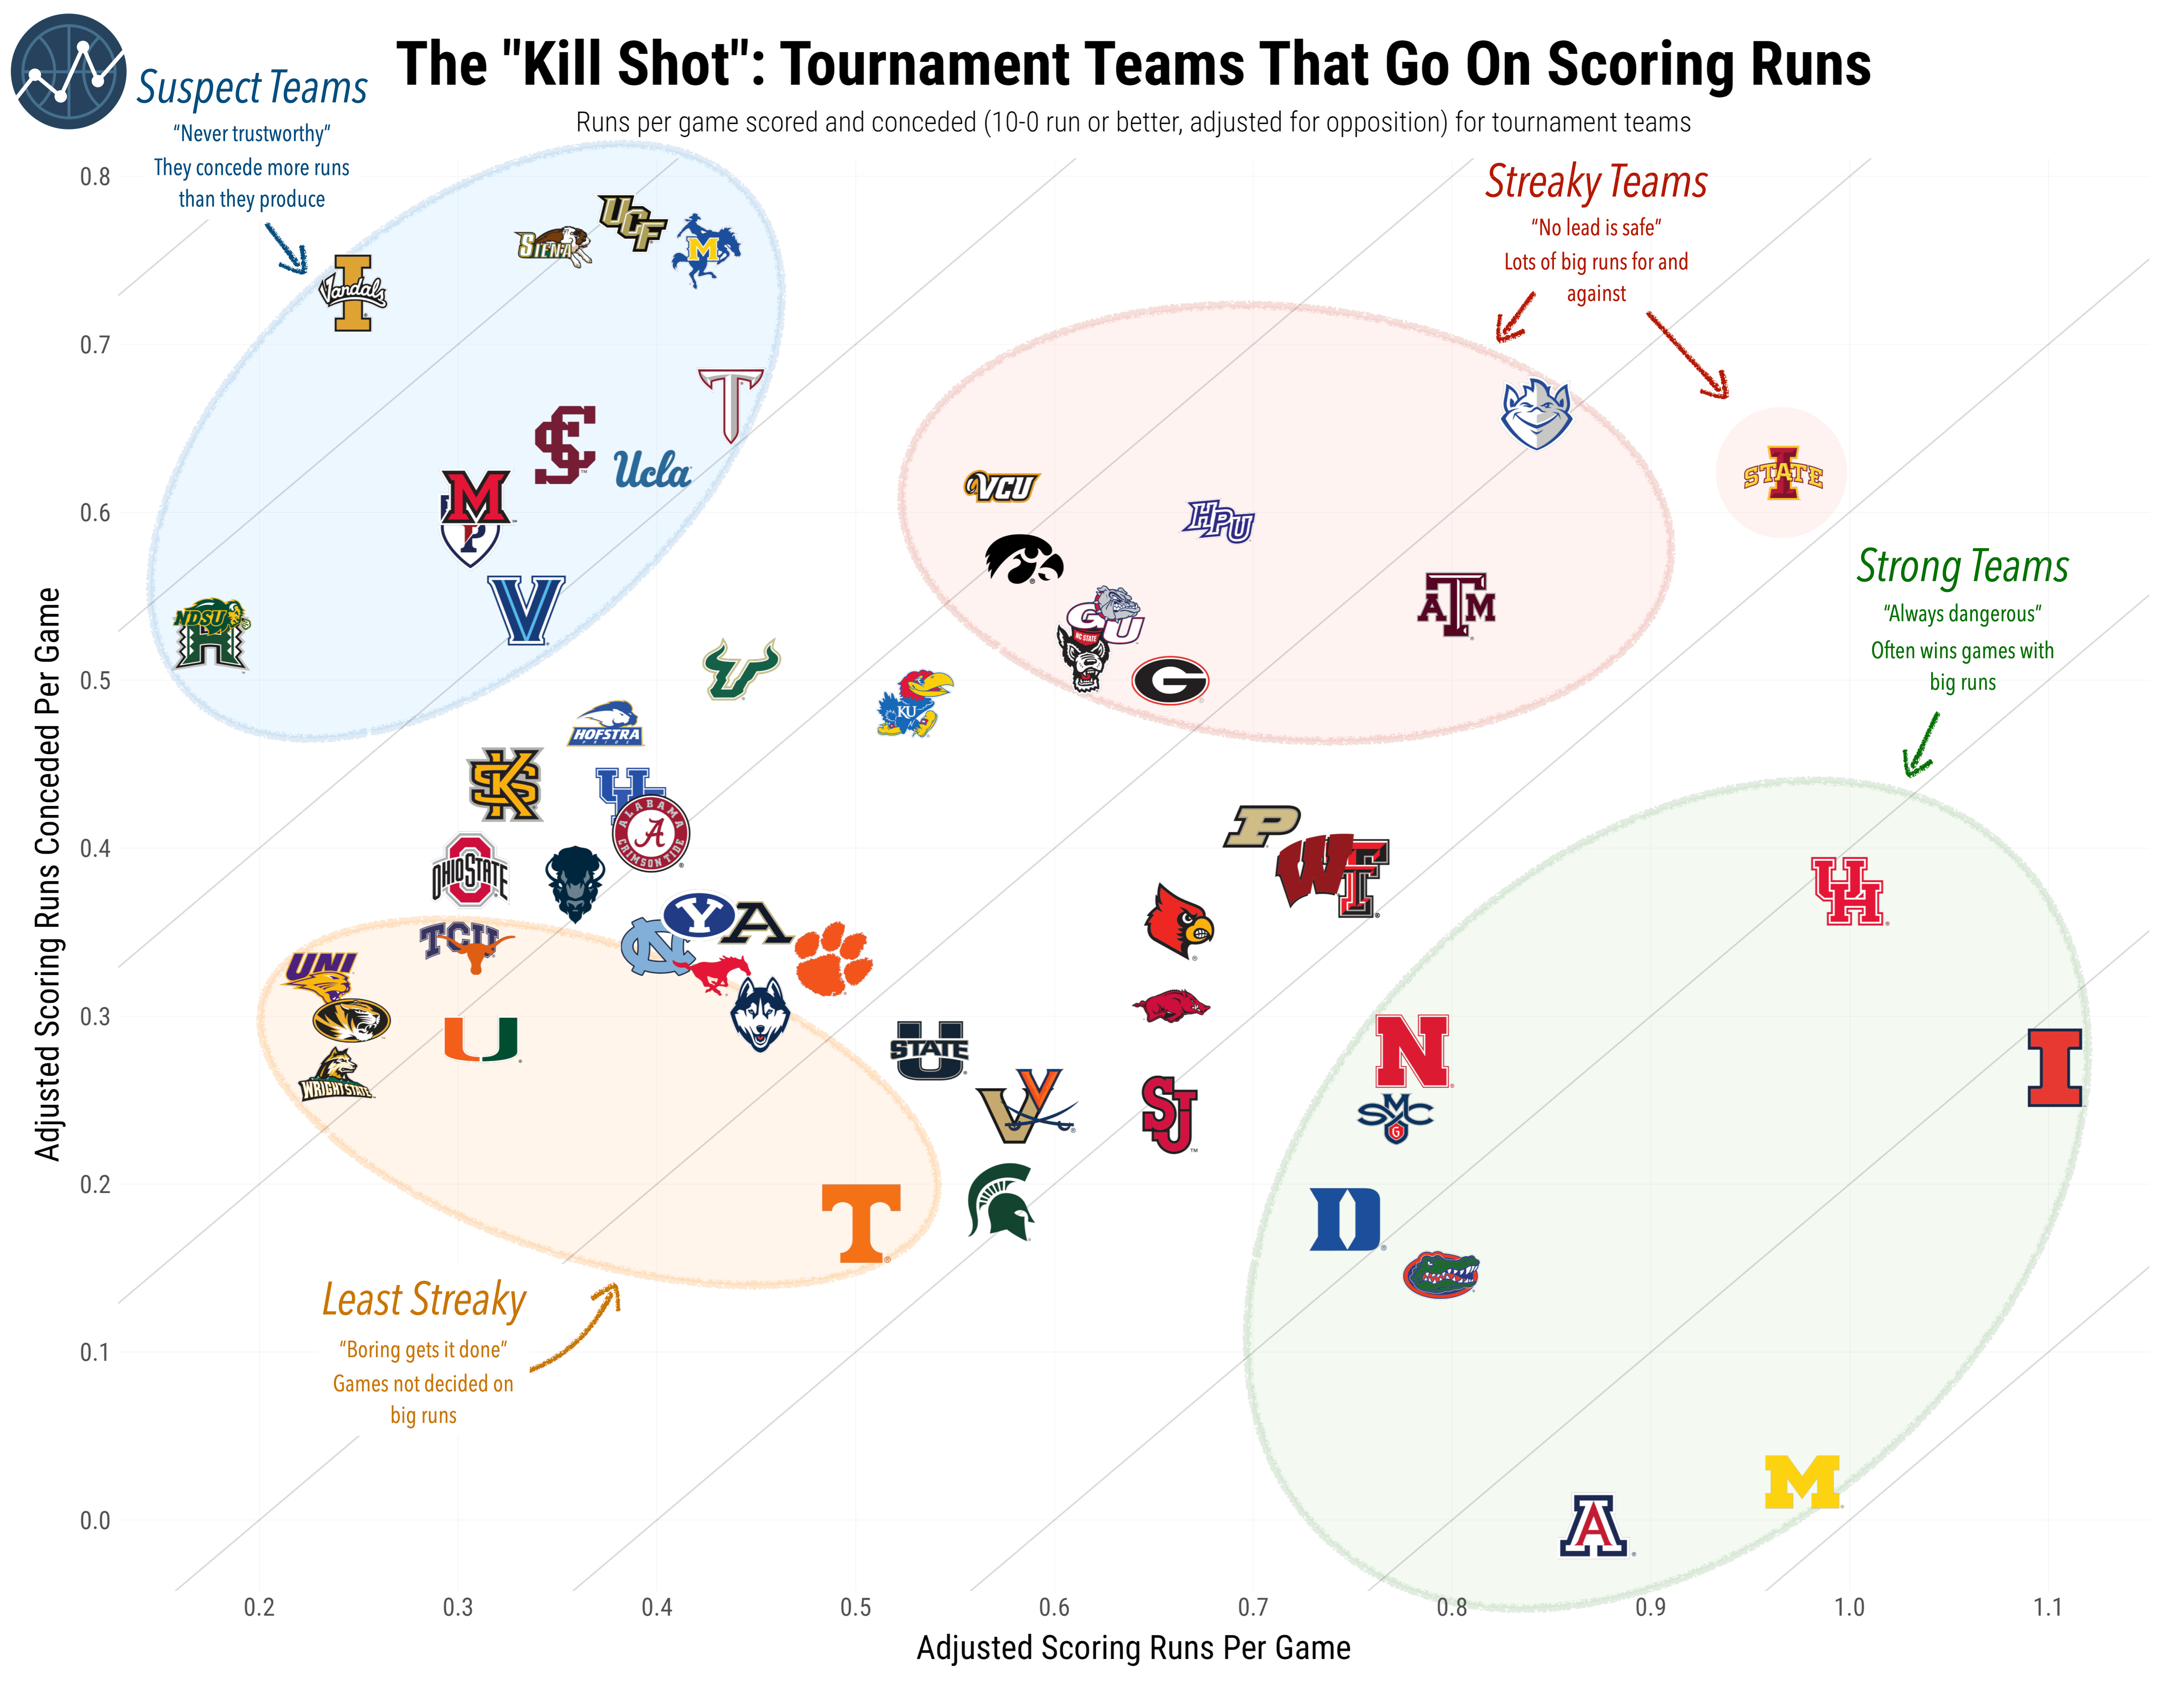
As shown on the graph, I like to put teams in four categories: “Strong” teams, “Streaky” teams, “Least Streaky” teams, and “Suspect” teams.
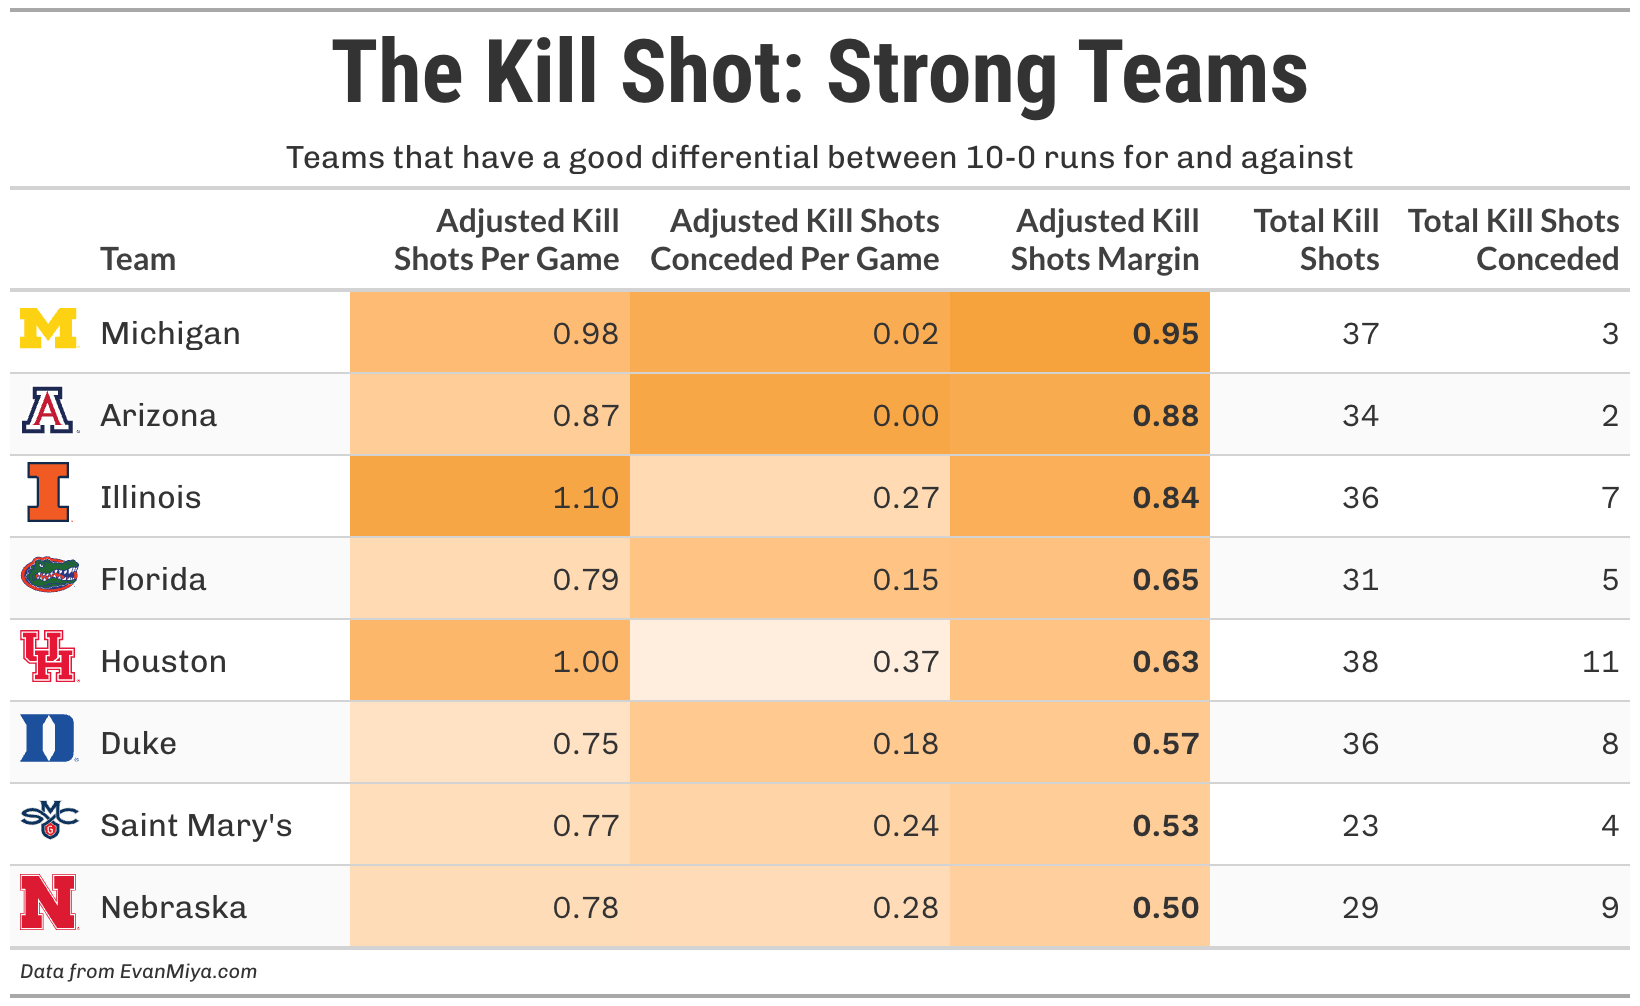
All the major title favorites fall in the “Strong Teams” category, but Saint Mary’s and Nebraska are here as well.
Michigan is the best team overall at going on 10-0 runs and not giving them up in return. Meanwhile, Arizona has only given up a single Kill Shot in a meaningful game all season.
Illinois has the best adjusted Kill Shot rating of any team, meaning that they are more likely to generate a 10-0 run than any team in the field.
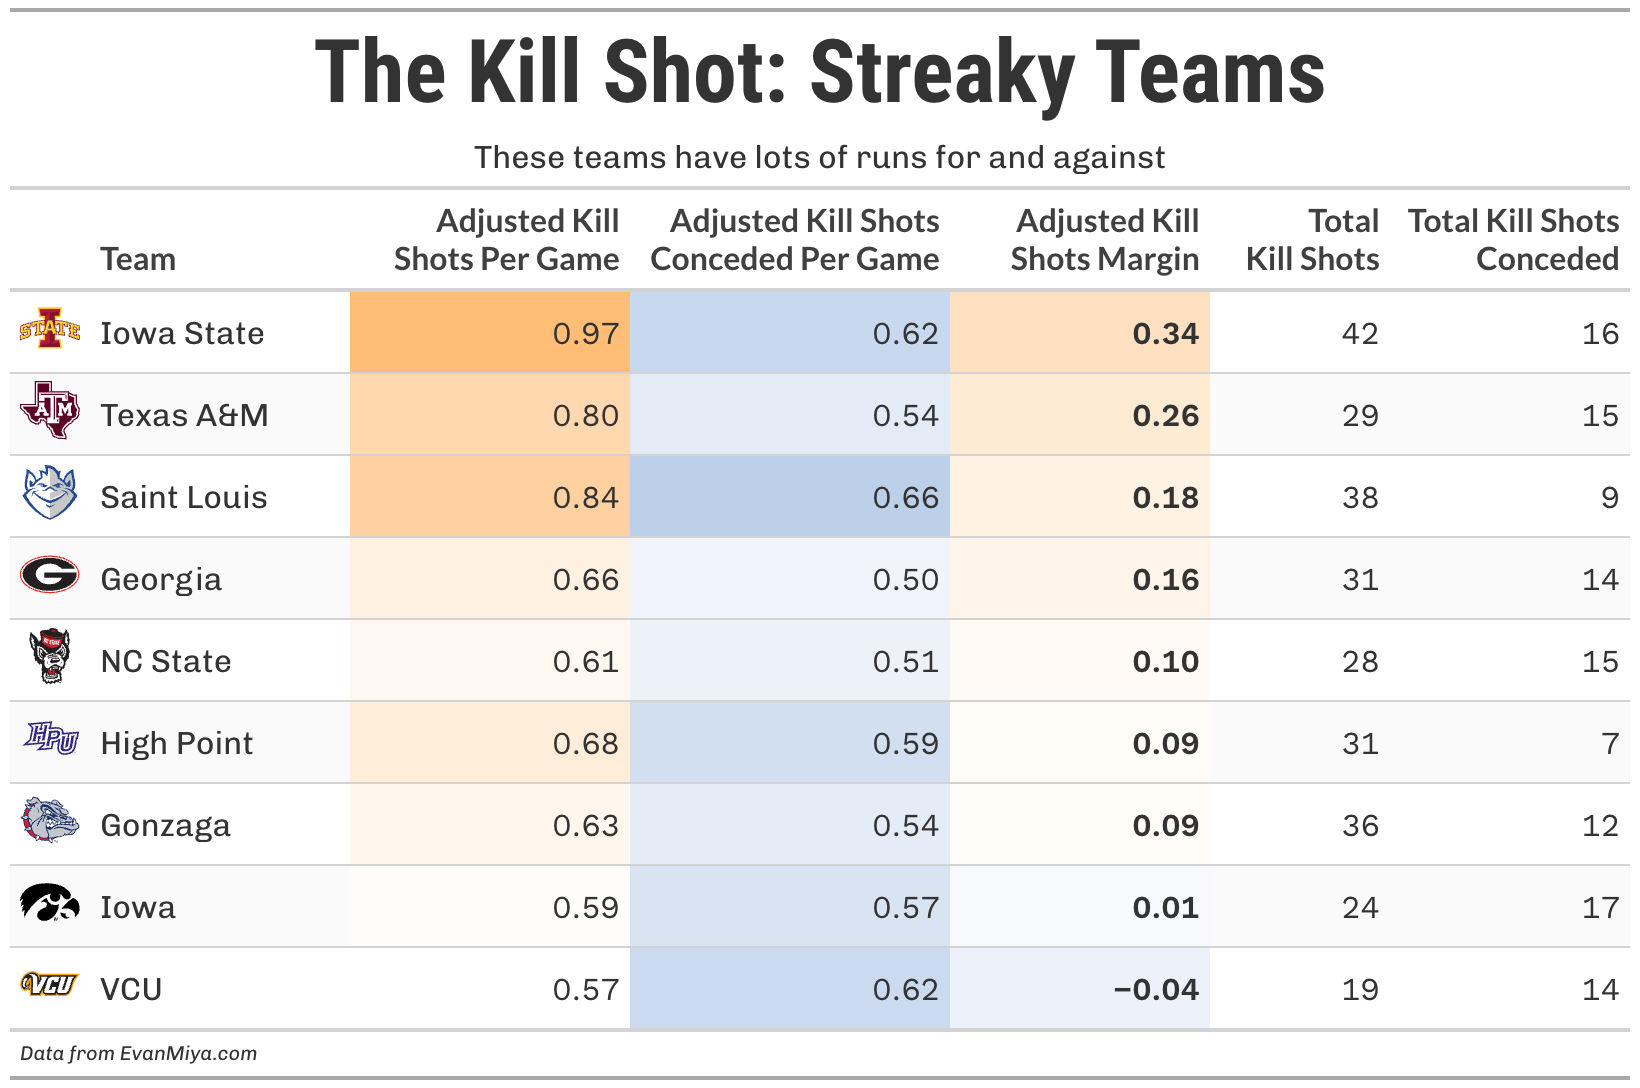
This is where we can really have some fun with this metric. The nine tournament teams in the “streaky” category are all very capable of going on scoring runs… but they also give them up just as quickly. Games with these teams are often wild, with quick lead changes back and forth. No game with a “streaky” team is over, win or lose, until the very end.
There are two main takeaways for teams in the “streaky” category. First, they are vulnerable as a favored team but have greater upset potential when they are the underdog. Because scoring spurts can happen at any time in either direction, their games are very unpredictable. A team like Iowa State could either flame out in an early round or get hot and go deep in the tournament. And you really don’t know which one will happen.
The other takeaway is that live spreads for games involving these teams could be less accurate, as any lead could be vaporized quickly. If a team like Saint Louis is down 10 at halftime, they will be more likely to mount a comeback than most other teams of similar quality.
In contrast to the last category, we now look at teams in the “least streaky” group, which are more boring by nature. These teams have not had as many 10-0 runs this season, but they rarely give them up.
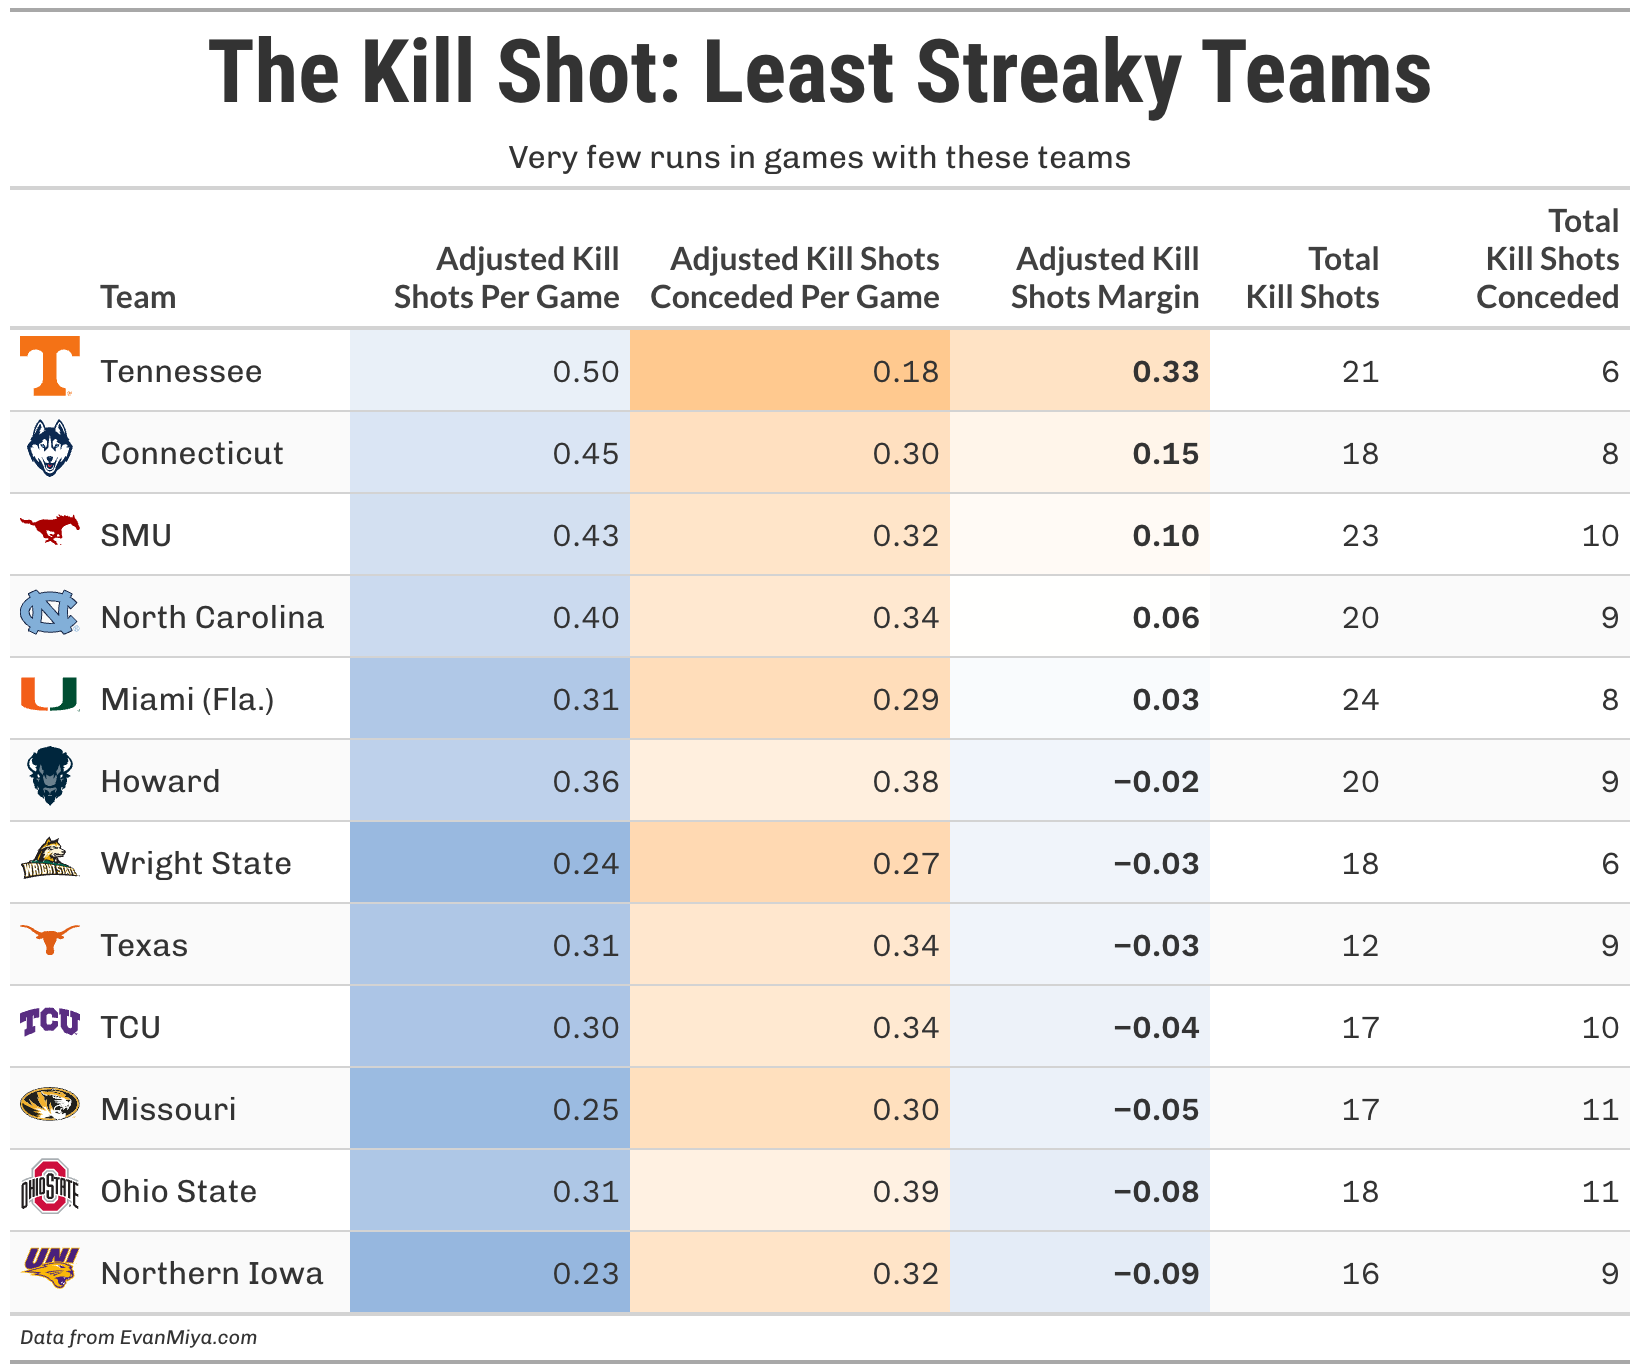
Teams in the “least streaky” category are pretty trustworthy when they have a lead, since they are not very likely to allow the opposition back into the game quickly. However, teams like SMU and Miami FL often struggle to overcome a deficit quickly. Look to rely more on these teams when they are favored, but be cautious about counting on them to win several games as underdogs.
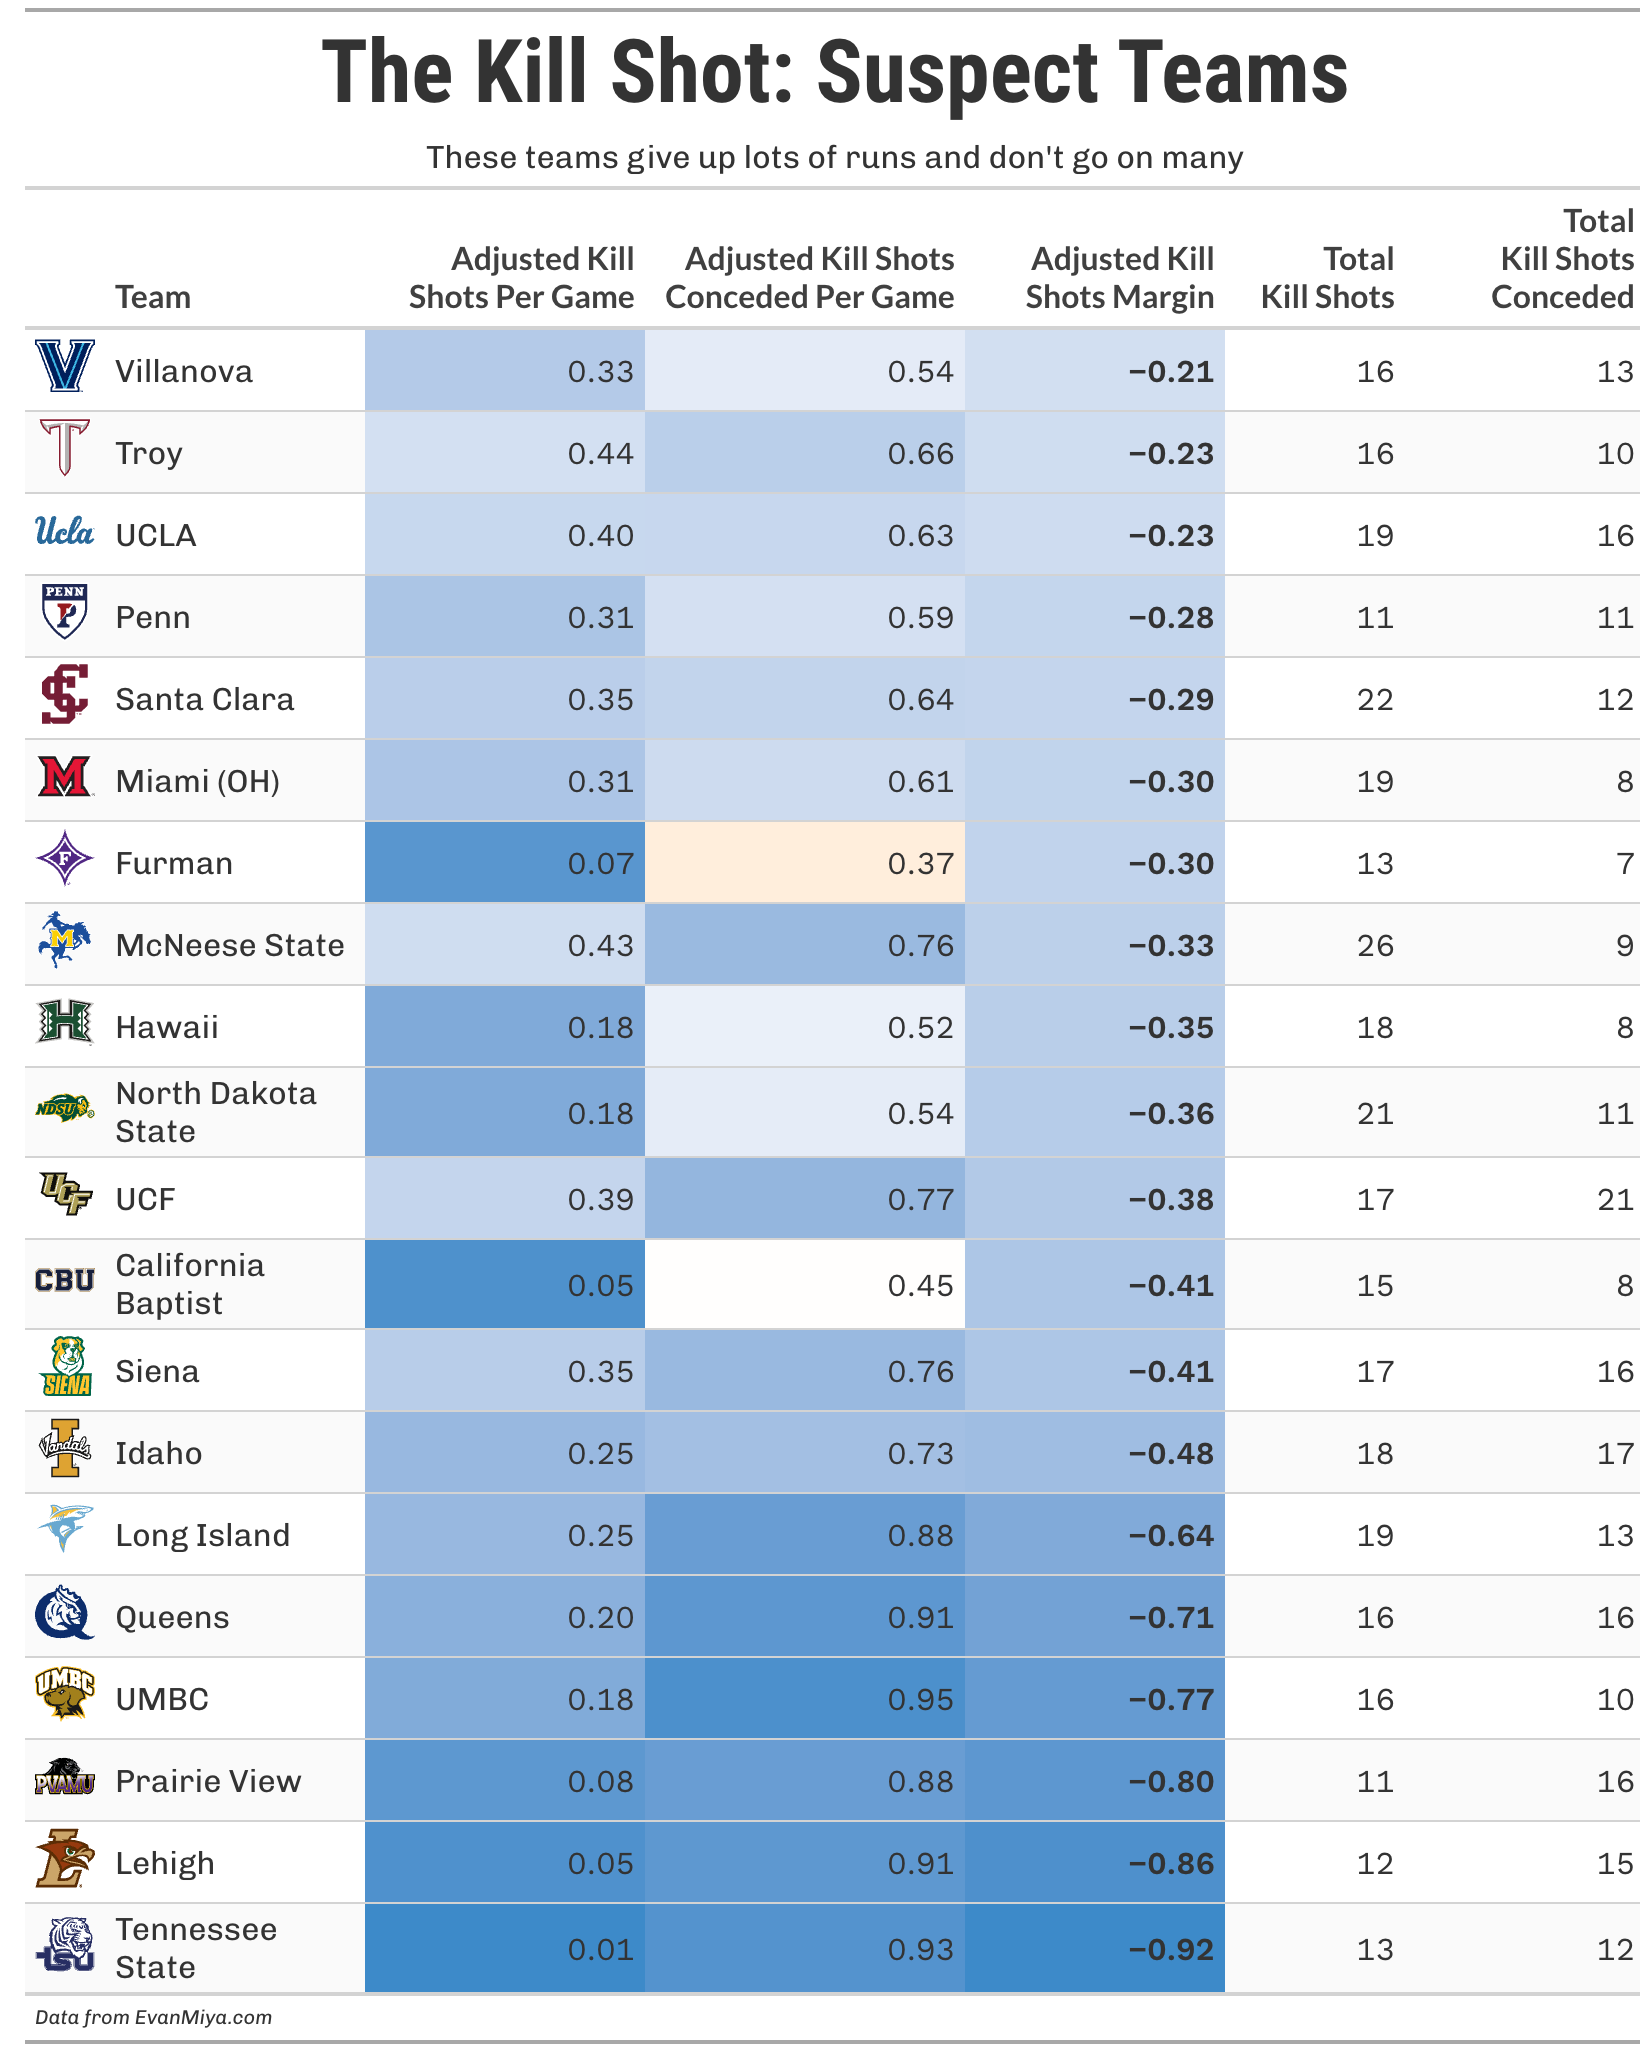
Lastly, we touch on the “suspect” group, which comprises teams prone to giving up scoring runs to the opposition while struggling to counter on their own. There are a lot of bad teams on this list, but it also notably includes Villanova and UCLA, who have given up a ton of 10-0 runs against high-major opponents.
Now, what does all of this mean for your team’s chances of reaching a Final Four?
Let me first state that while the Kill Shot is a helpful tool, it can’t be used in a vacuum to determine the best teams in the country. Instead, I view it as a useful companion to other metrics, providing more nuance on the characteristics of each team.
With that said, since the 2018-19 season (which is as far back as my Kill Shot database goes), heading into the tournament, every national champion has had an Adjusted Kill Shots Per Game of at least 0.47, an Adjusted Kill Shots Conceded Per Game under 0.34, and an Adjusted Kill Shots Margin of at least 0.28.
13 teams qualify using this year’s statistics: Michigan, Arizona, Illinois, Florida, Duke, Saint Mary’s, Nebraska, St. John’s, Michigan State, Arkansas, Virginia, Vanderbilt, and Tennessee.
In general, I have found that preventing 10-0 runs is the more predictive stat of teams that advance the furthest in the tournament. While it’s great to be able to put up scoring runs in a hurry, the best teams are the ones who can hold a lead and not quickly allow an opponent back in the game.
Opponent Strength Adjustment
This is a new graphic this year that looks at how much better teams play in elite competition compared to when they play weaker teams on their schedule. The Opponent Strength Adjustment metric, which you can find on the Team Ratings page at EvanMiya.com, measures how well each team performs above or below expectations based on whether they are playing a really good opponent or a really bad opponent. Some teams perform better than usual when they face really tough opponents, but struggle to dismantle weaker opponents. This concept is sometimes referred to as “playing up/down to competition”. Other teams are the opposite: they can easily crush inferior opponents but are disappointing against higher-quality teams on their schedule. Each team has a variable that measures where they are on this spectrum of playing up or down to their competition.
This graph compares each tournament team’s predictive team efficiency rating on the horizontal axis with their Opponent Strength Adjustment on the vertical Axis. Teams way above the middle line save their best performances for really good teams, but are more lackluster as comfortable favorites. Teams way below the middle line often beat up on inferior opponents, but have not consistently performed as well as expected against the elite teams on their schedule.
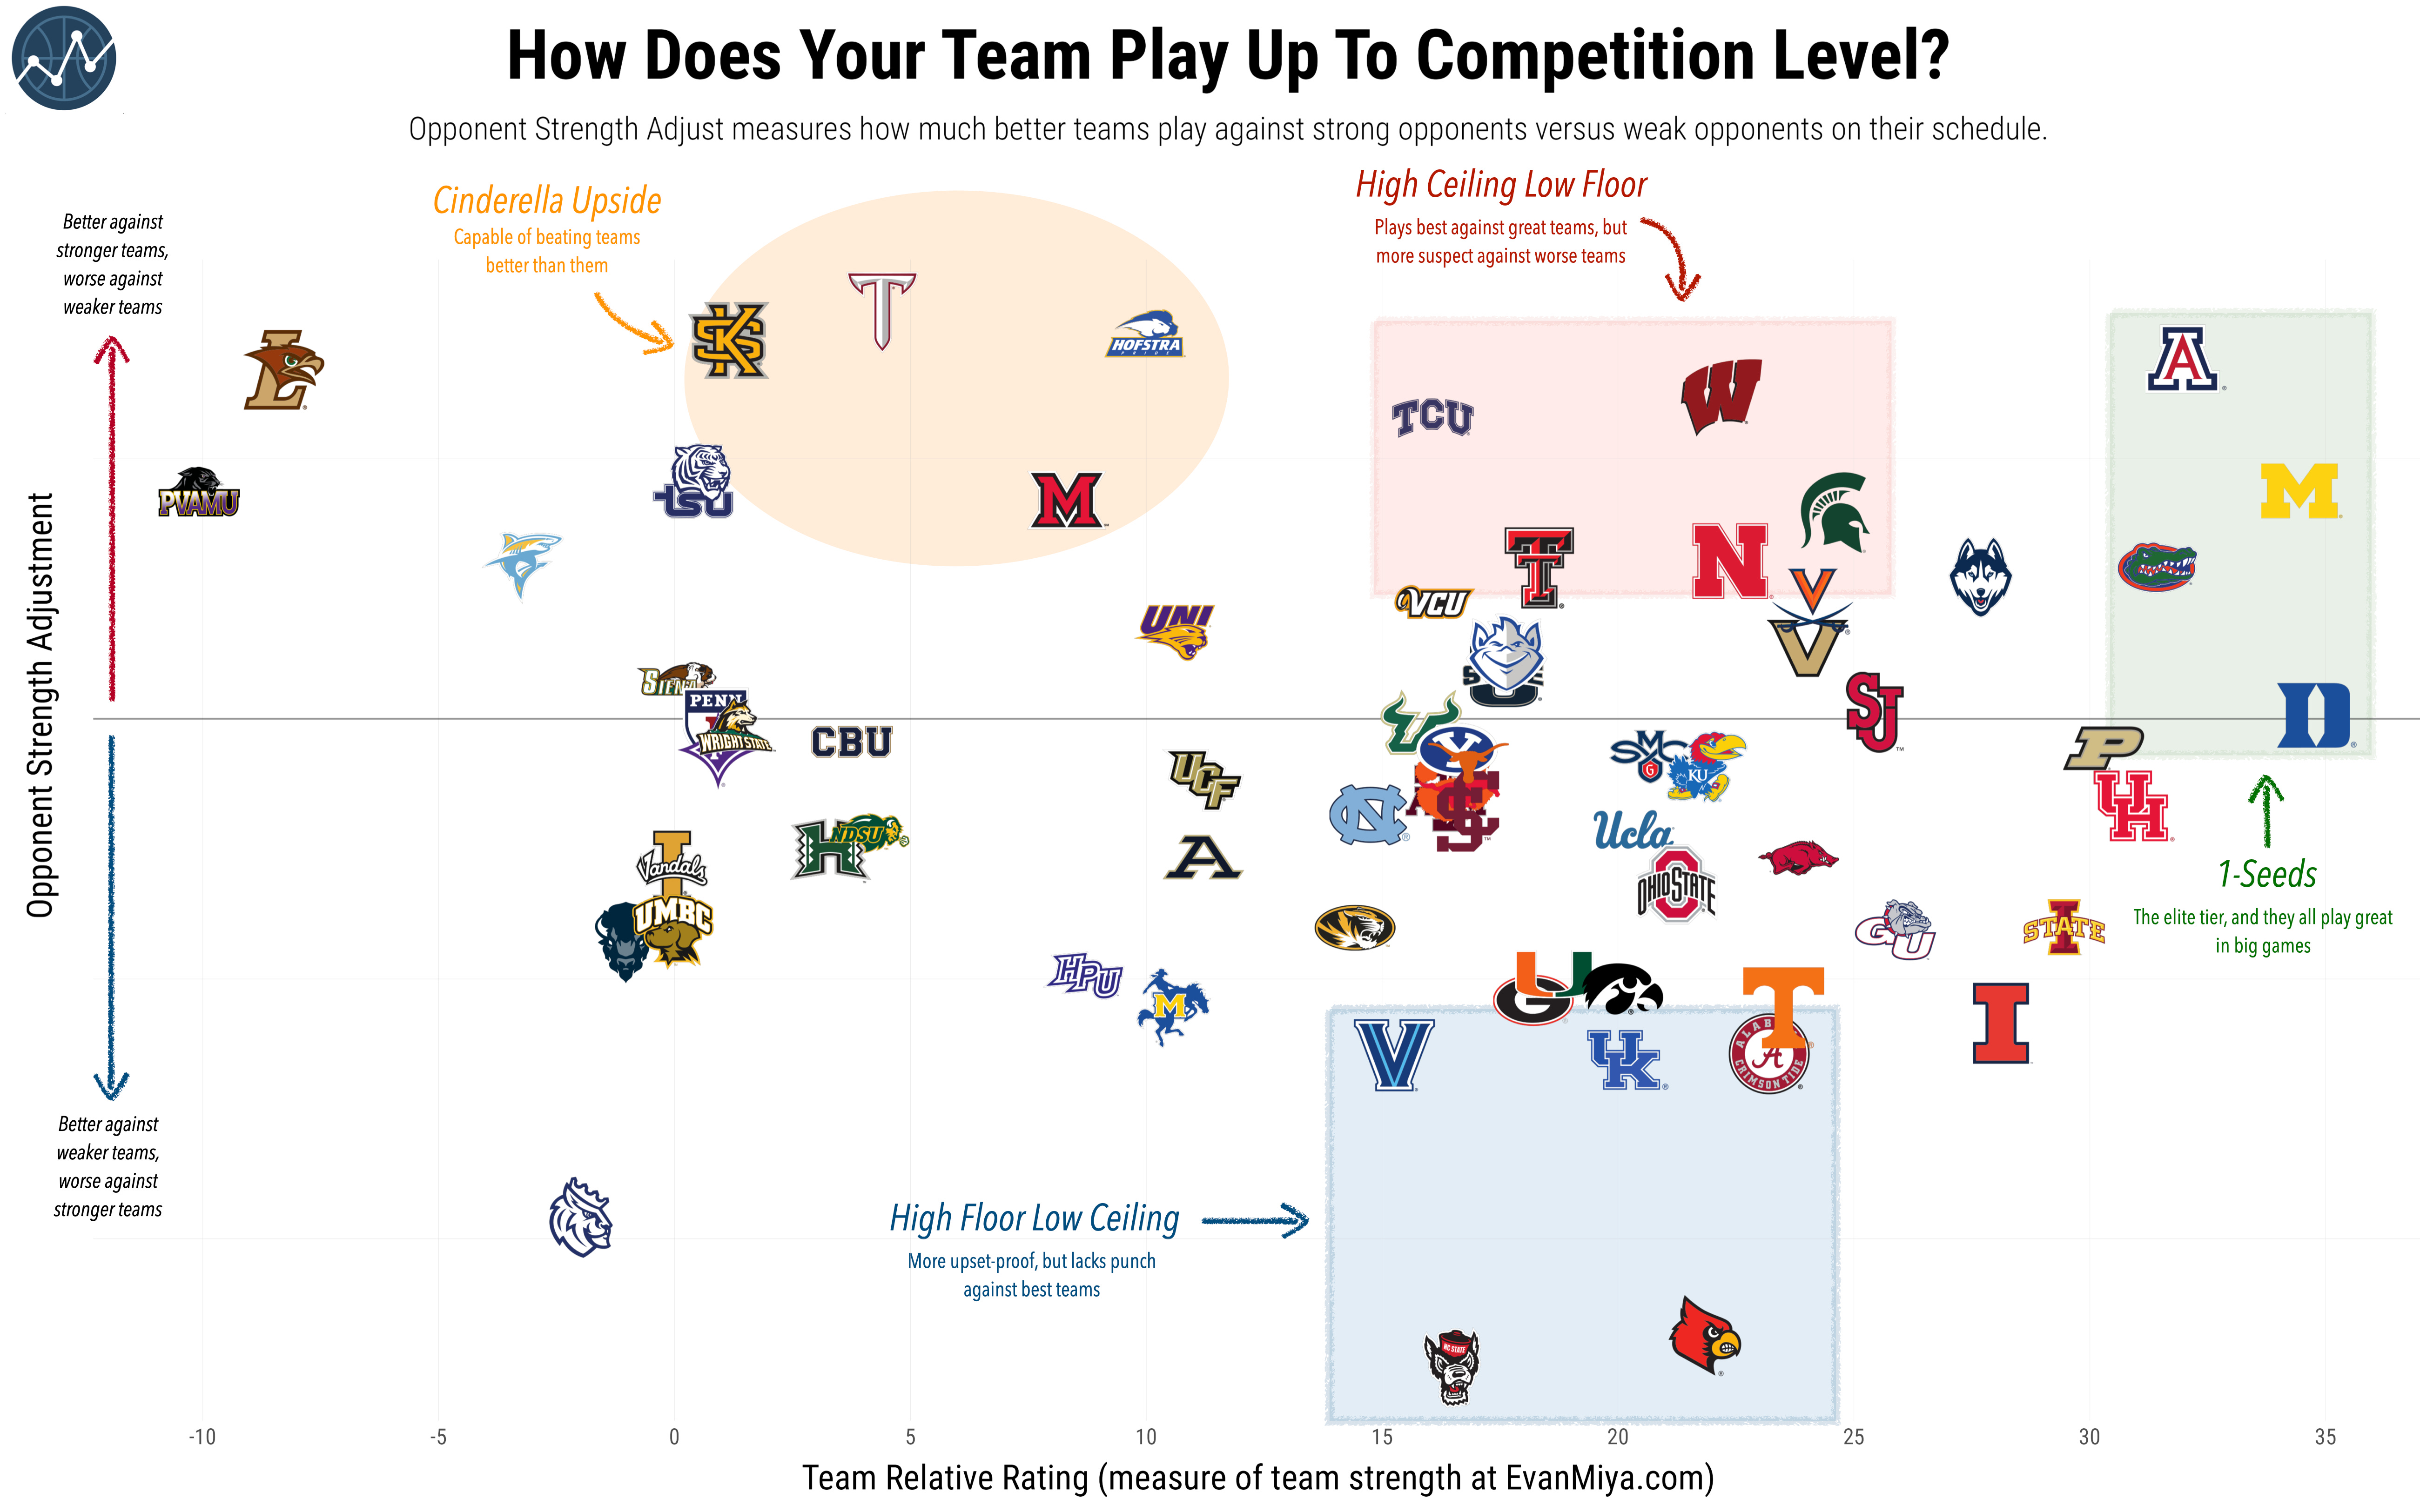
All of the 1-seeds are at or above the middle line, which means that they all play well in big-time matchups, which is a characteristic consistent with most of the title-winners in recent years going into the tournament.
There’s a group of dangerous teams in the “High Ceiling Low Floor” group: Wisconsin, Michigan State, Nebraska, Texas Tech, and TCU. These teams have all been pretty awesome in big-time games but have often struggled against the weaker teams on their schedules. They are potentially more upset-prone in the first round or two, but if they can make it past those games, they could cause real problems as an underdog against an elite team.
Several Cinderella candidates have played really well against the best teams on their schedule: Hofstra, Miami OH, Troy, and Kennesaw State.
On the flip side, there are five teams in the “High Floor Low Ceiling” group: Alabama, Kentucky, Louisville, NC State, and Villanova. These teams, Louisville and NC State in particular, have really struggled to put up convincing performances against great teams. They are probably more upset-proof than other teams on their seed line, but haven’t shown the capability of proving themselves against the top-tier teams in the sport.
Consistent or Volatile
Last big chart, but one, I find very interesting as well: tracking game-to-game consistency in teams. The “Game-to-Game Volatility” metric measures how much a team’s performance level fluctuates between games. Teams higher on this metric are more volatile, while teams in the lower area of the graph are more consistent in their performance.
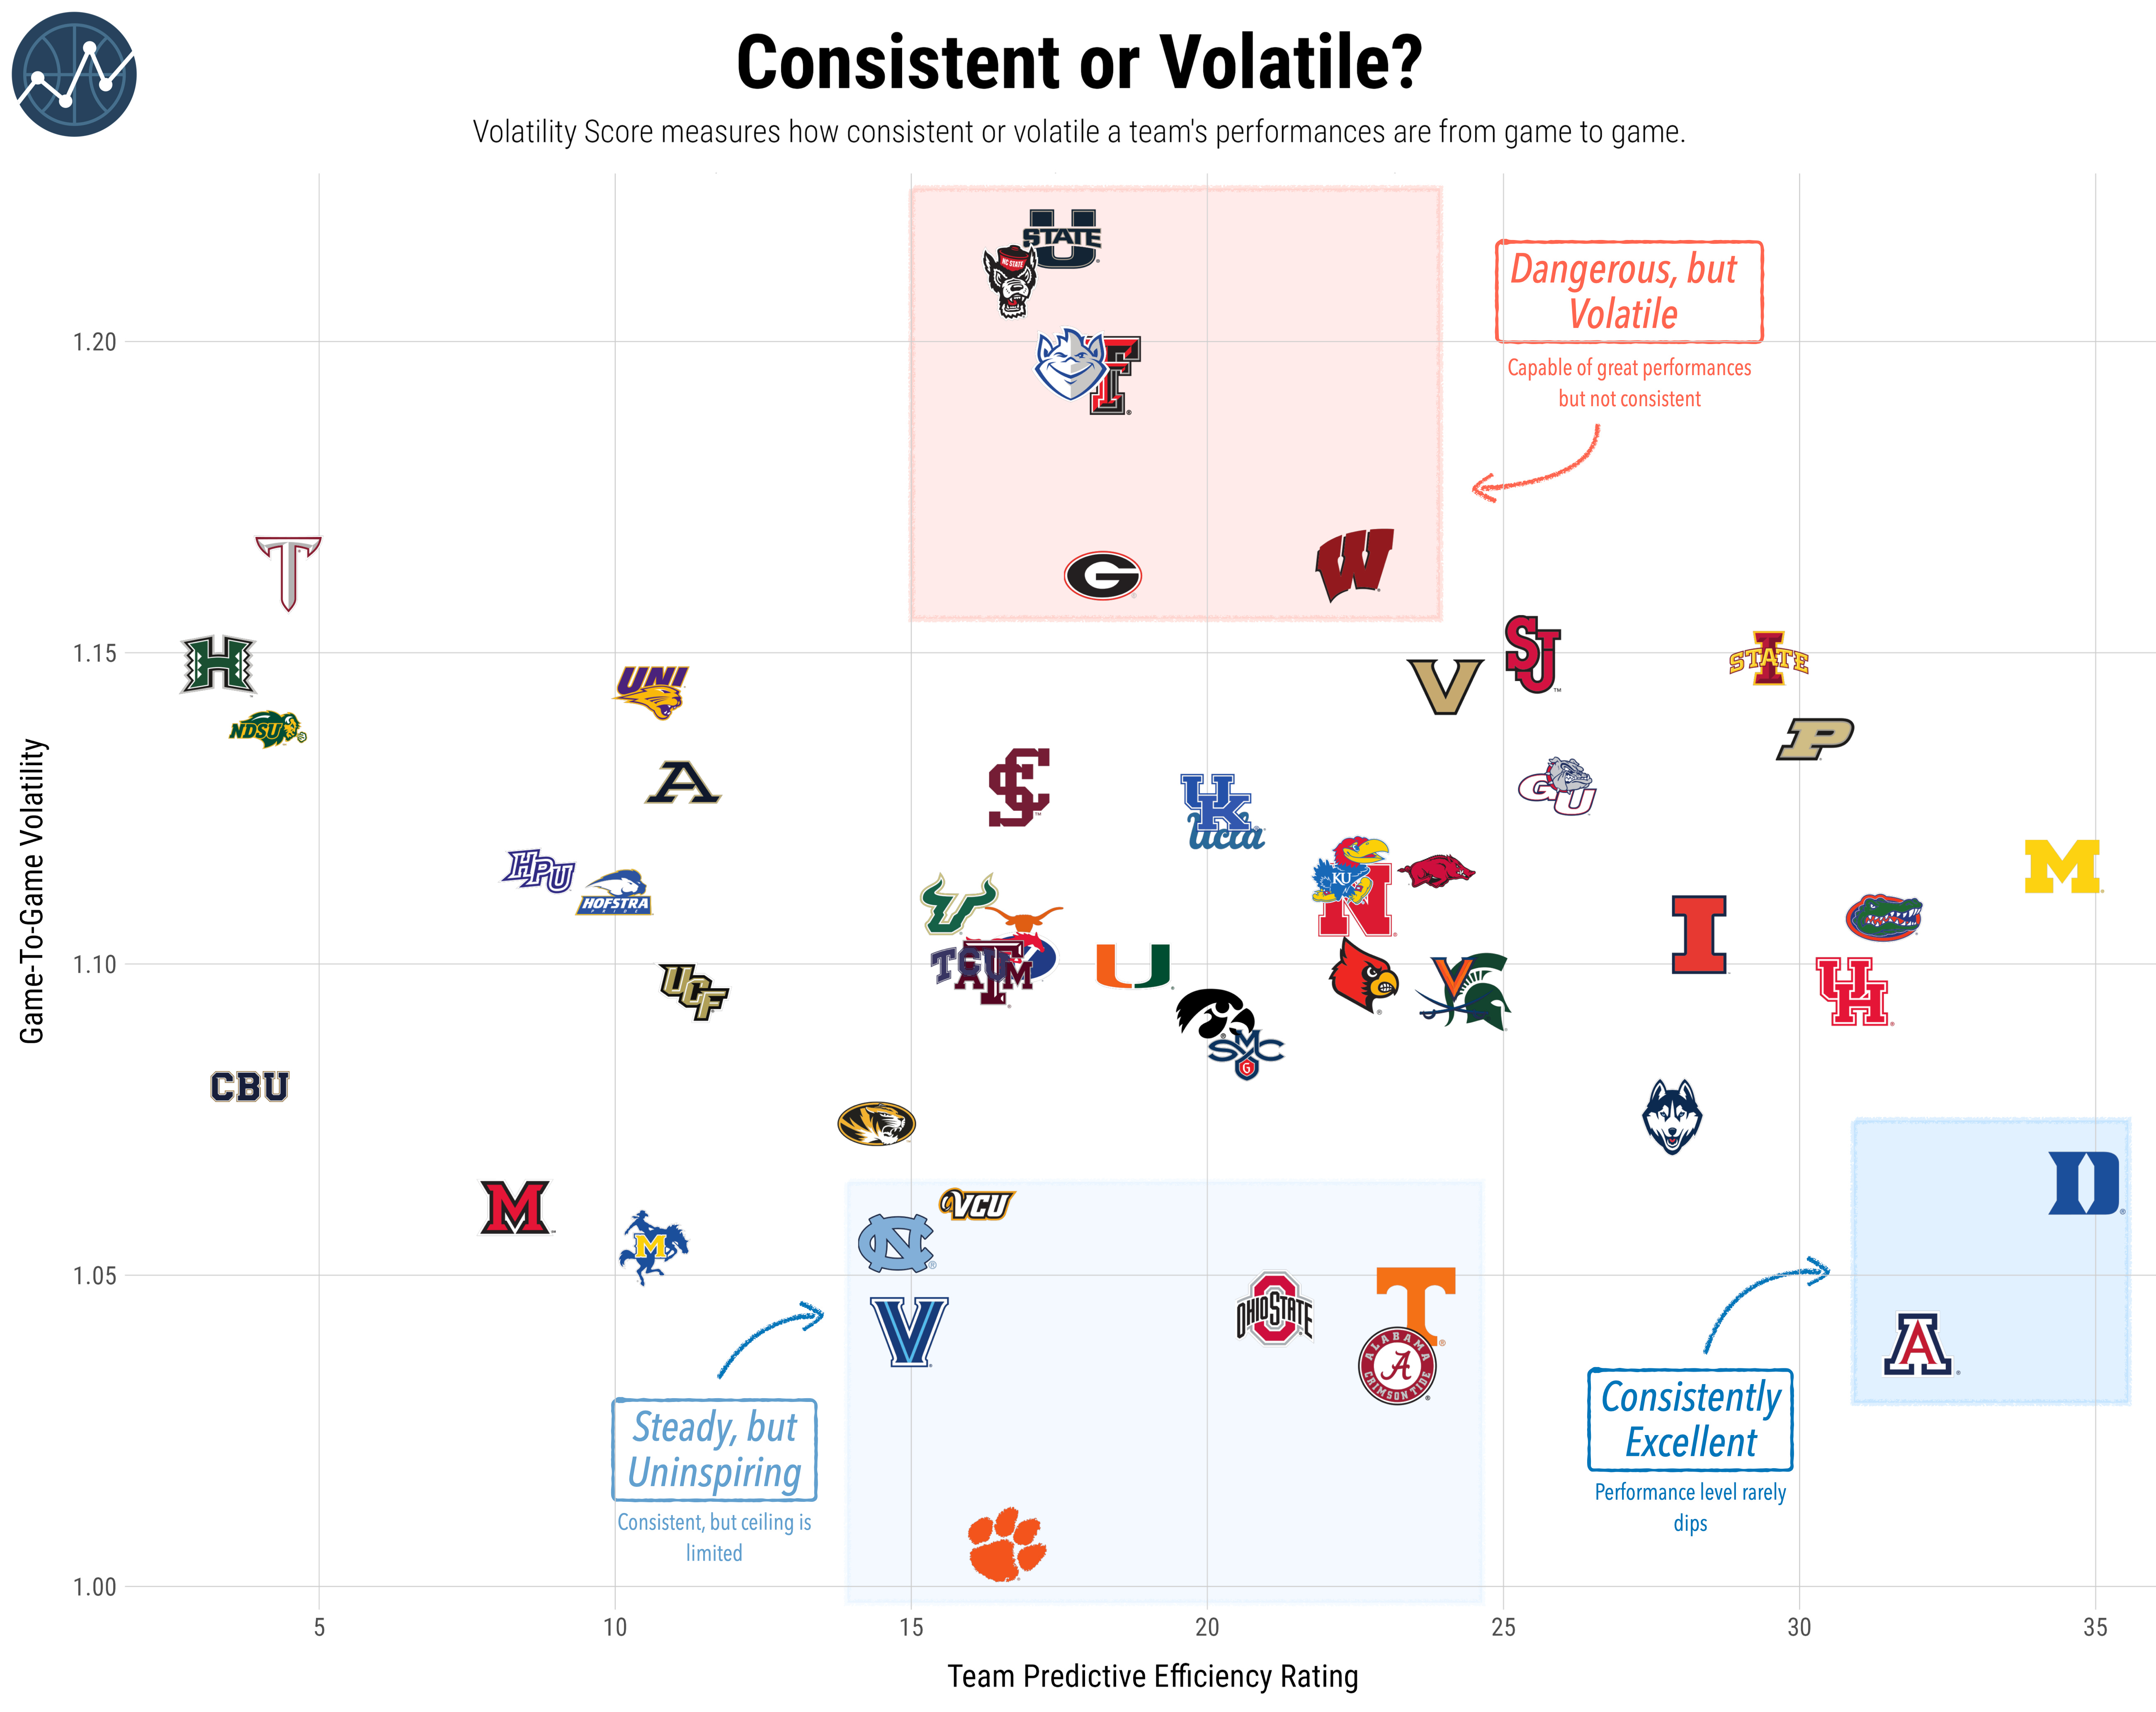
Arizona and Duke are among the more consistent teams in the nation, which is probably a good thing for their title hopes, given they are way more talented than pretty much everyone else.
The most volatile teams in this tournament are Utah State, NC State, Saint Louis, Texas Tech, Georgia, and Wisconsin. They all have pretty big swings between their best performances and their worst. As an underdog, this is probably a good thing as it gives them a better chance of causing an upset if they are at their best. However, it does make them less reliable over multiple games to sustain a high performance level.
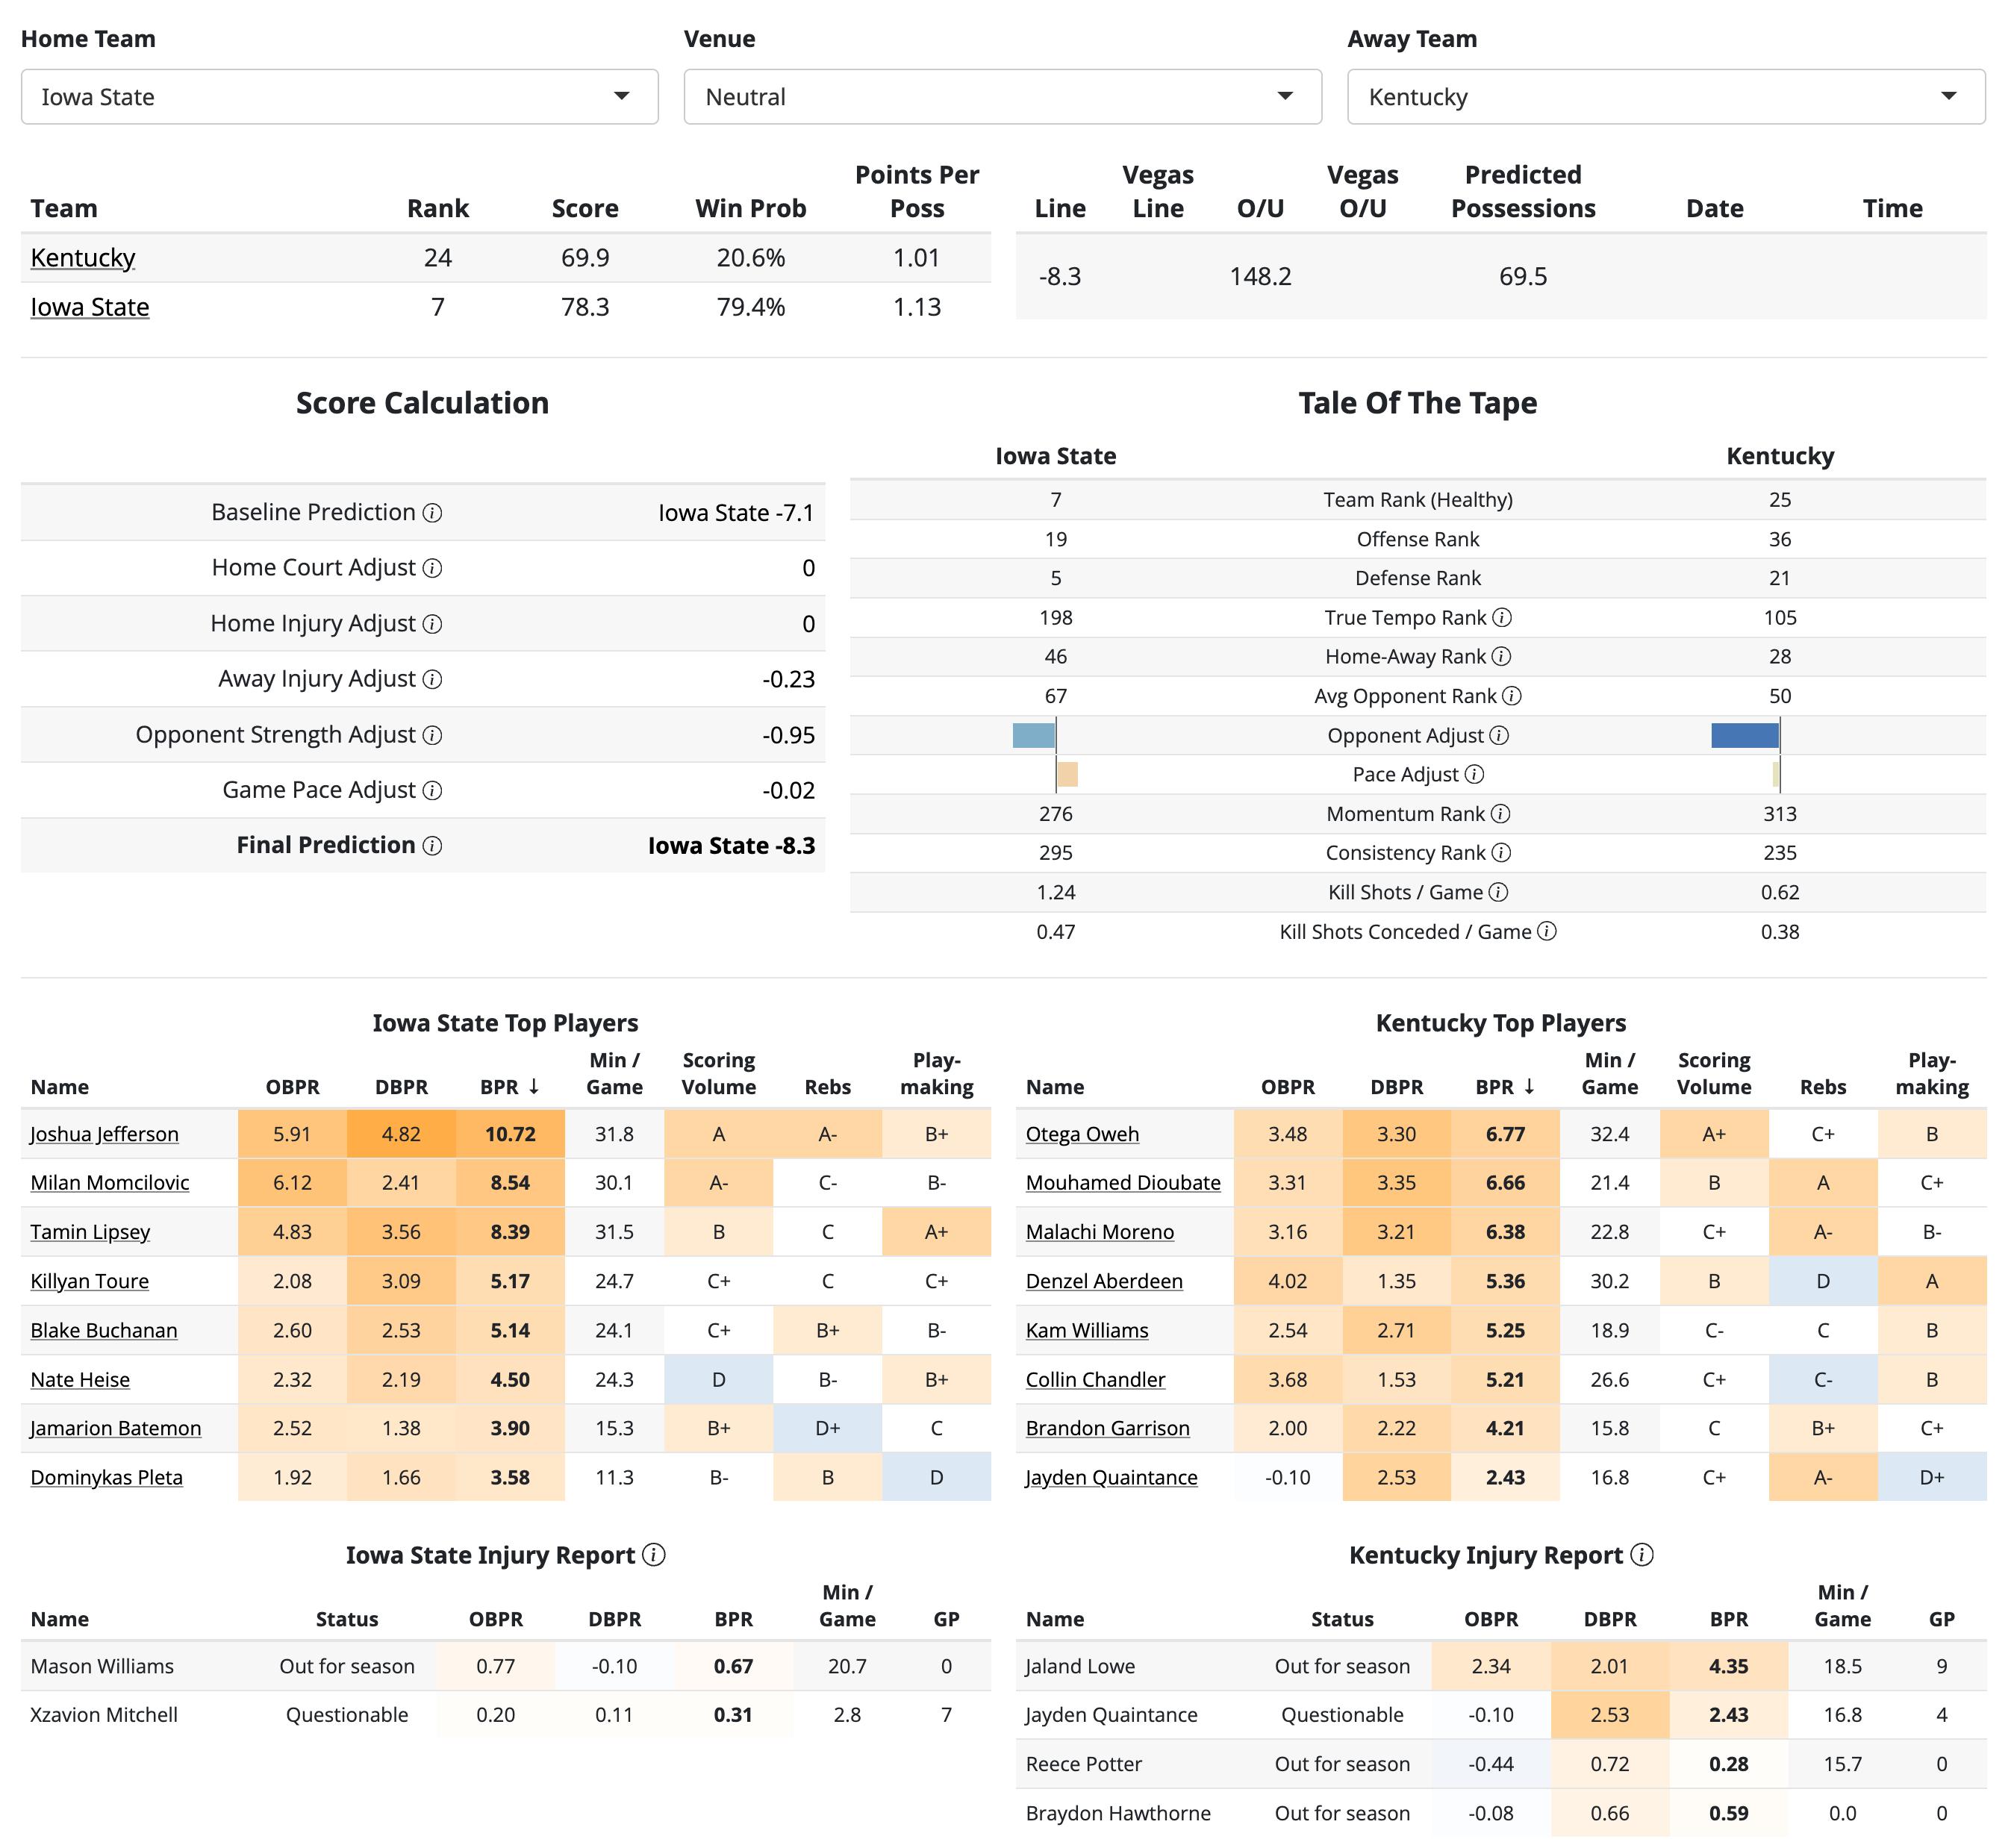
Matchup Previews
To dig more into the individual matchups, the Matchup Preview Tool at EvanMiya.com lets you analyze any hypothetical matchup in the tournament. It gives you score predictions, injury adjustments, other matchup-specific adjustments, a team comparison, a roster breakdown, and a daily updated injury report.
This preview shows the potential top-10 matchup in the 2nd round between Iowa State and Kentucky:
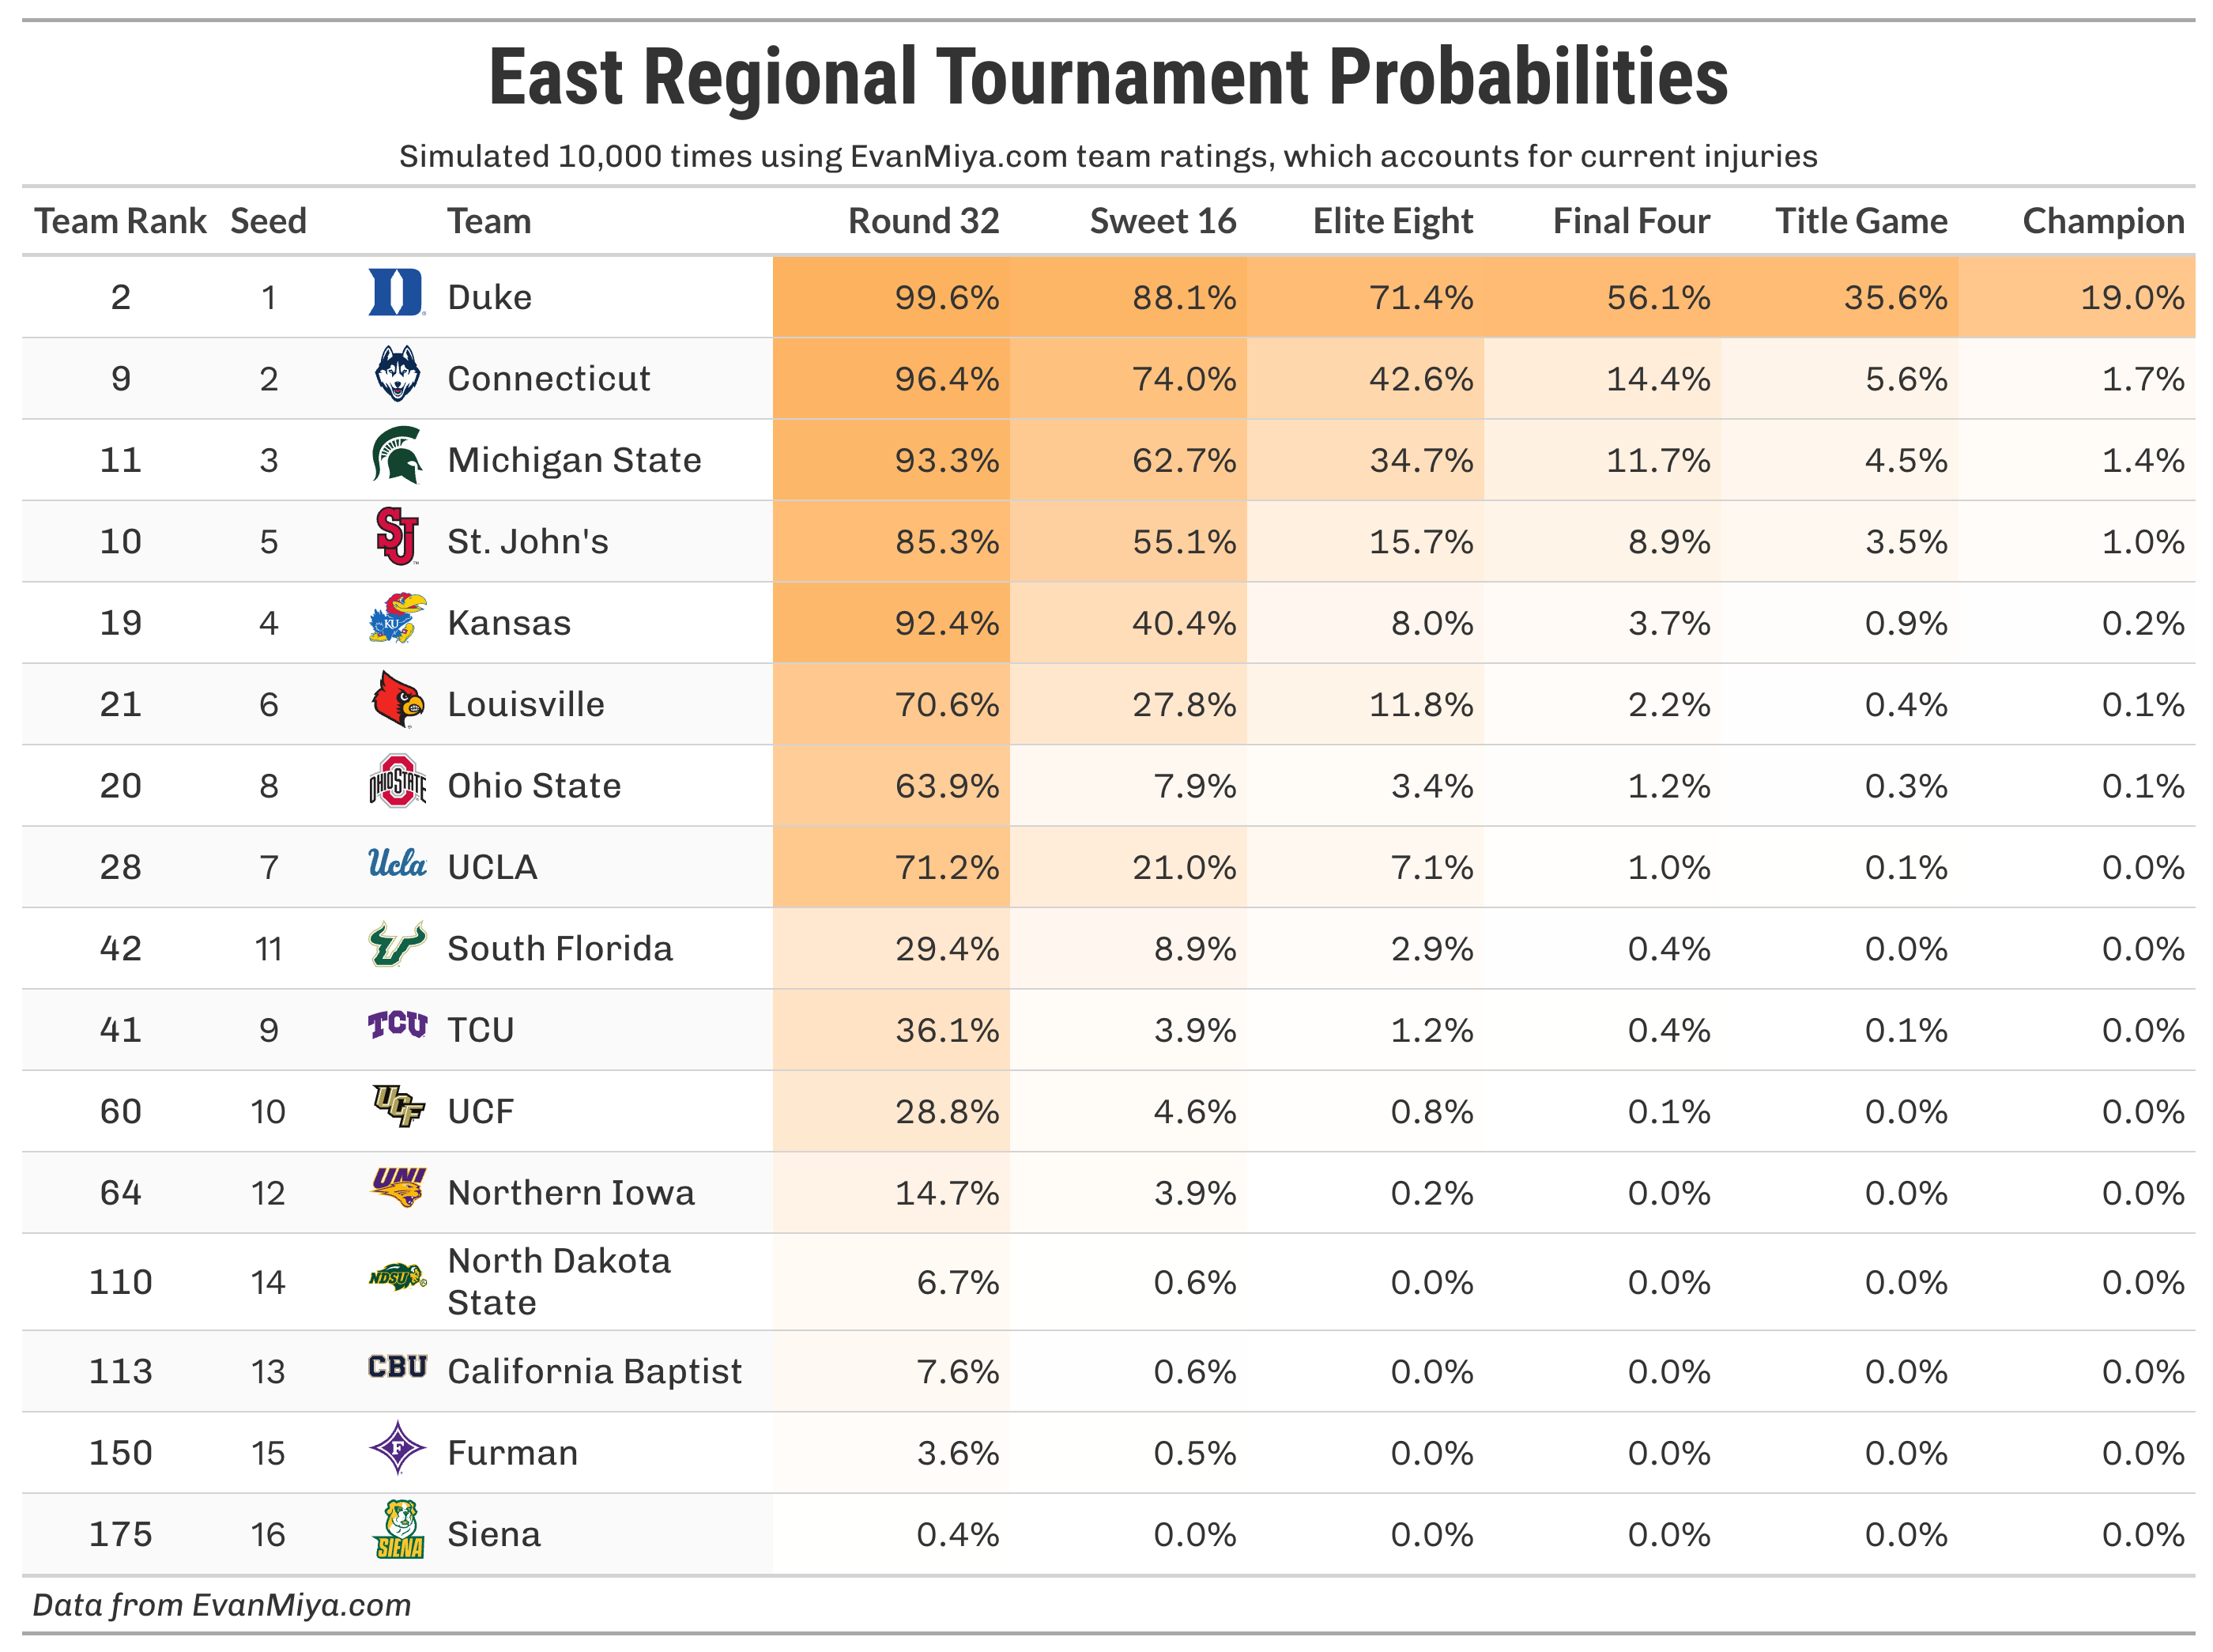
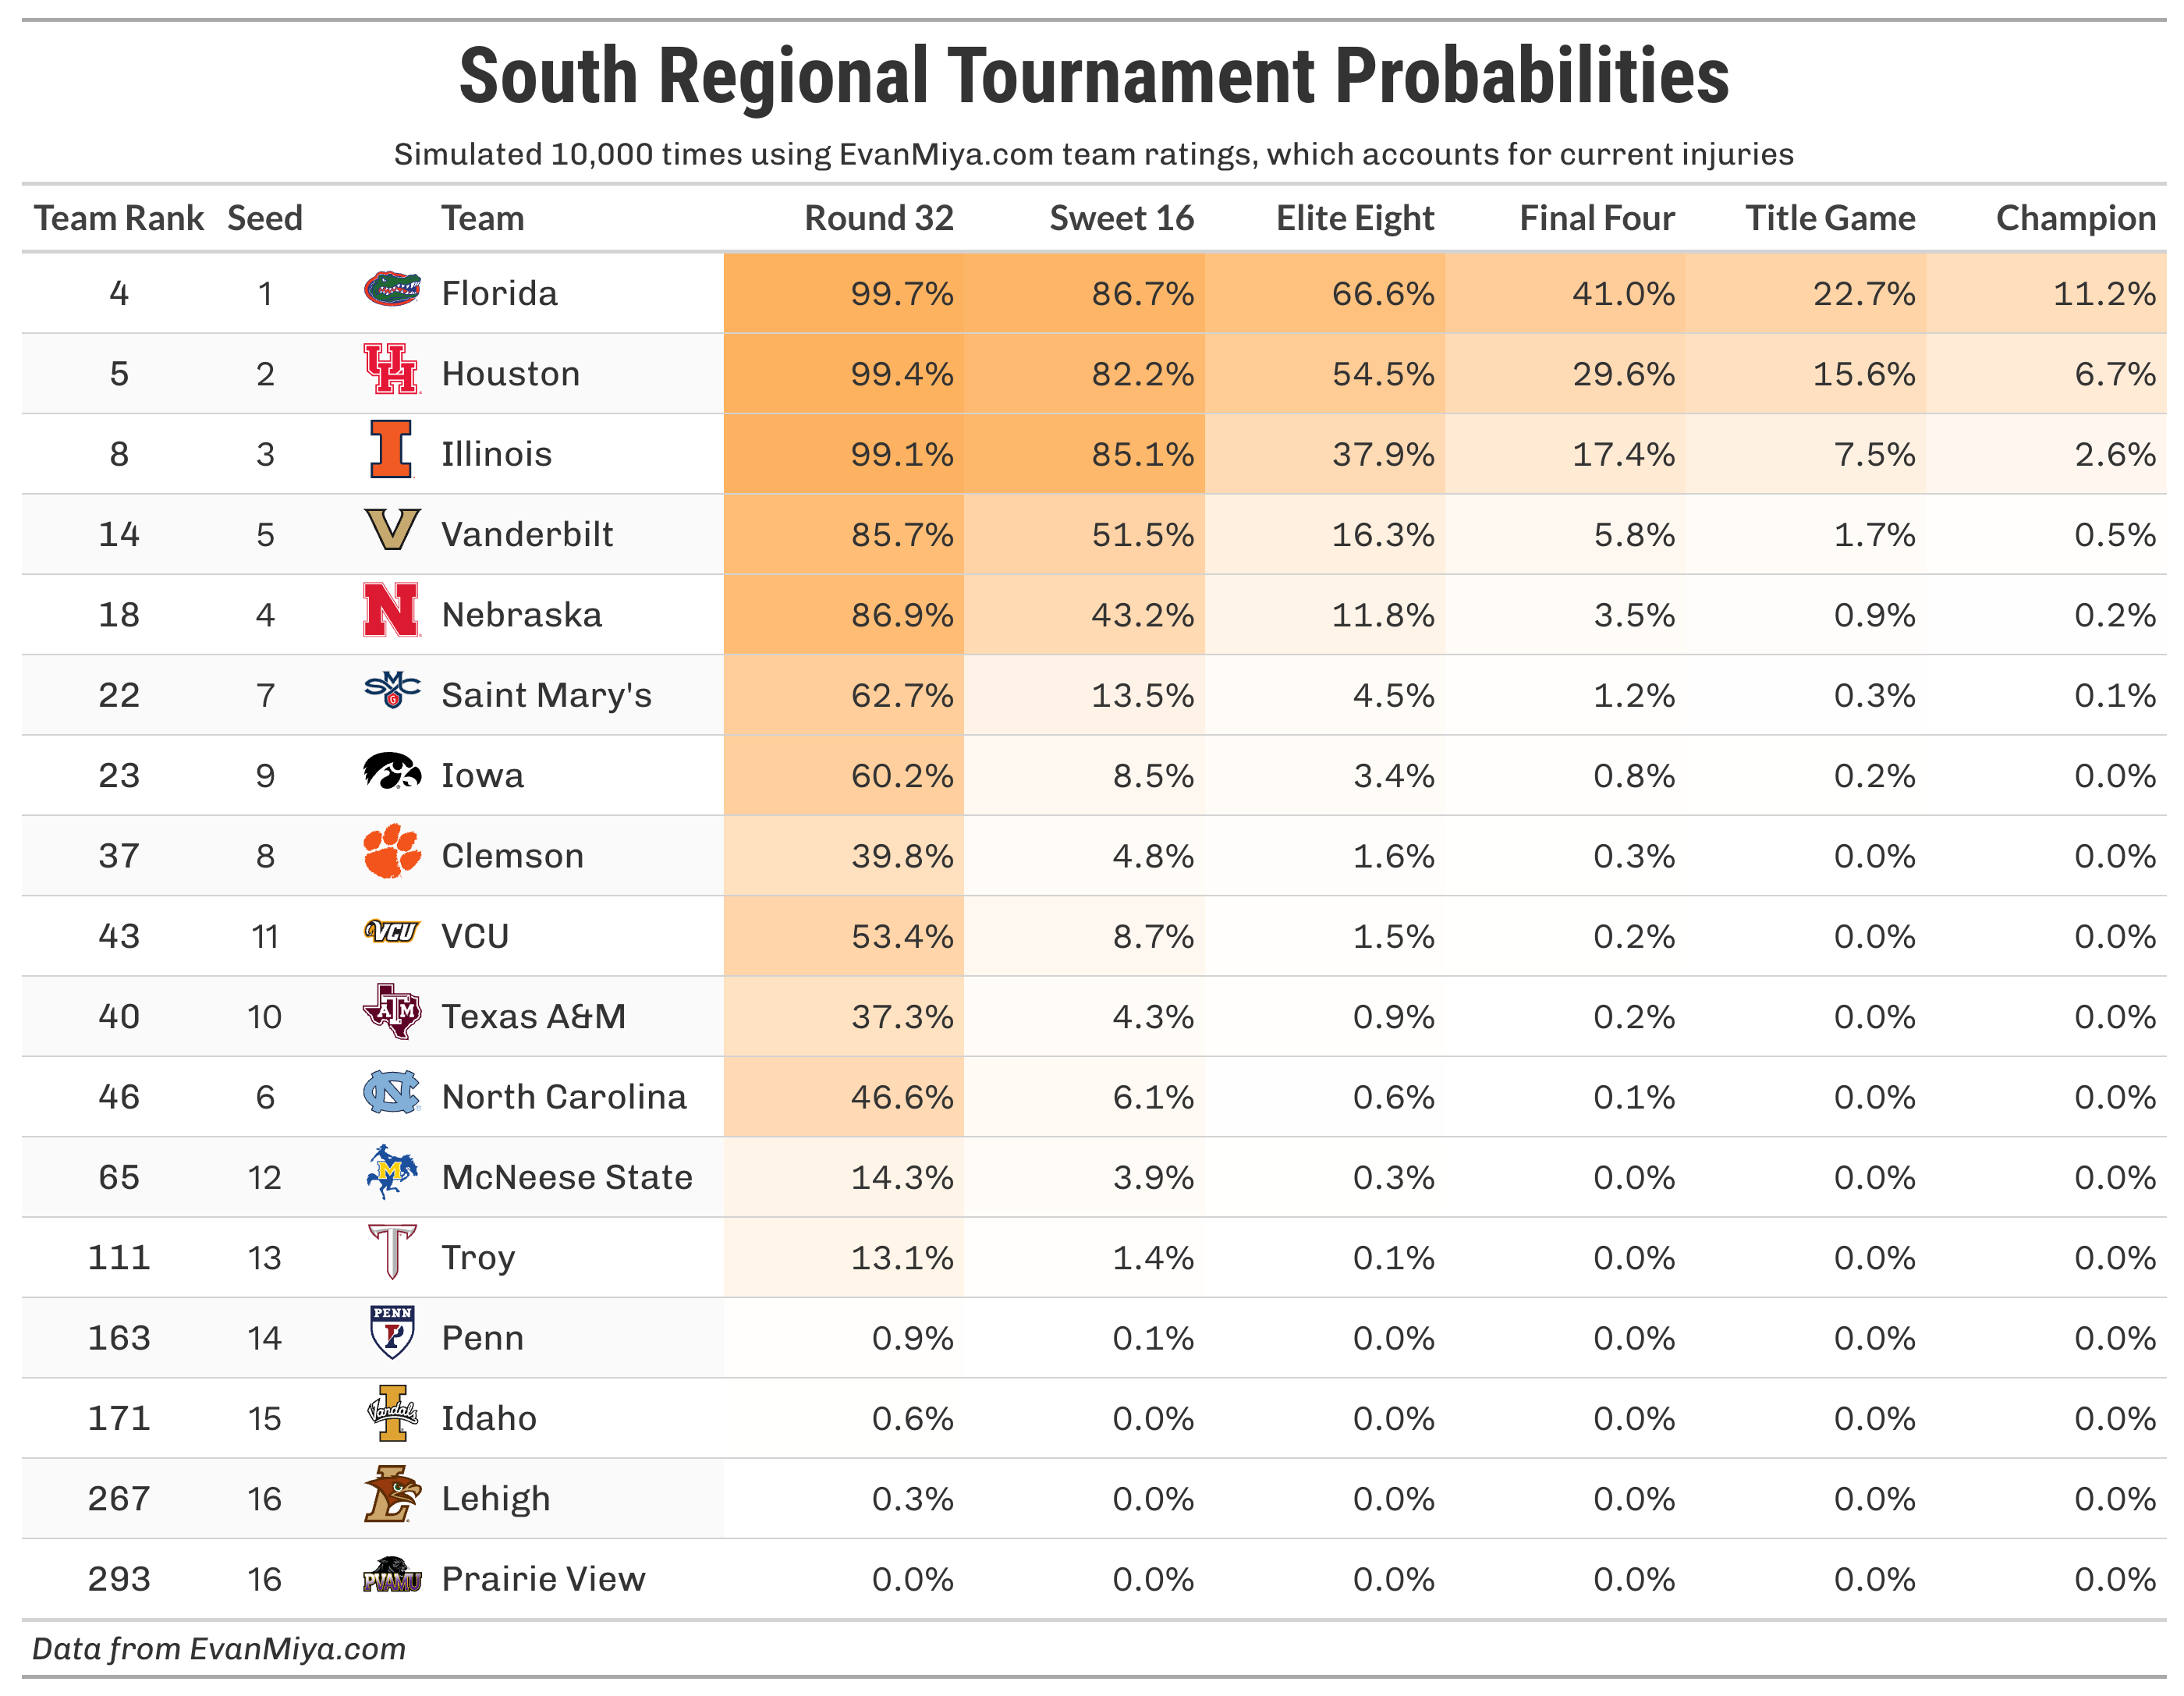
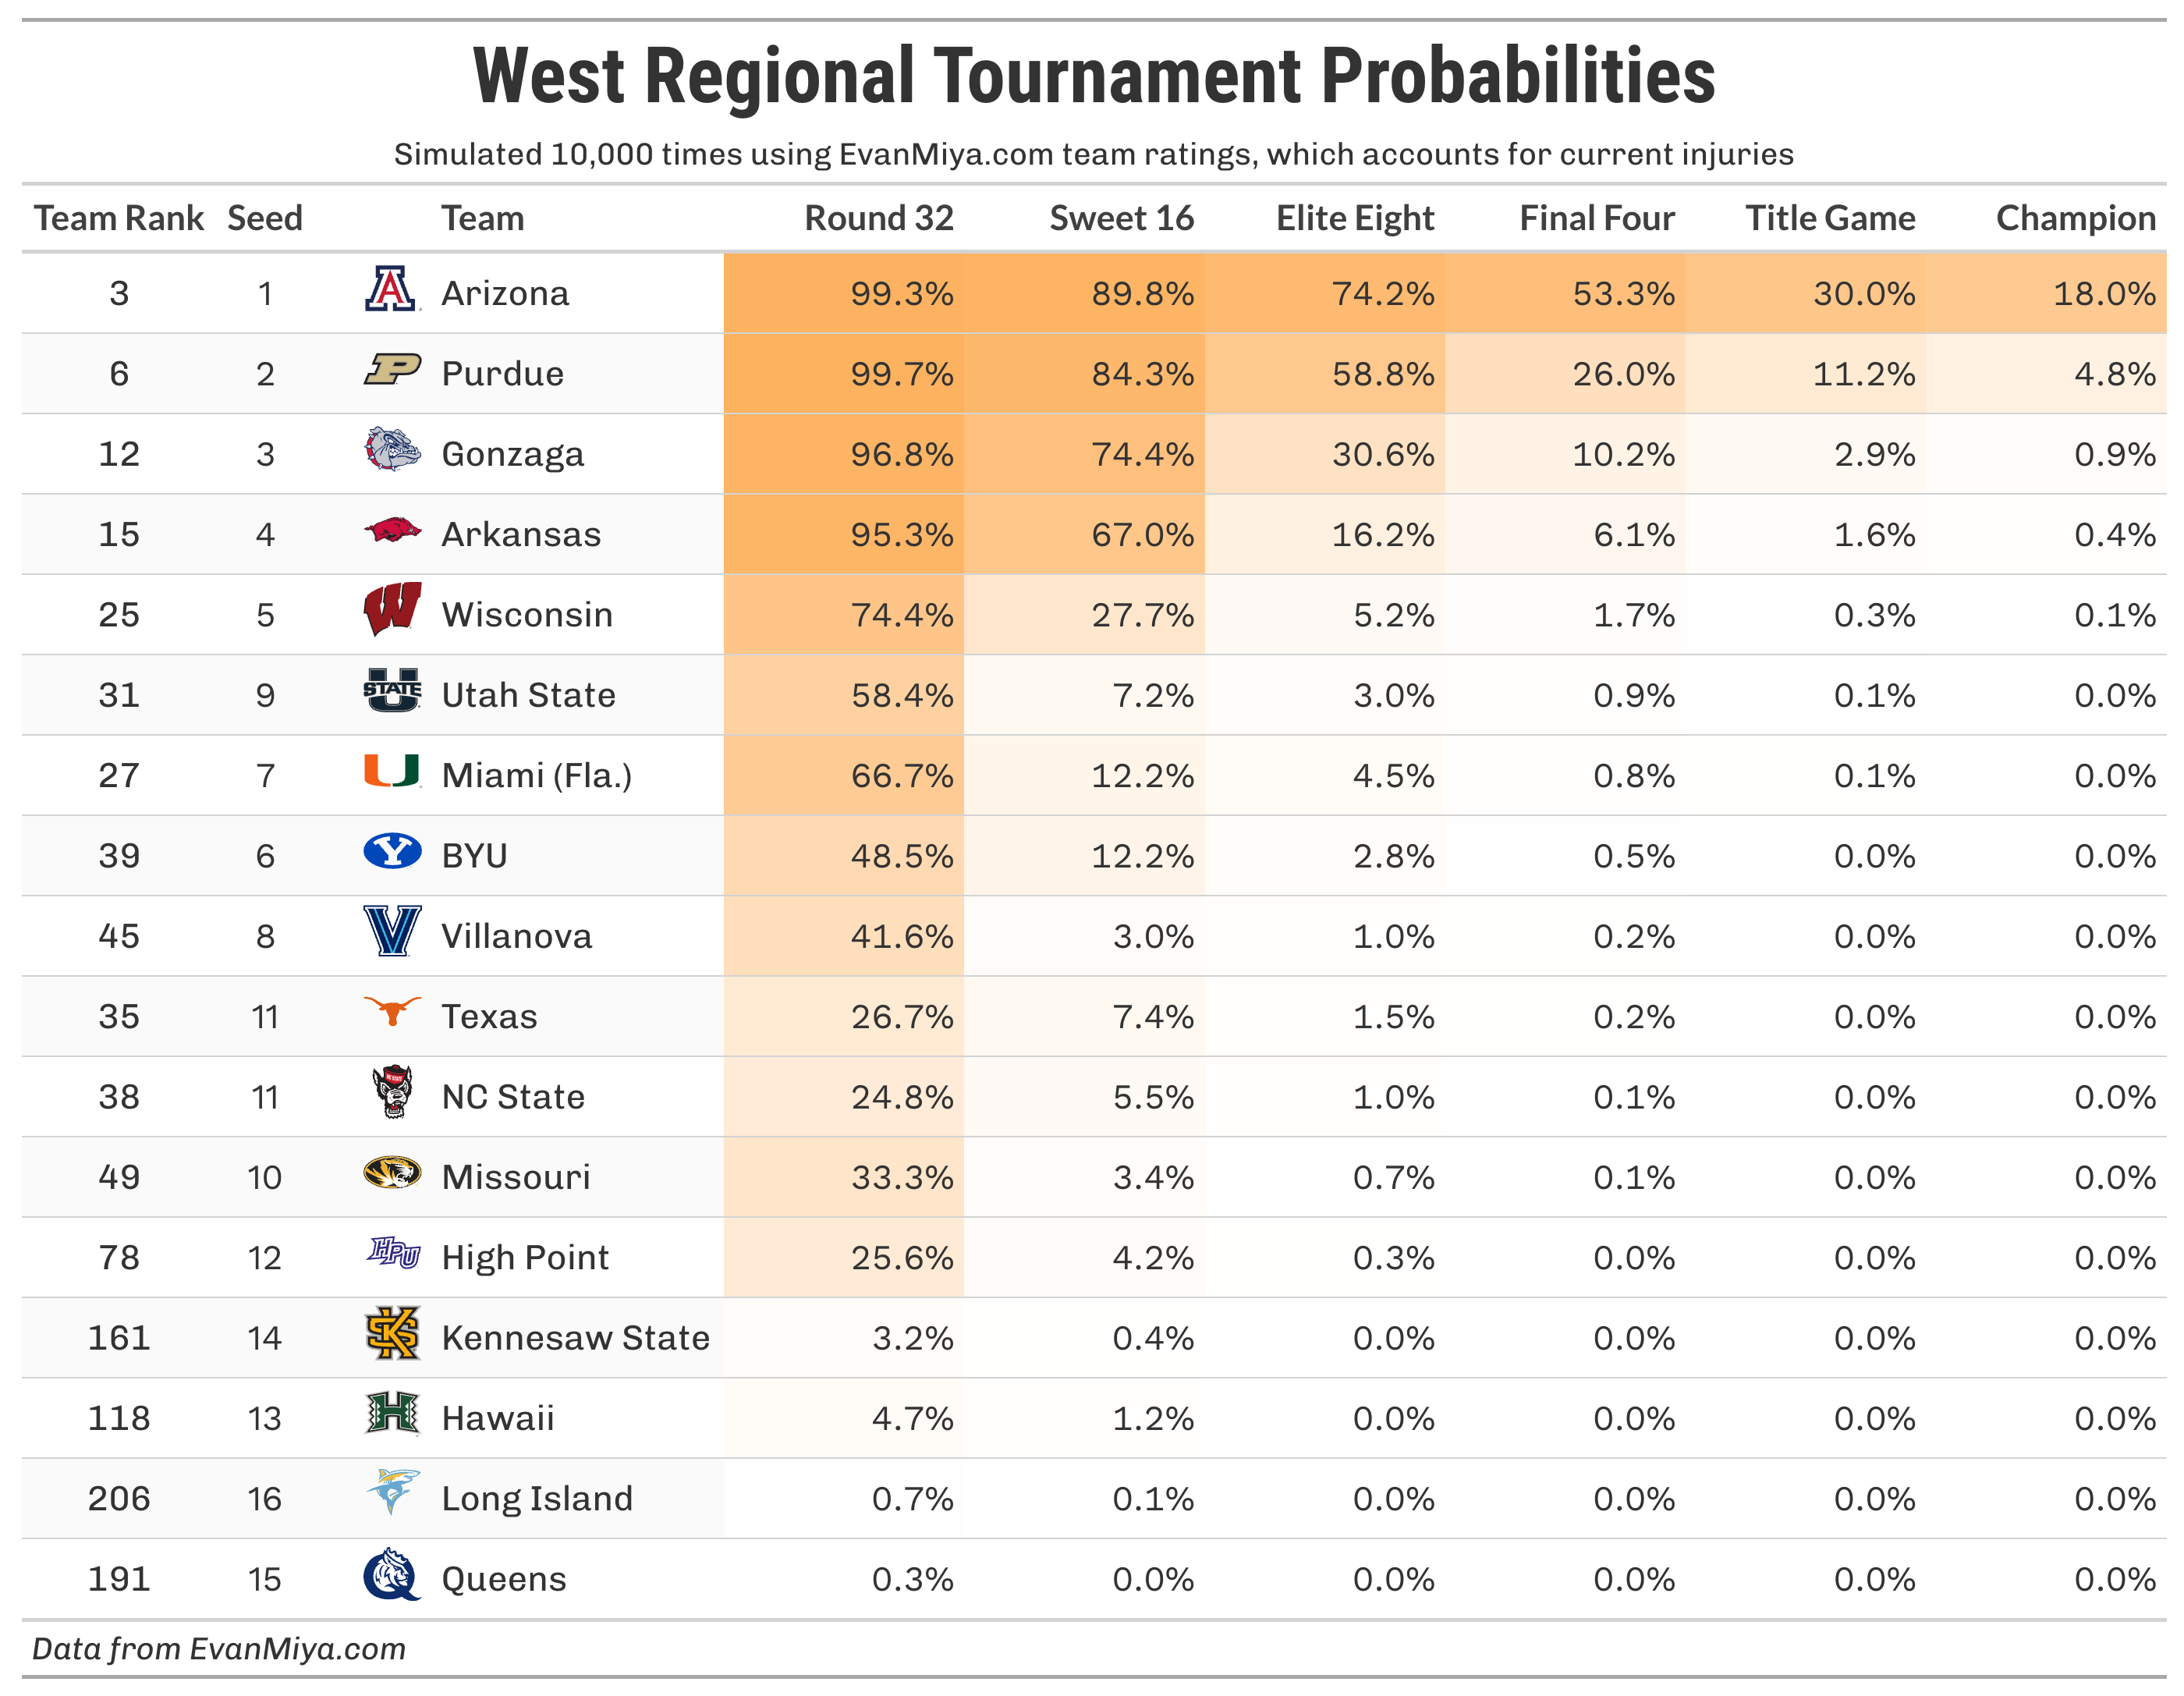
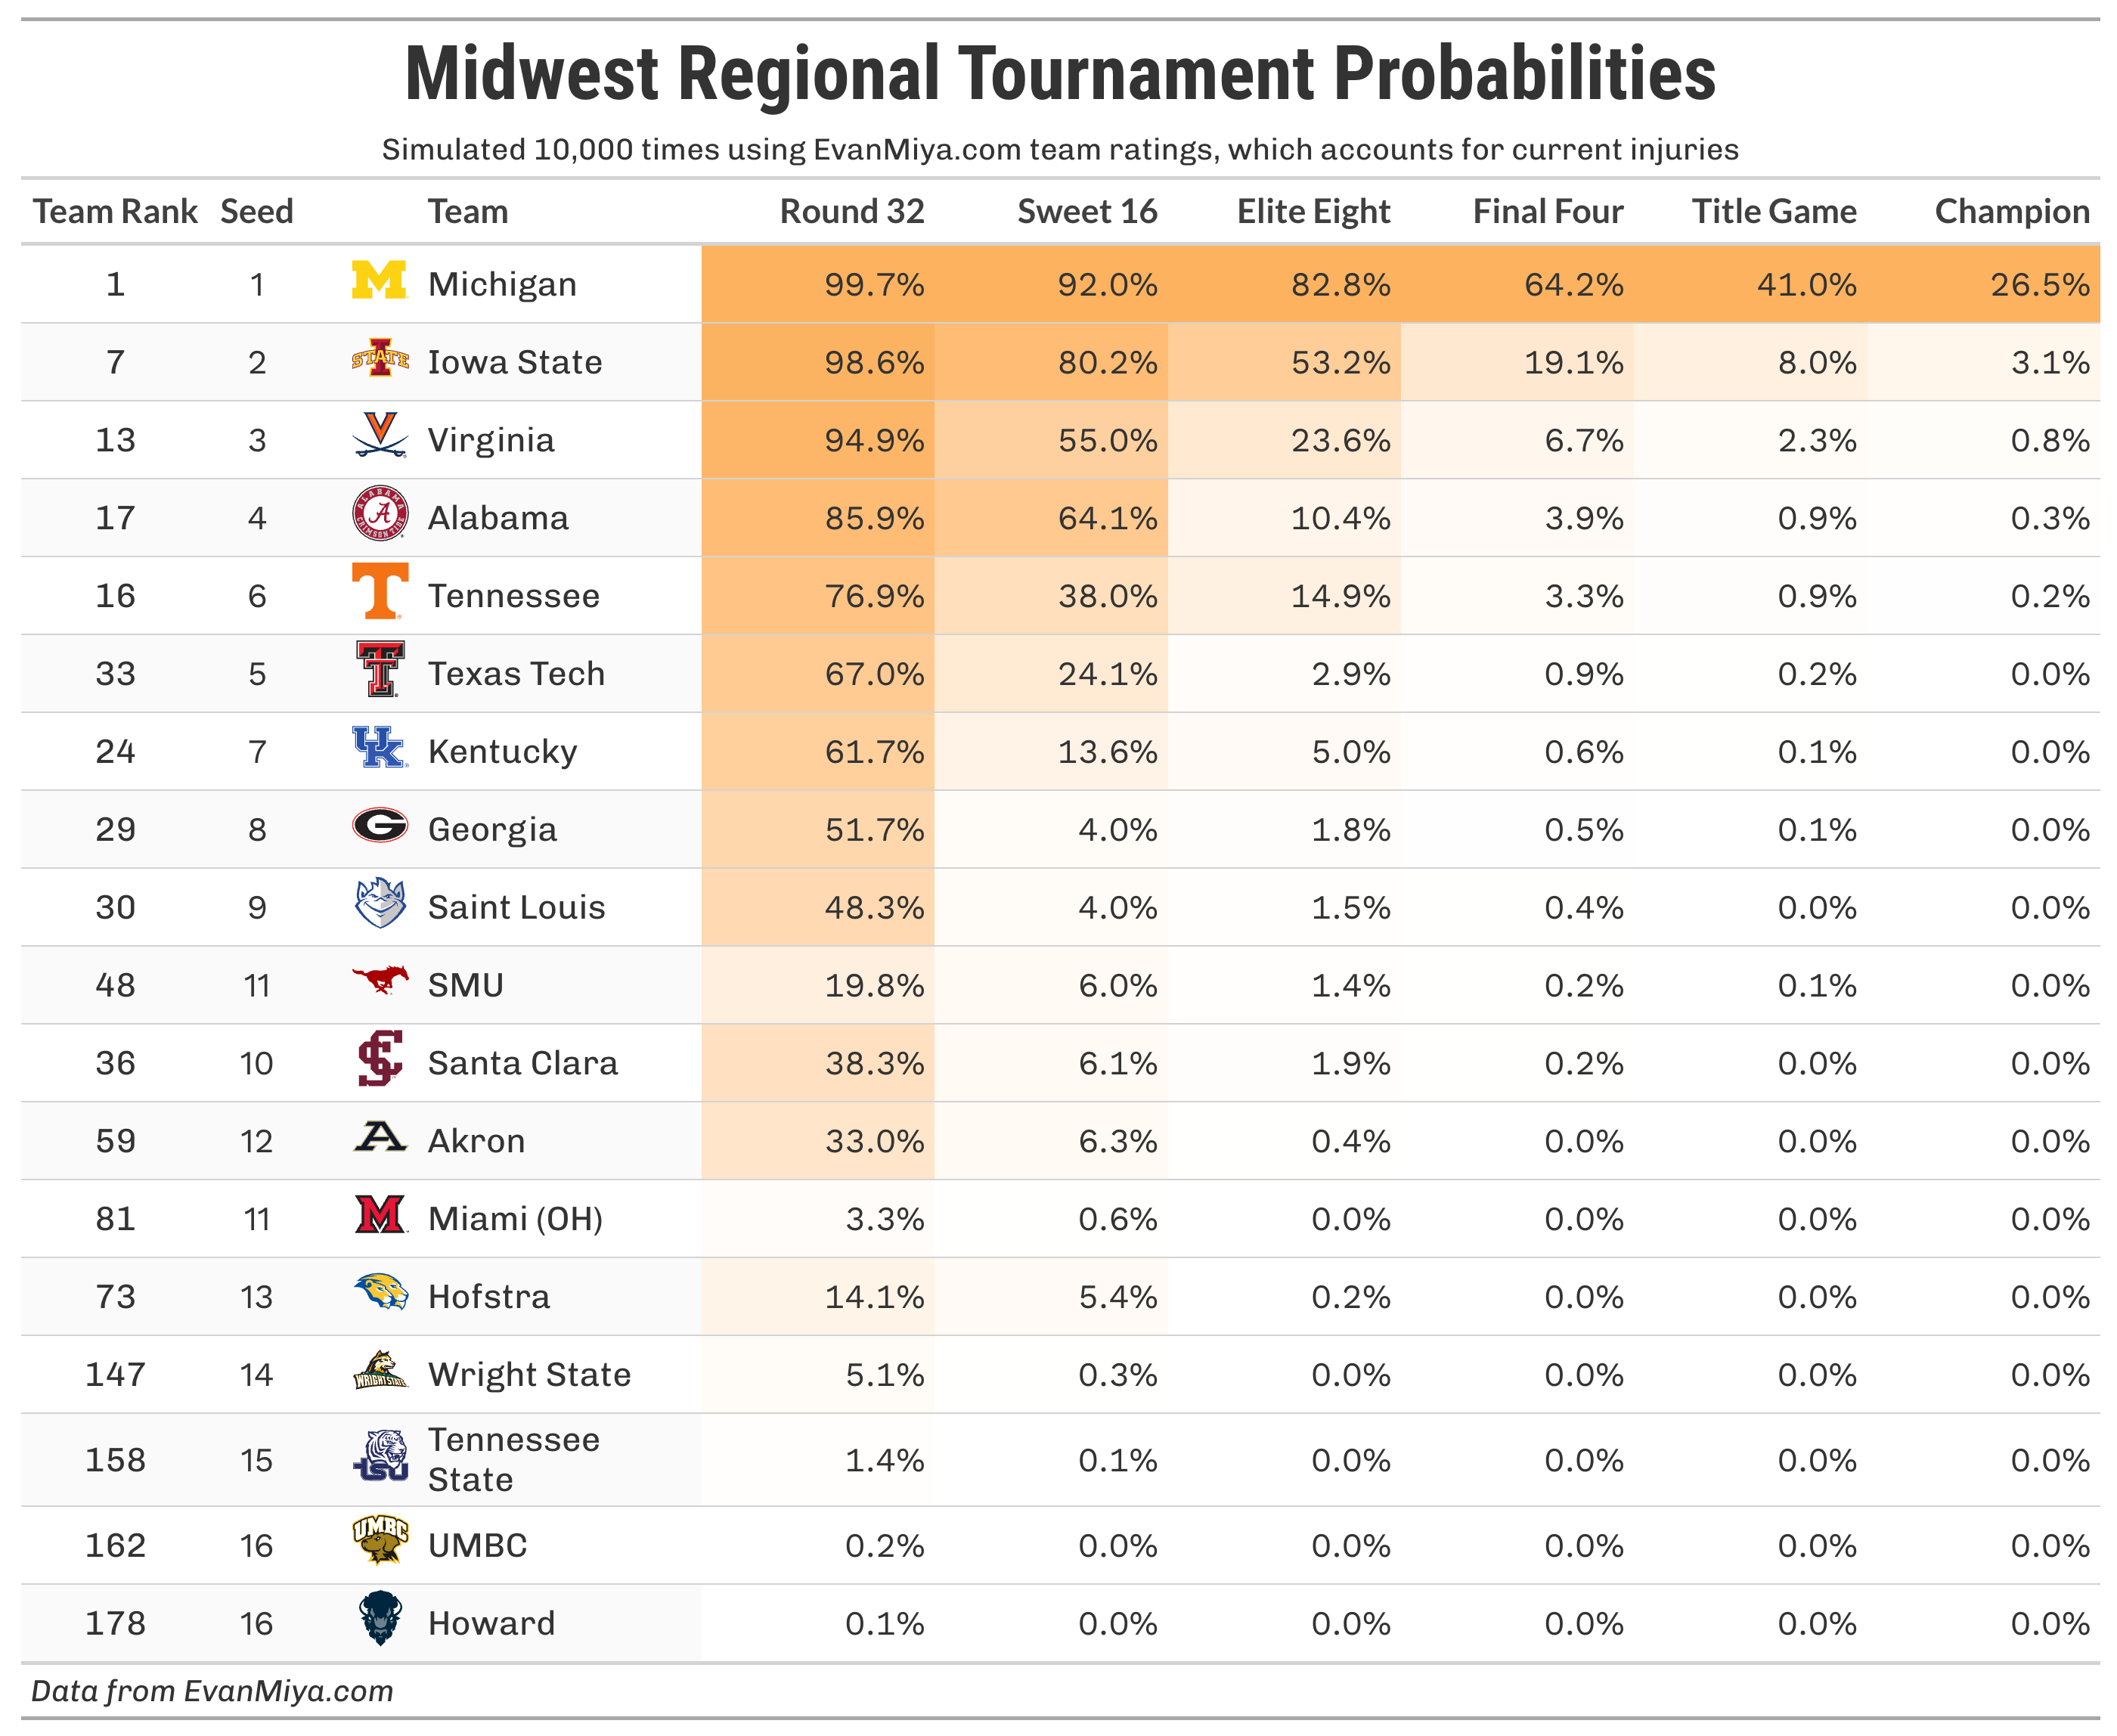
Tournament Probabilities By Region
The tables below show each team’s chances of advancing to each round of the tournament, which you can also find at EvanMiya.com, updated daily as the tourney progresses.
Mega Bracket Breakdown Episode
Tomorrow morning, I’ll be releasing a massive region-by-region breakdown of the NCAA tournament bracket, along with extended analysis on many of these graphics here. Be sure to subscribe on podcast platforms or on Youtube!
looks like you have the wrong teams in the query - This preview shows the potential top-10 matchup in the 2nd round between Houston and Gonzaga:
but iowa state and kentucky are listed
Is me picking Vandy over Florida and Miami FL to the elite eight just picking an upset for the sake of it?