


Part of what makes college basketball so entertaining is how hard it is to predict who will be good. We argue all offseason about the minutiae of every set of preseason rankings, only for them to all be massively wrong by January. This year we have the added chaos of eligibility cases for 5th-year and international players leading to even wilder takes than usual.
Instead of focusing solely on where each team is placed in my preseason team rankings at EvanMiya.com, a more interesting angle is to use the uncertainty estimates attached to each team’s preseason projection to determine their ceiling and floor outcomes. Using 10,000 season simulations, I have calculated various possibilities for how the season will unfold.
Some teams have more uncertainty in their preseason projections than others. These teams usually share common themes: a new head coach, greater reliance on freshmen, more roster turnover, or greater uncertainty about roster eligibility. Teams like LSU, St. John’s, and North Carolina have more variance, while the model is more confident in the possible outcomes for teams like Florida, Illinois, and Michigan State.
I have tried my best to account for best- and worst-case scenarios for eligibility-related factors as well, though the process was by no means perfect.
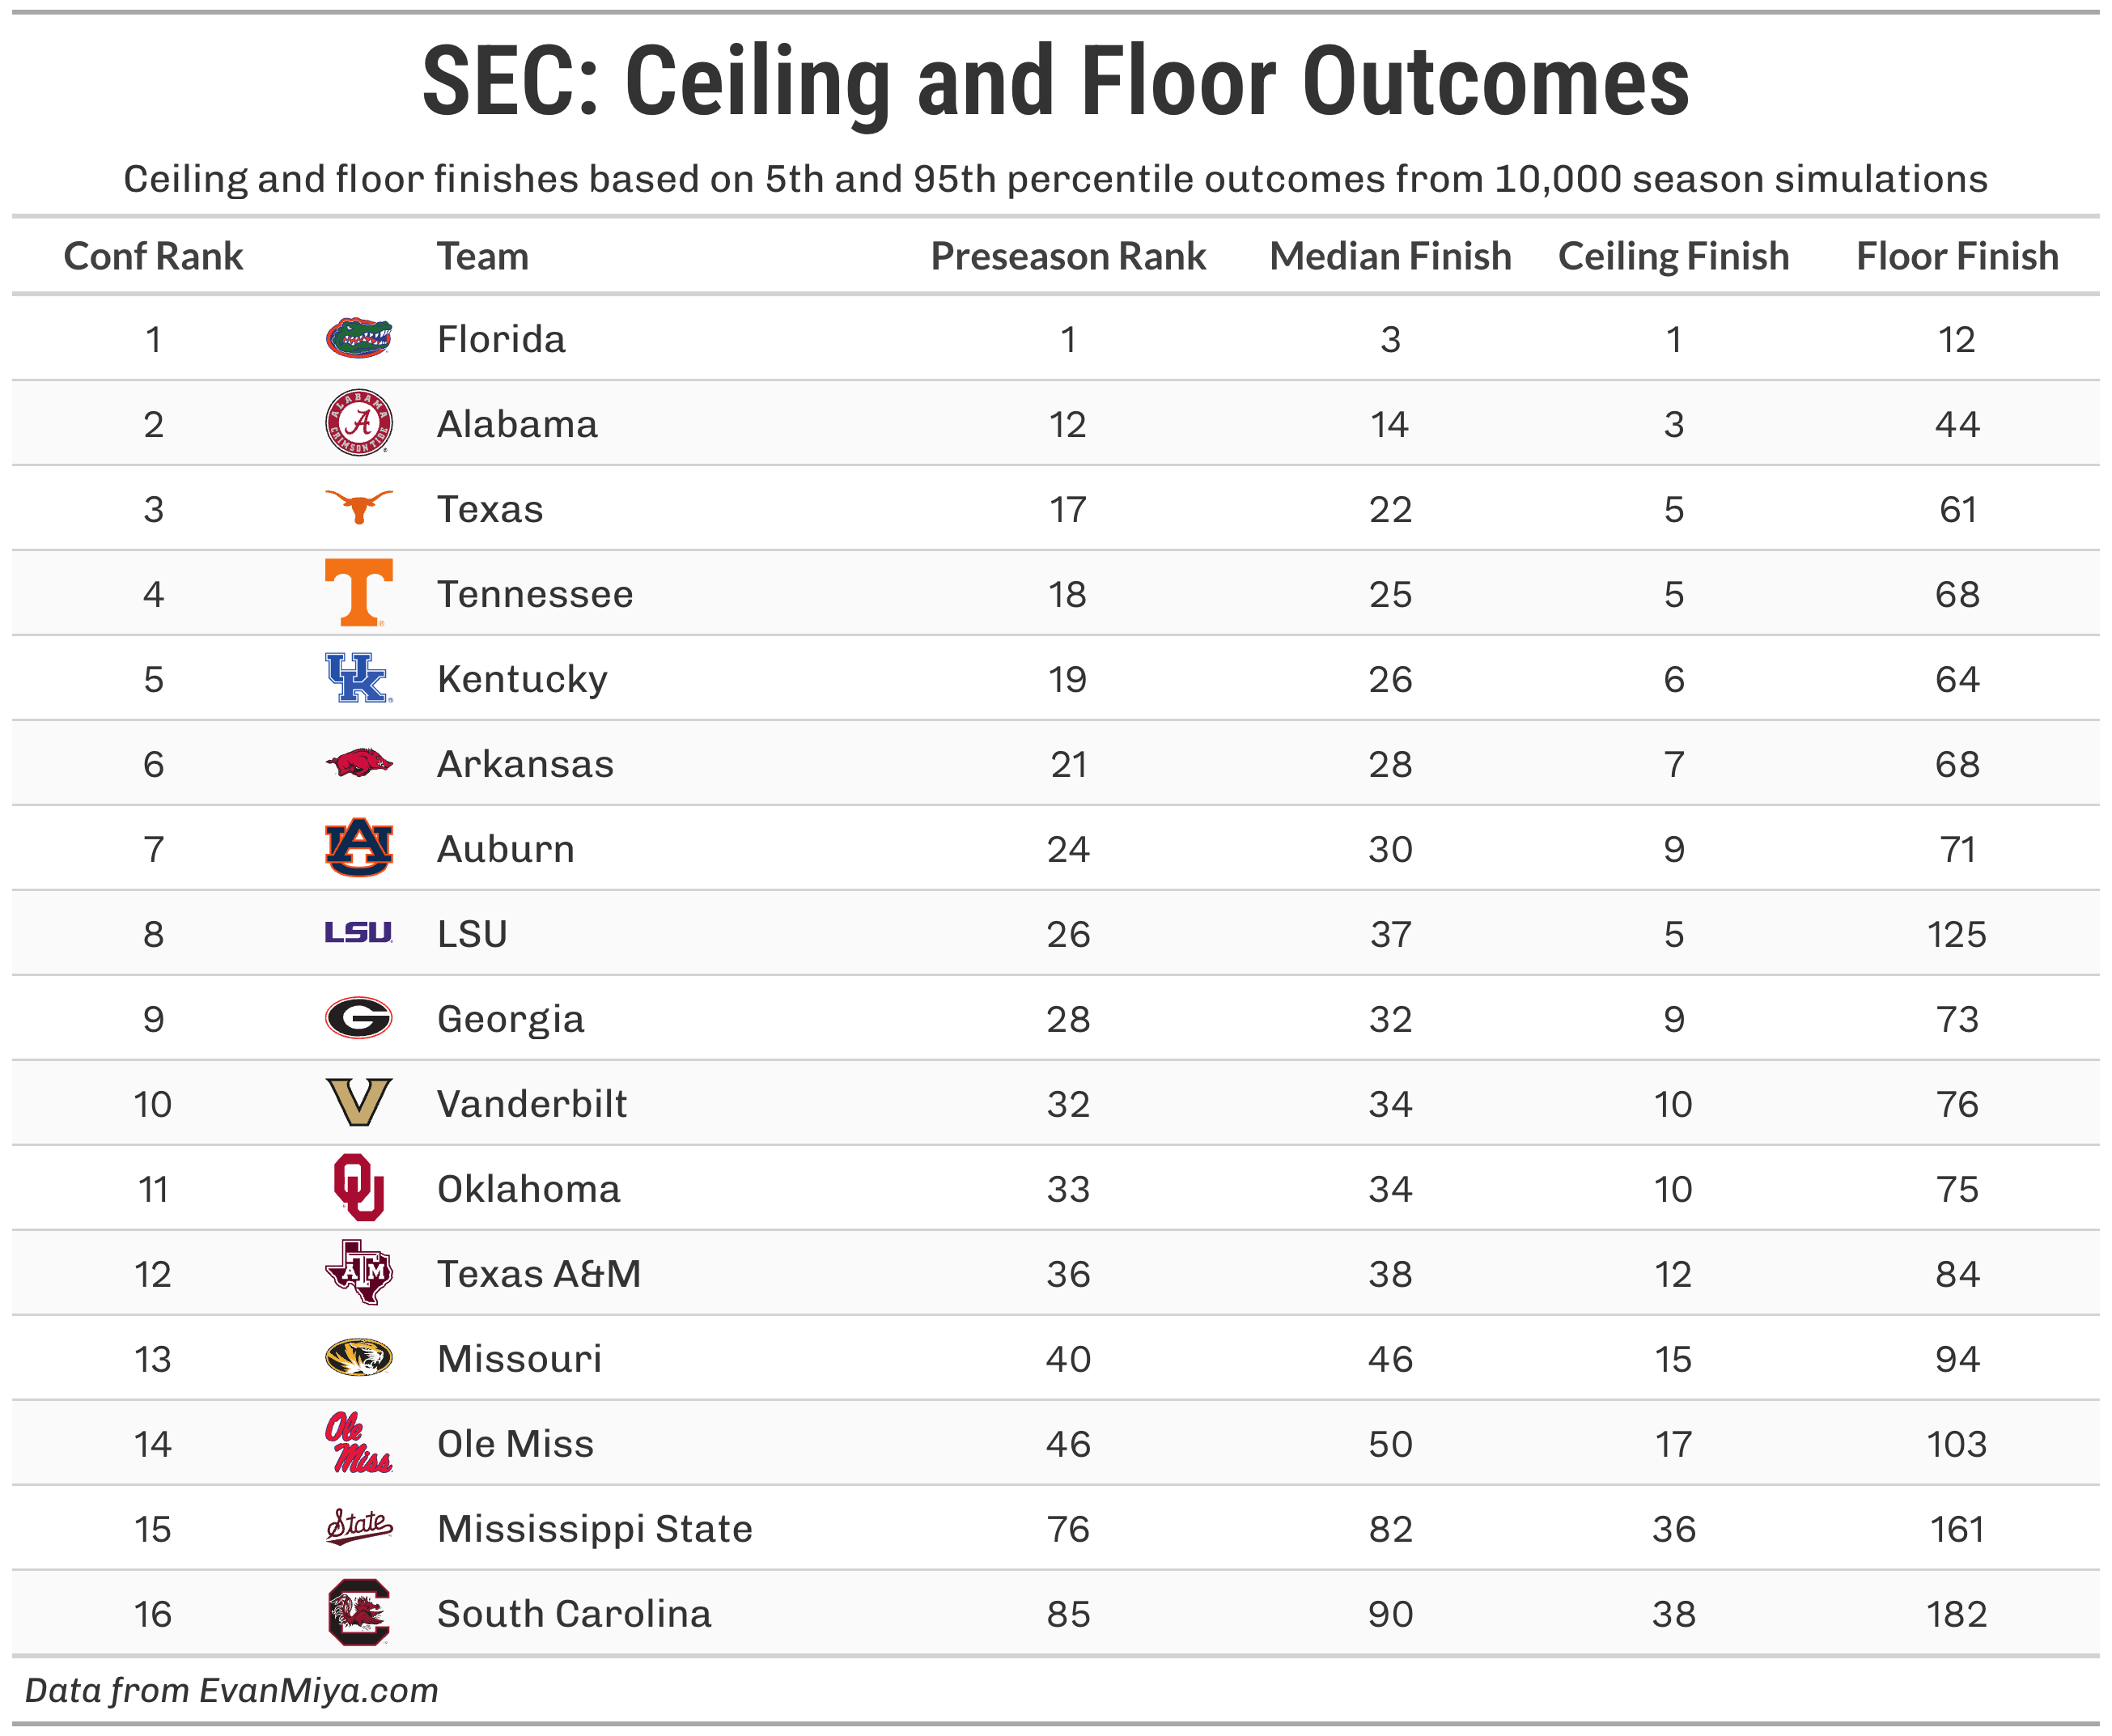
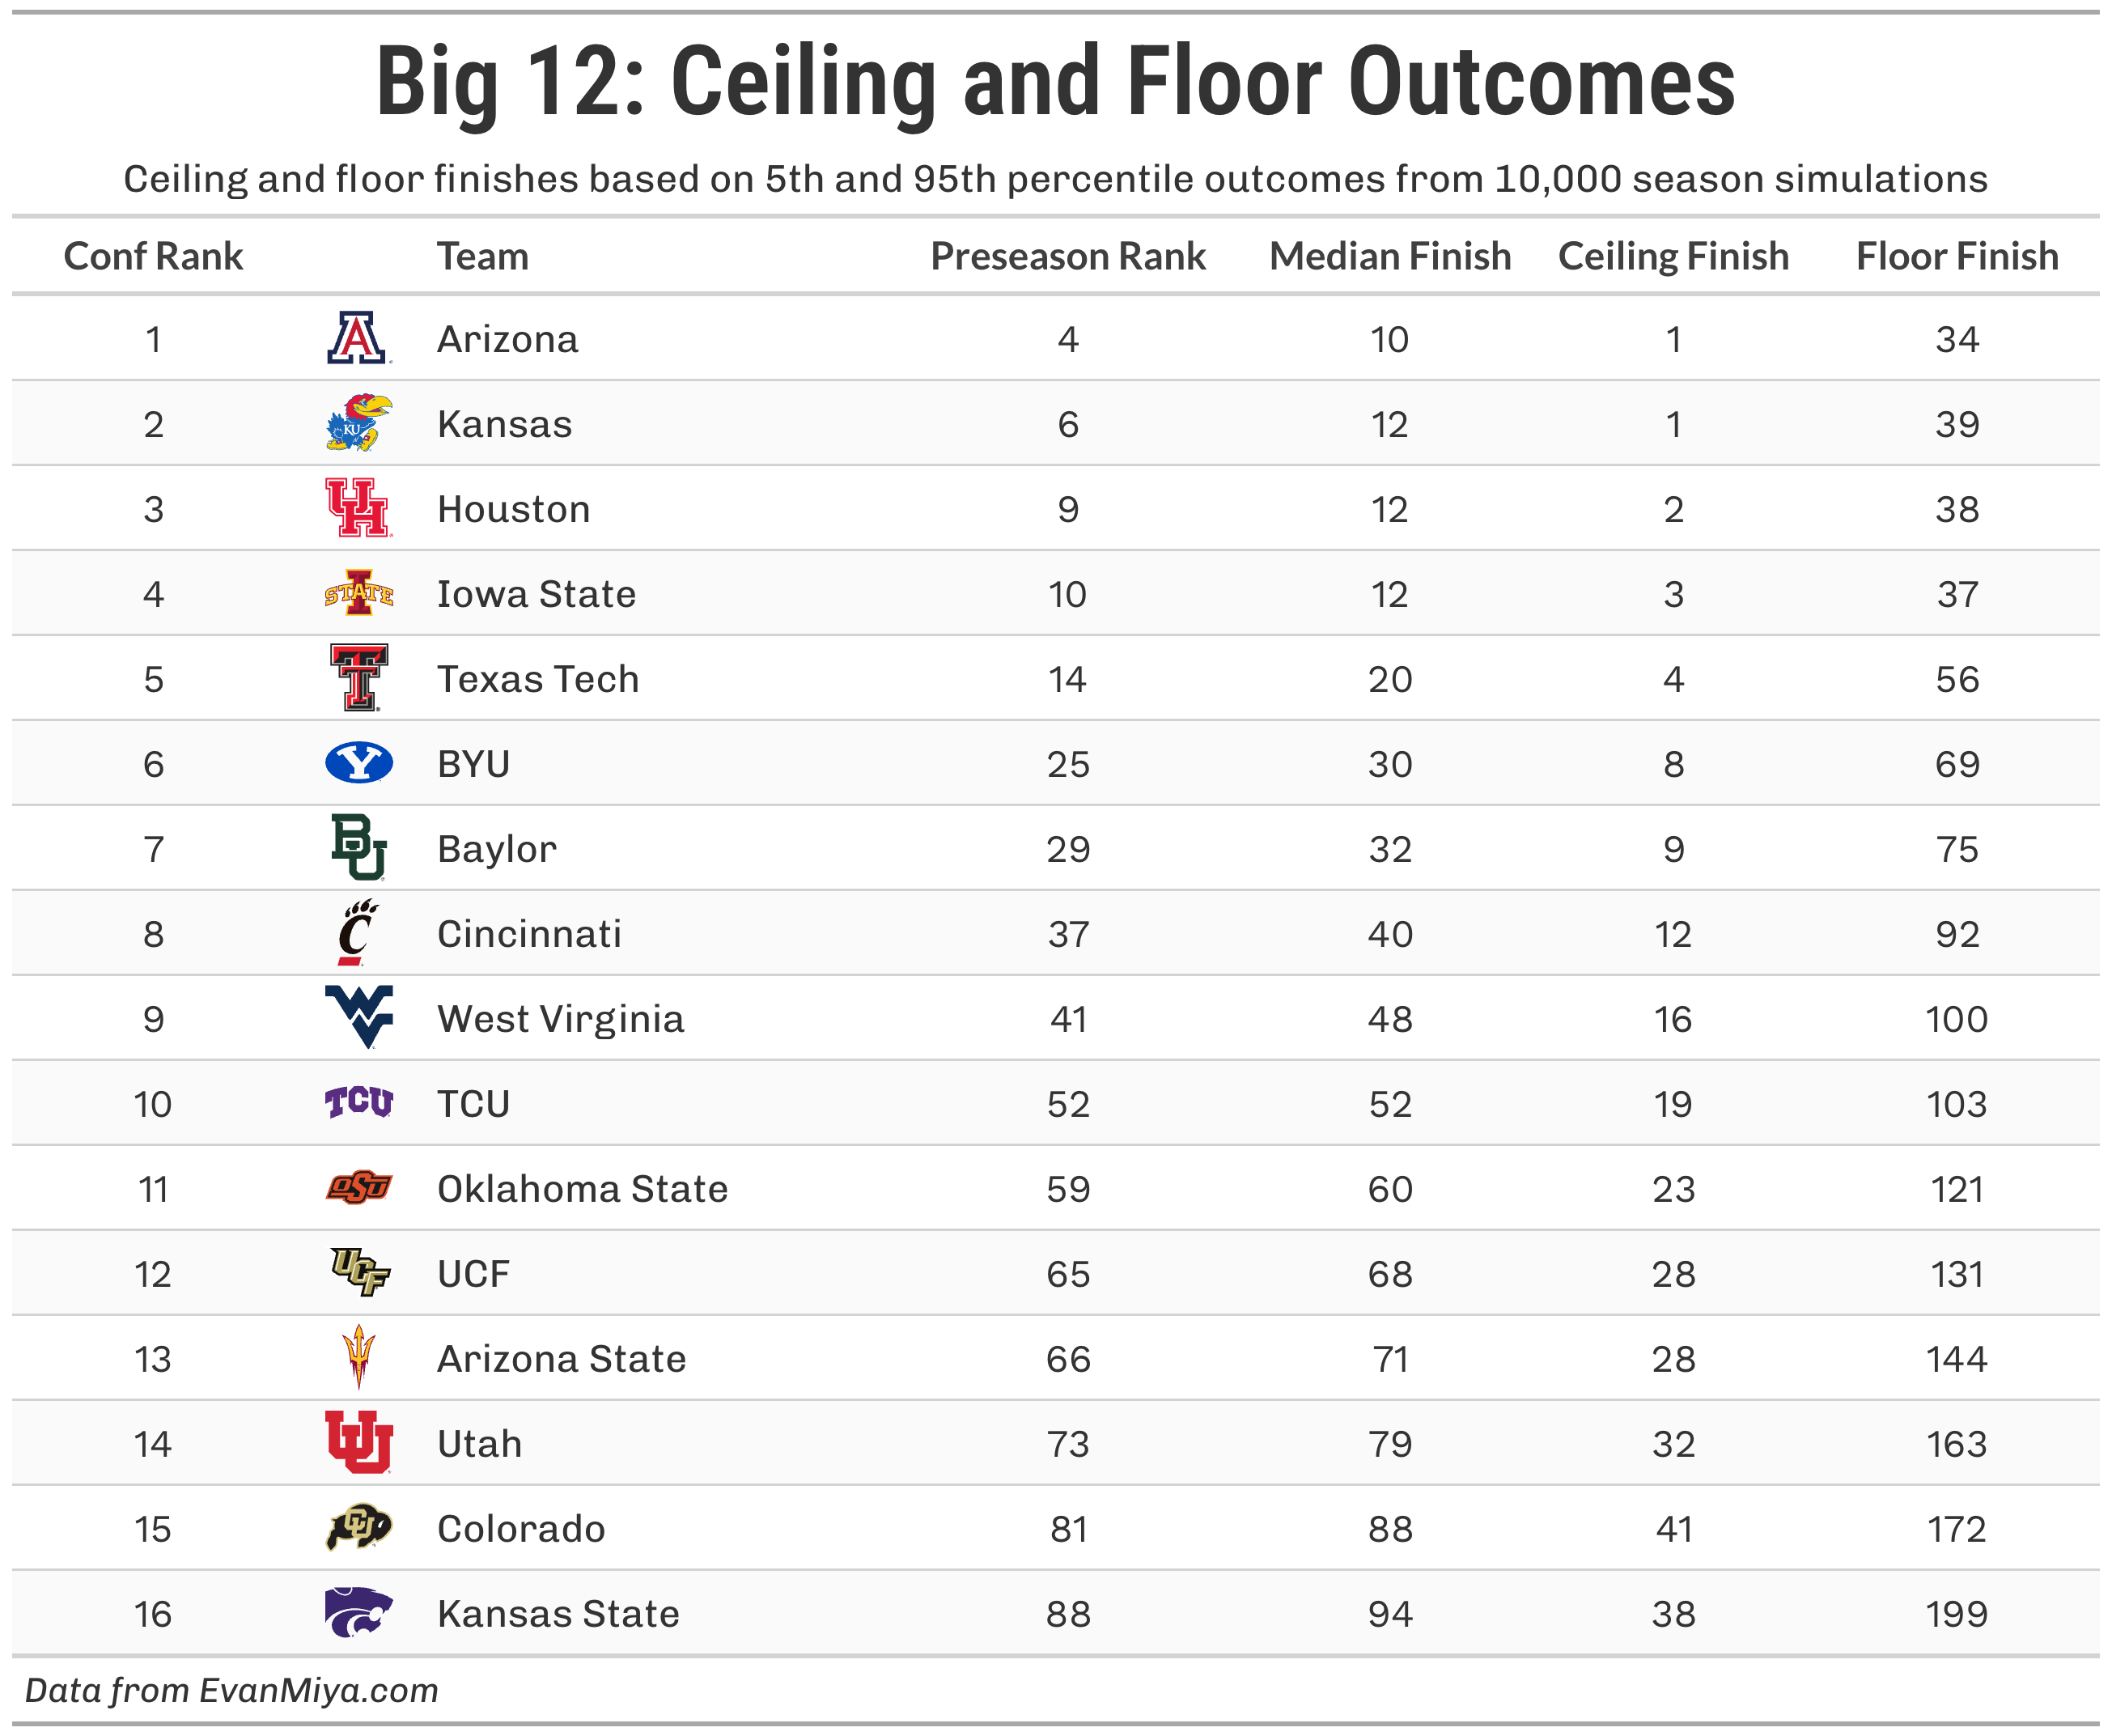
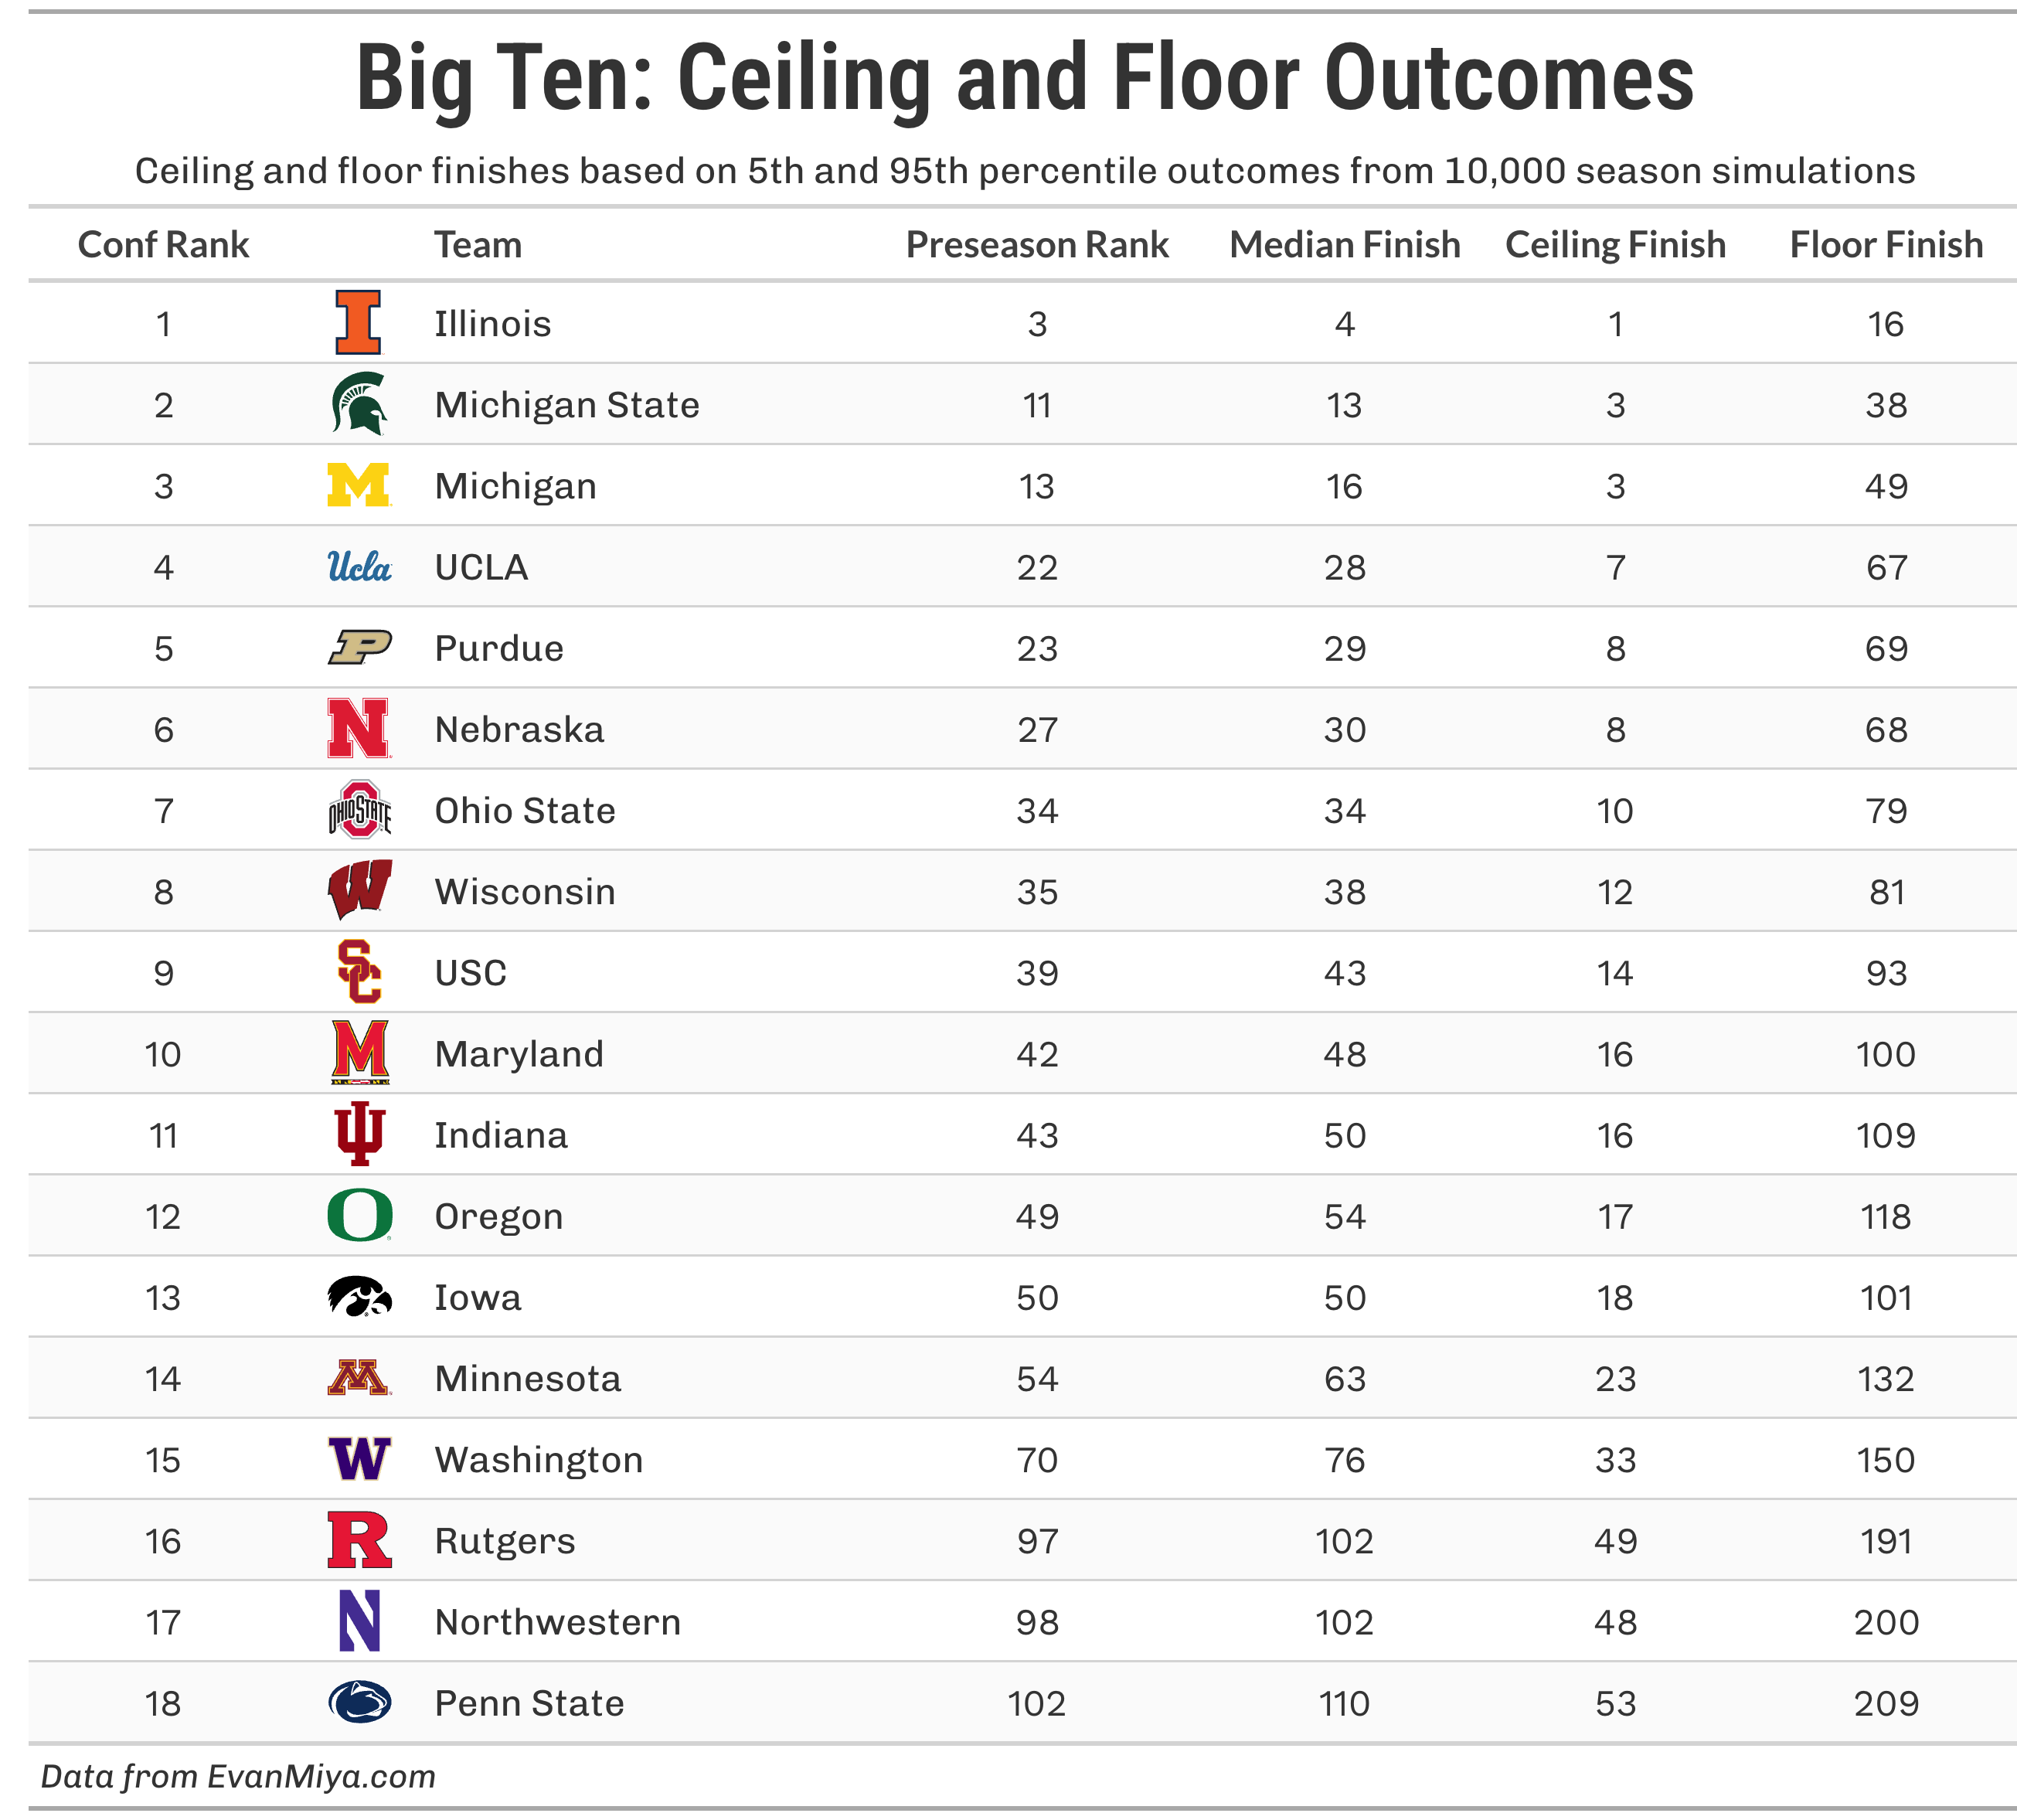
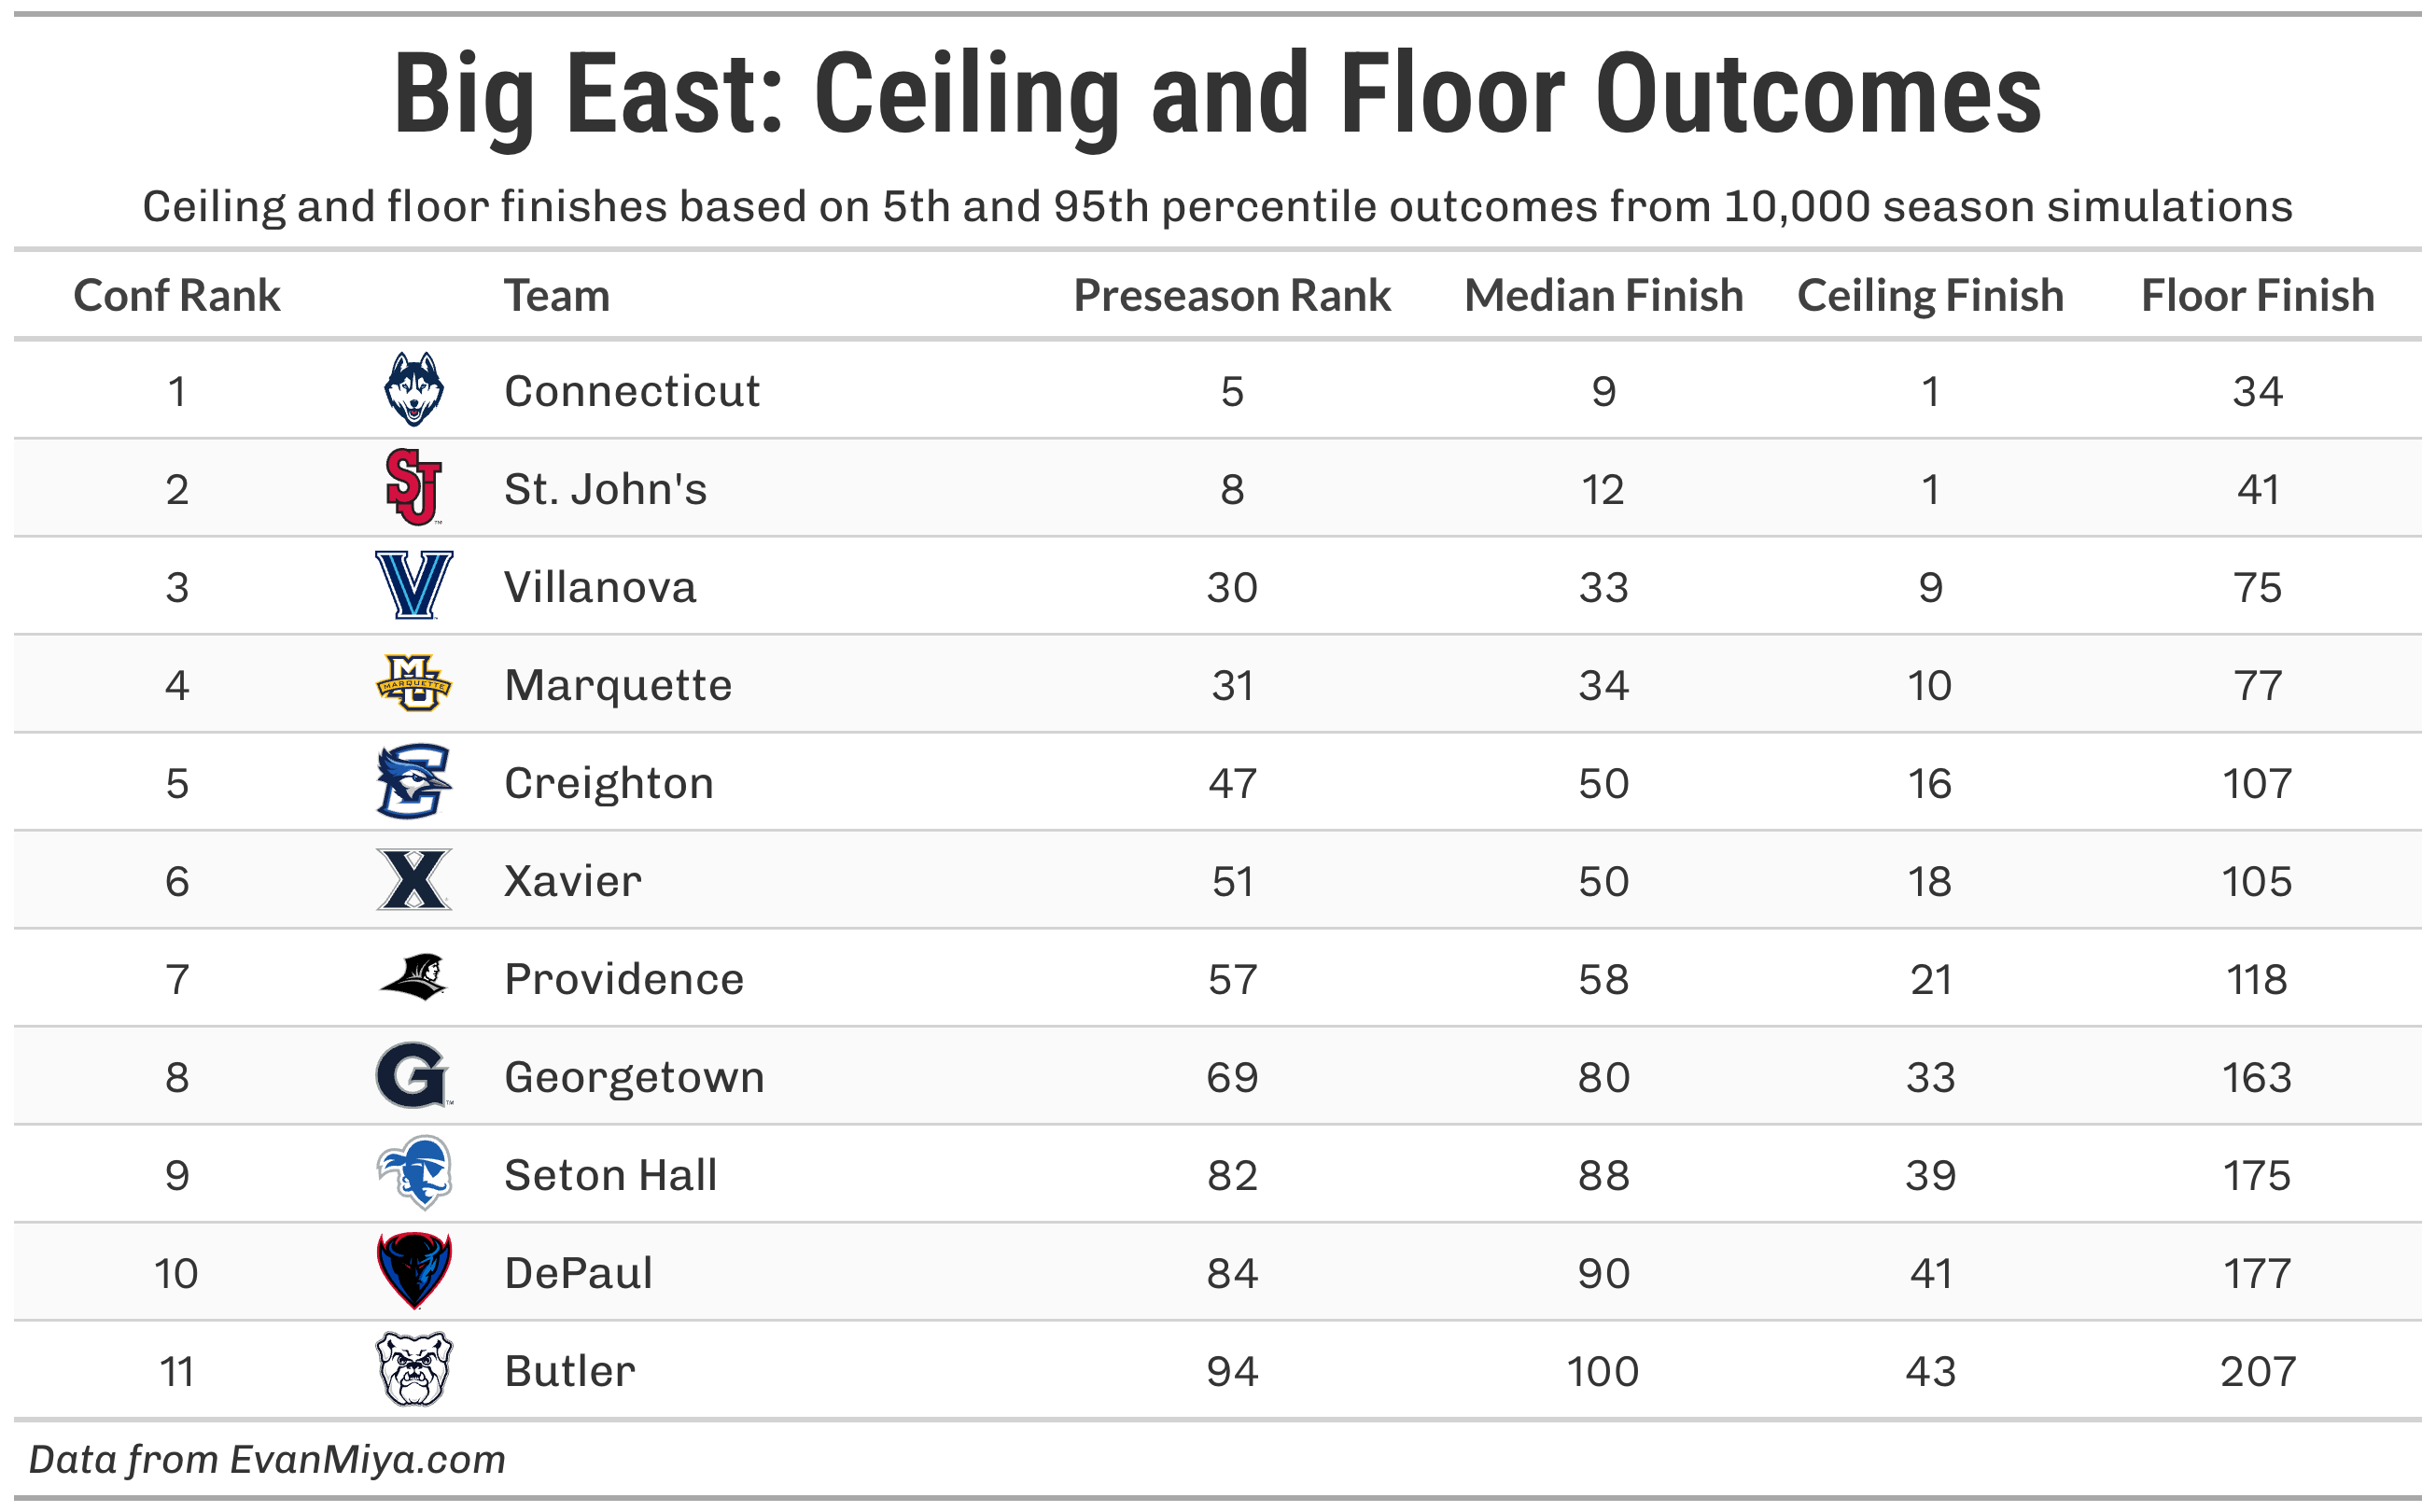
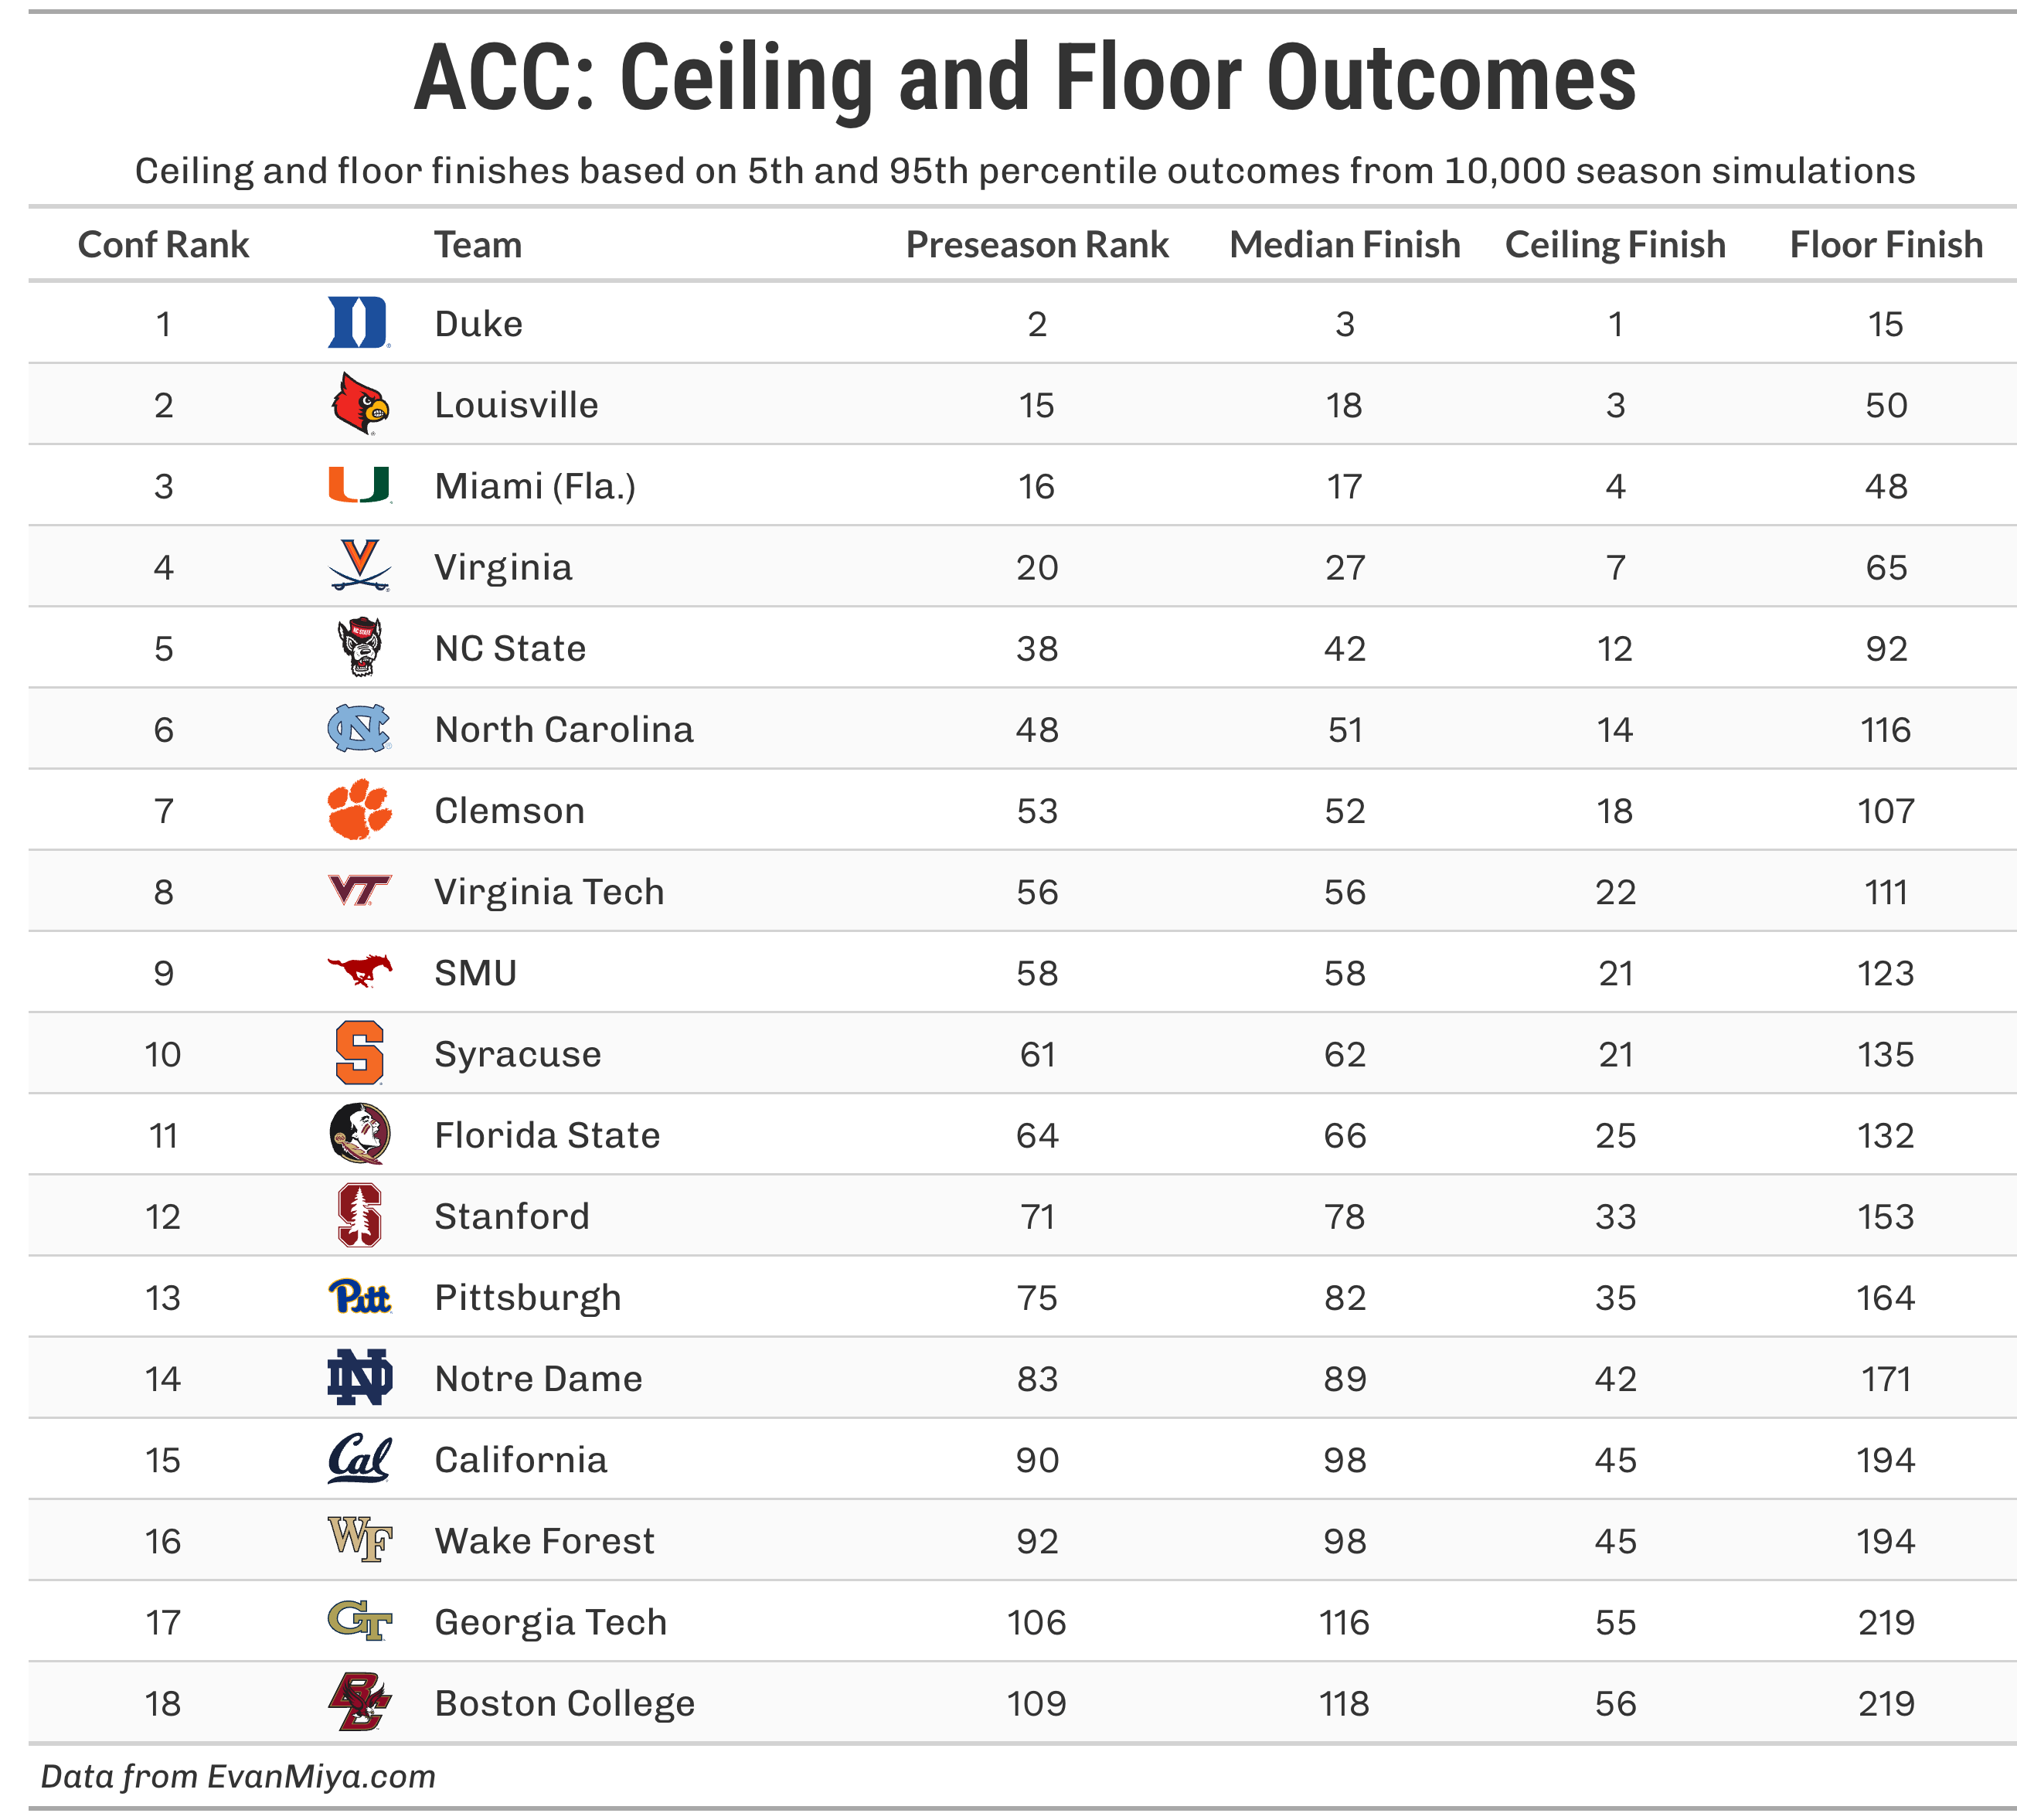
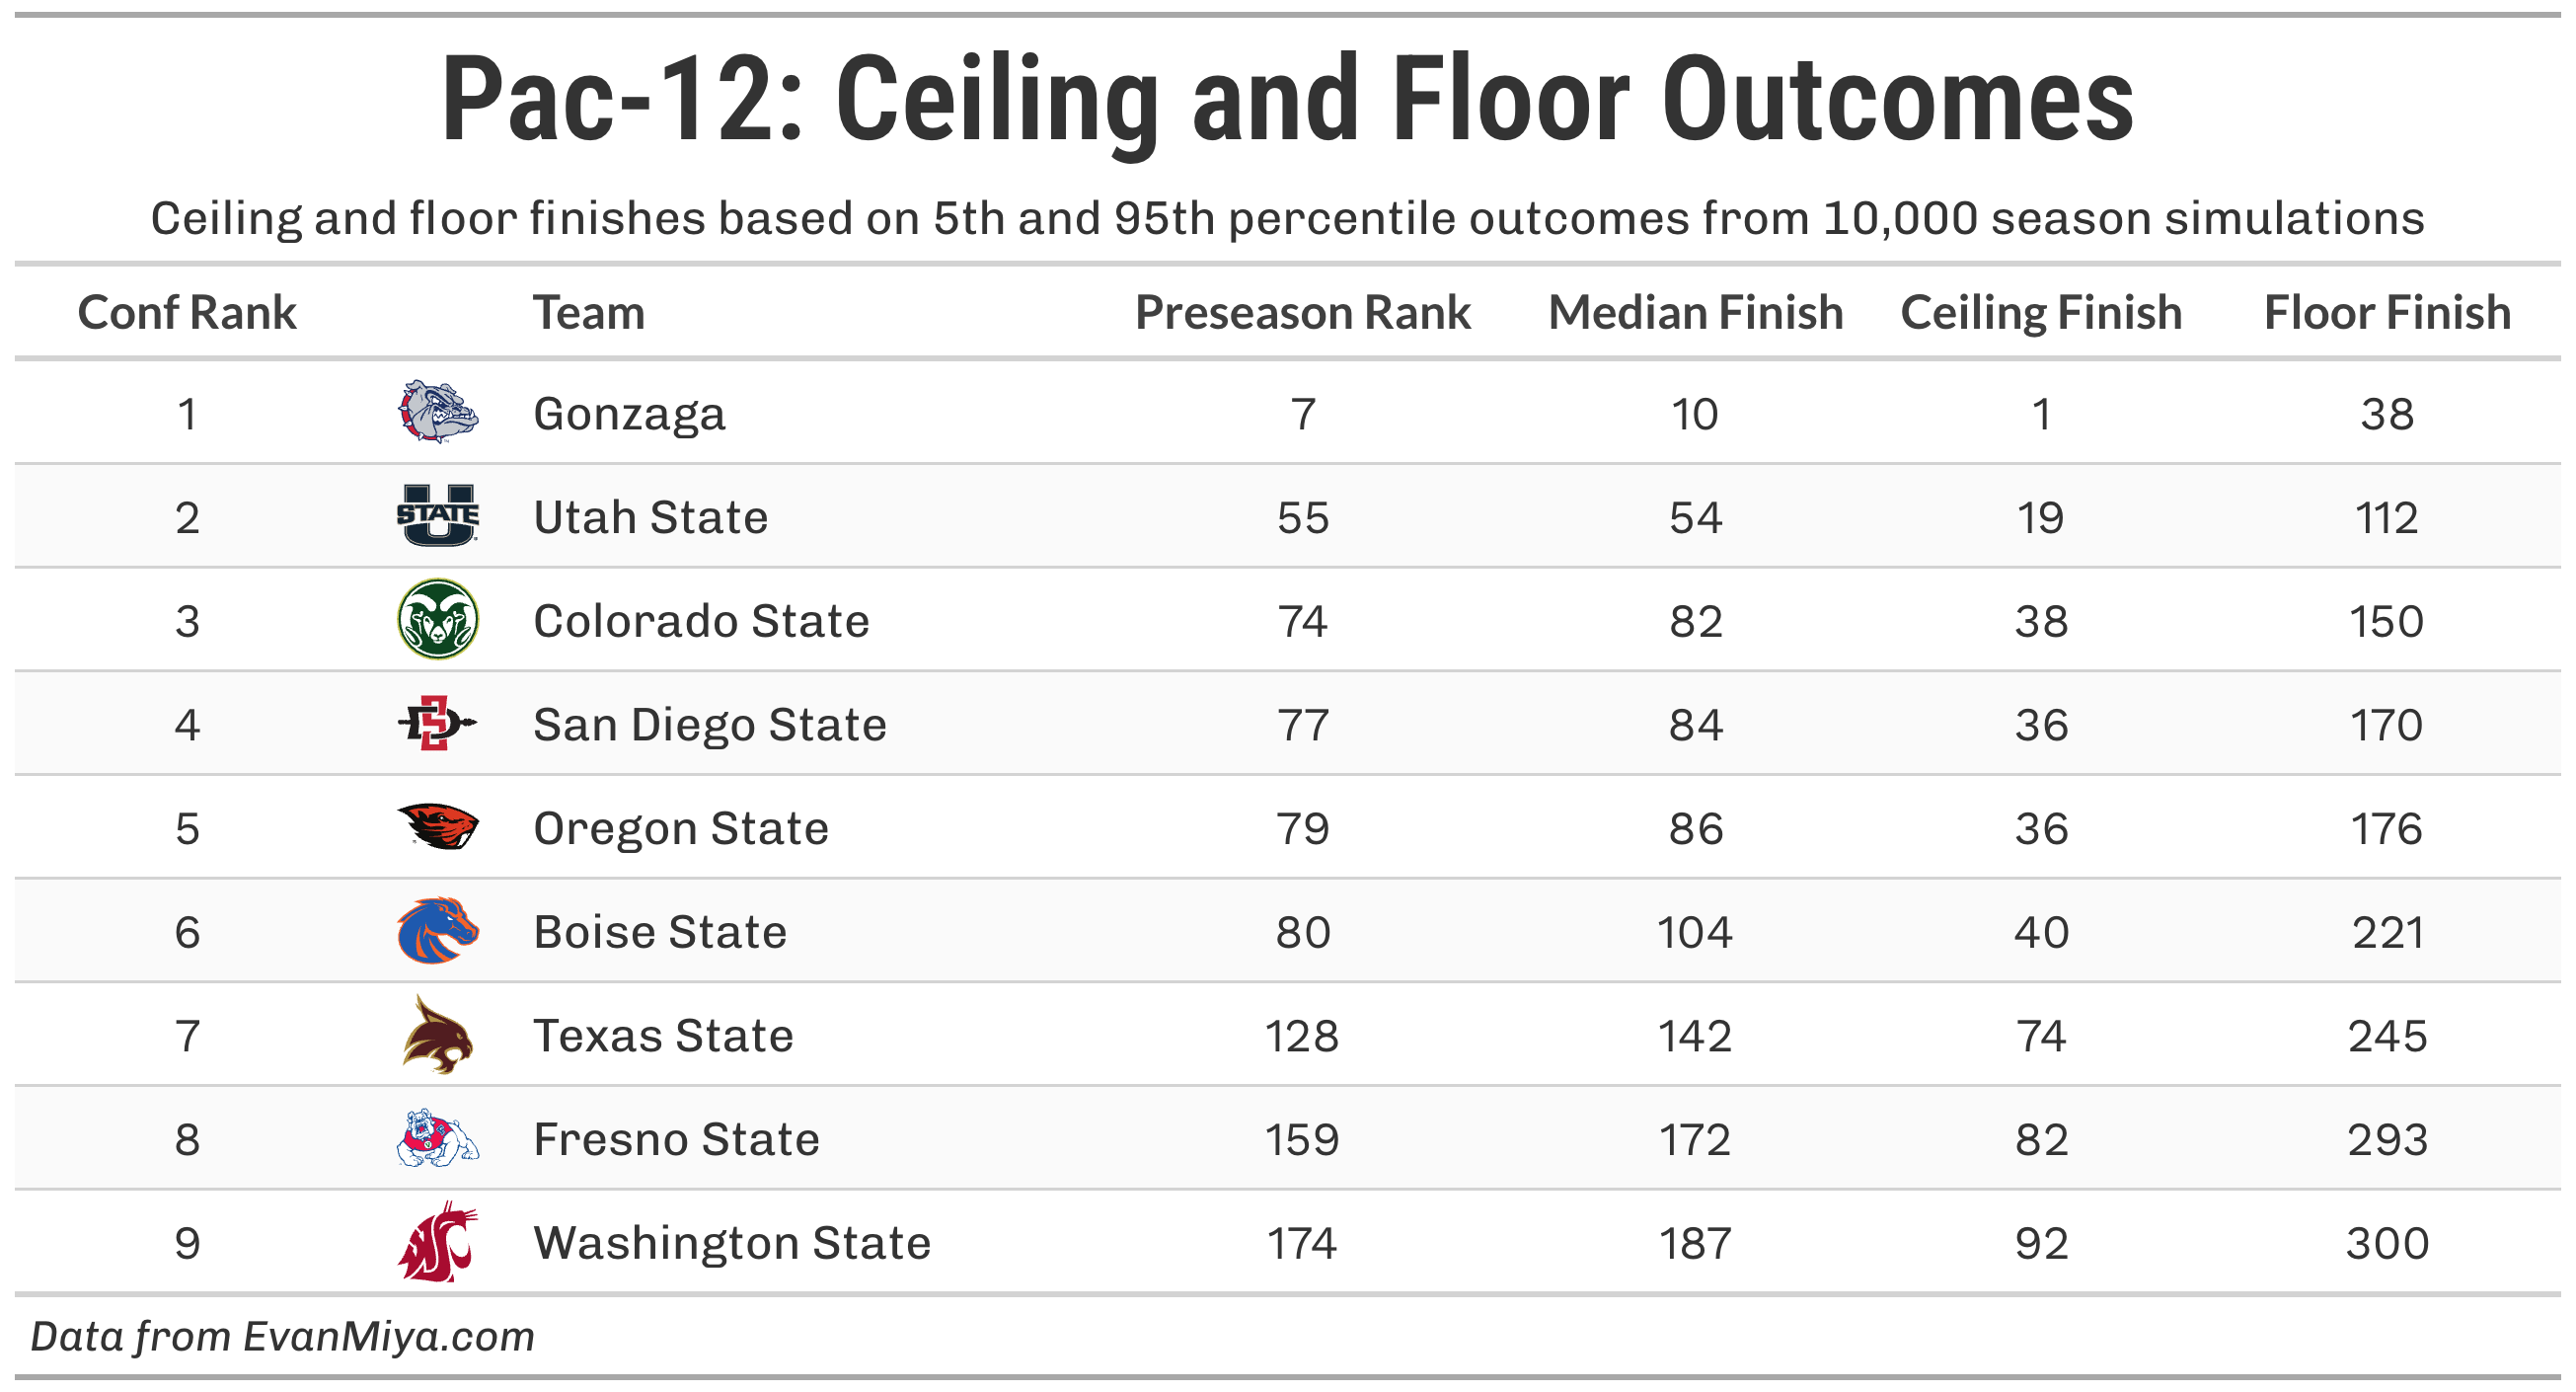
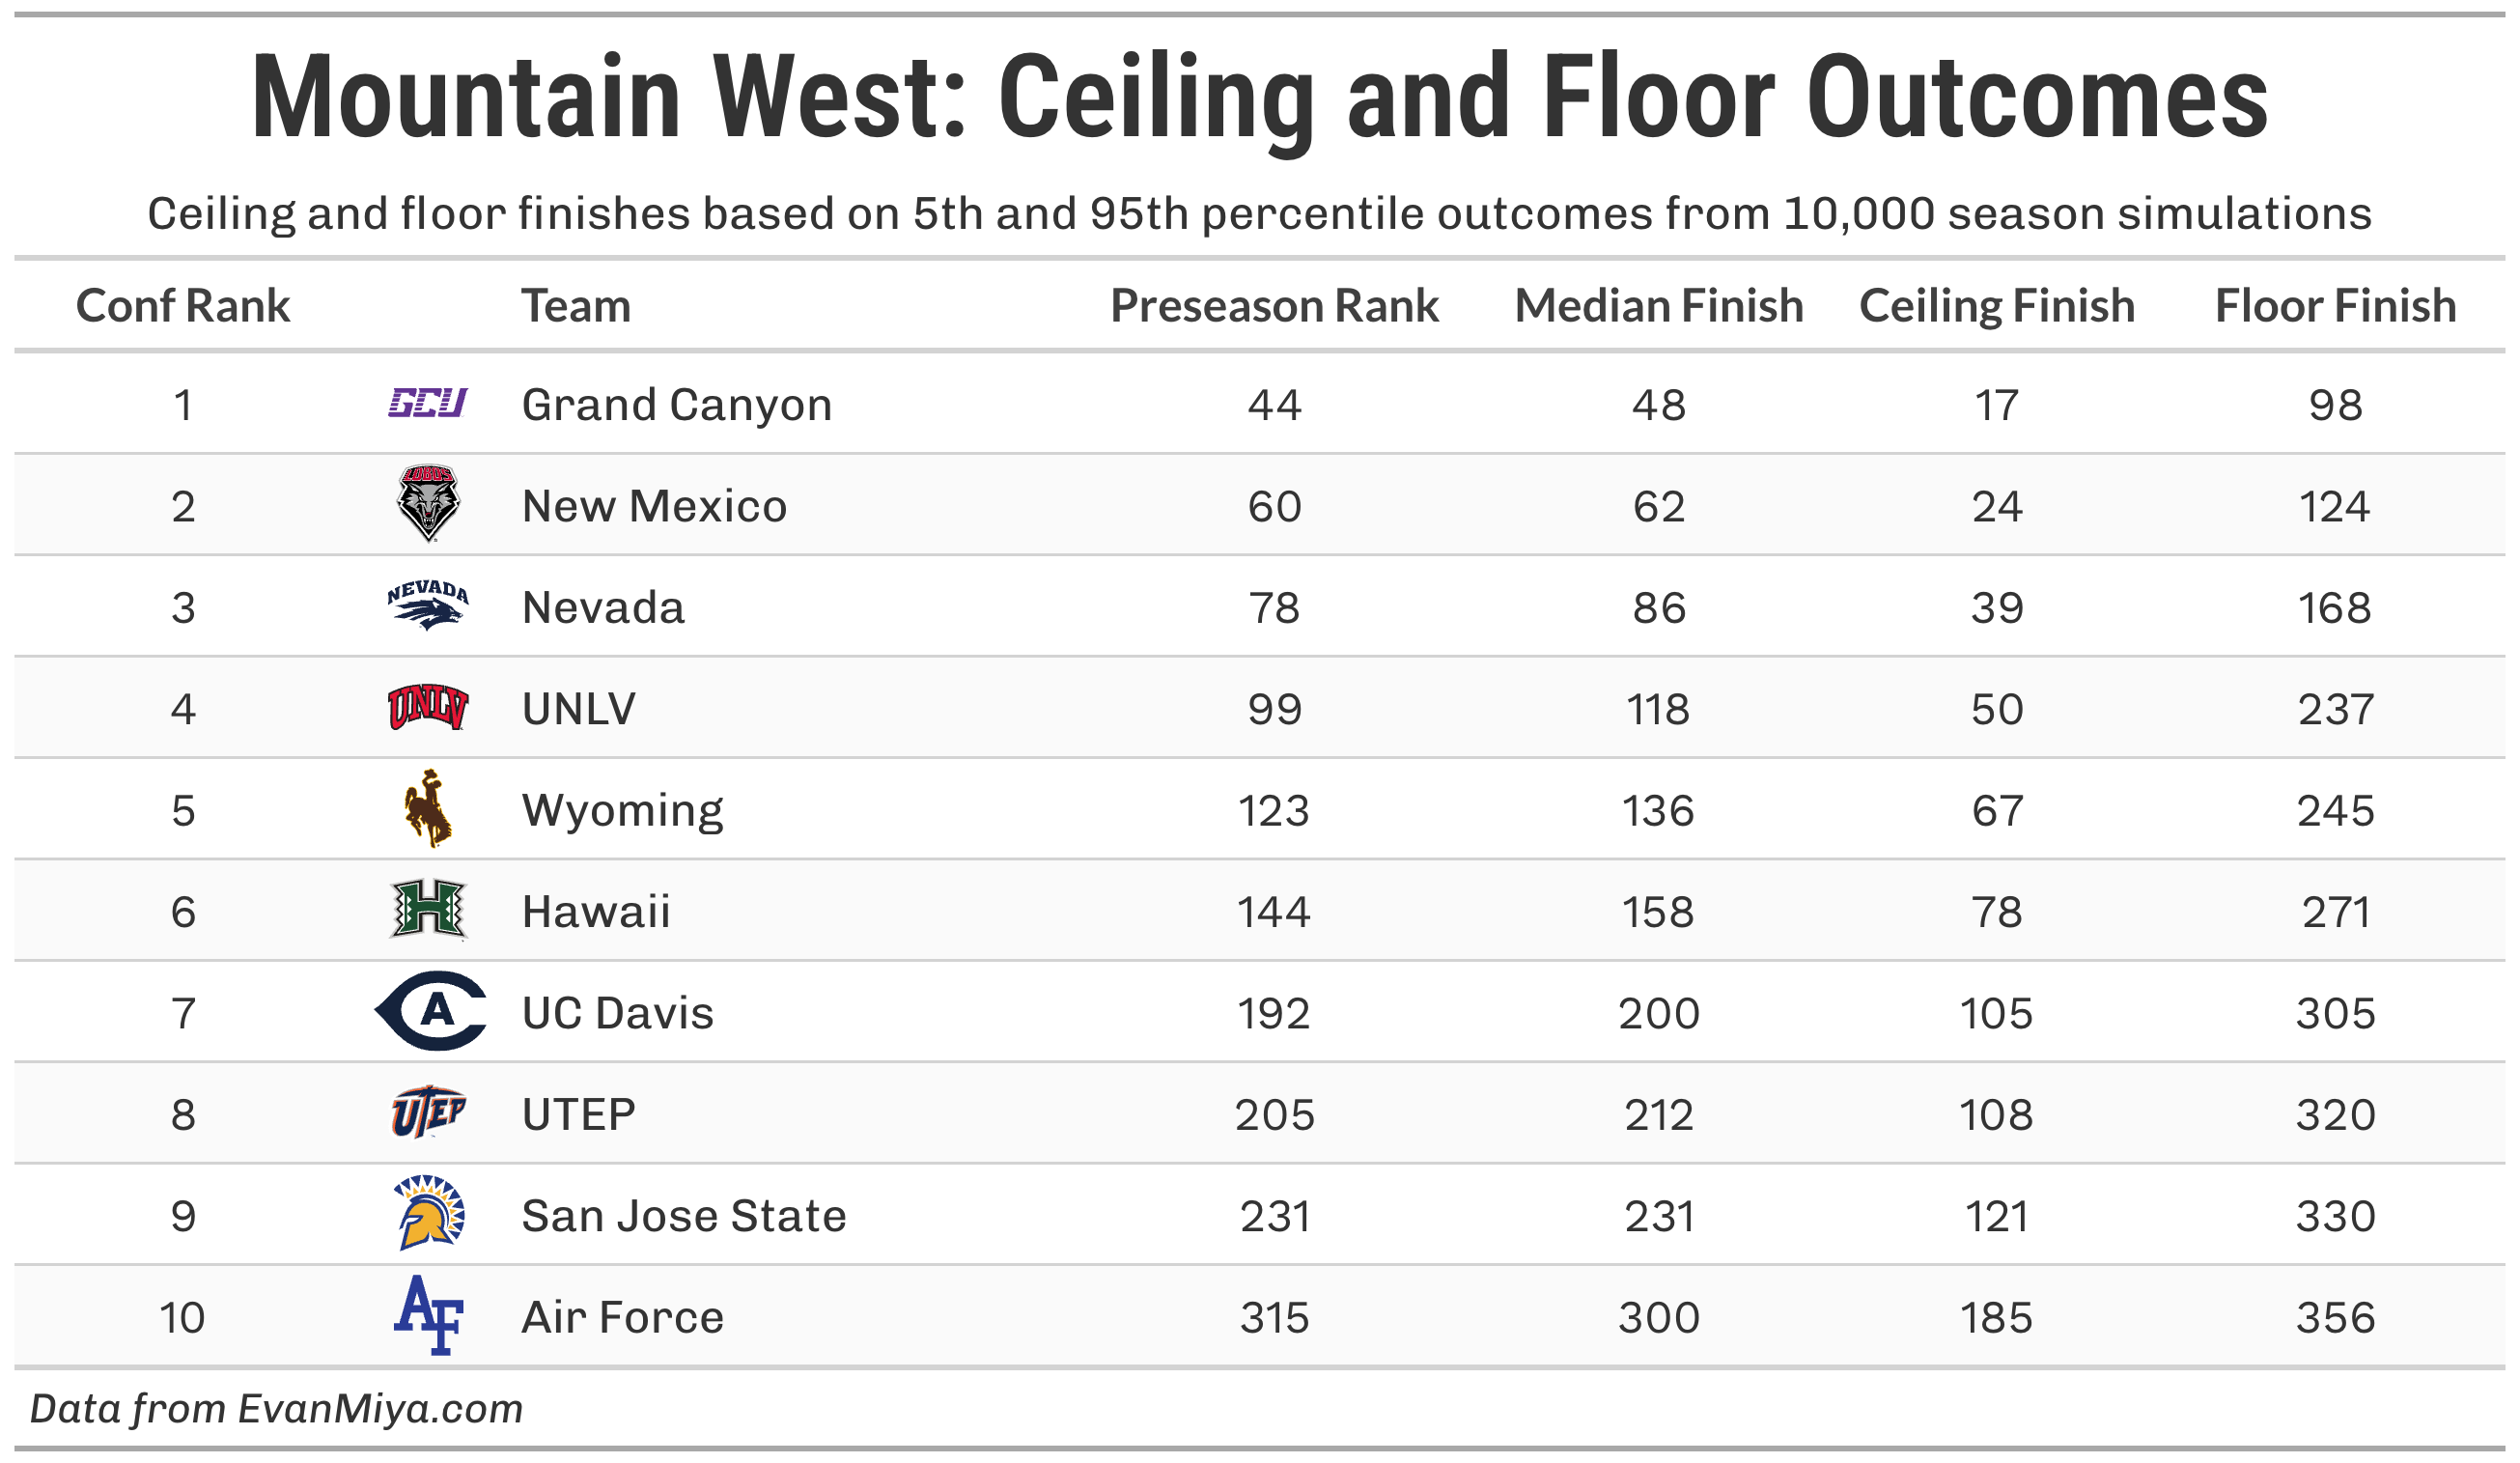
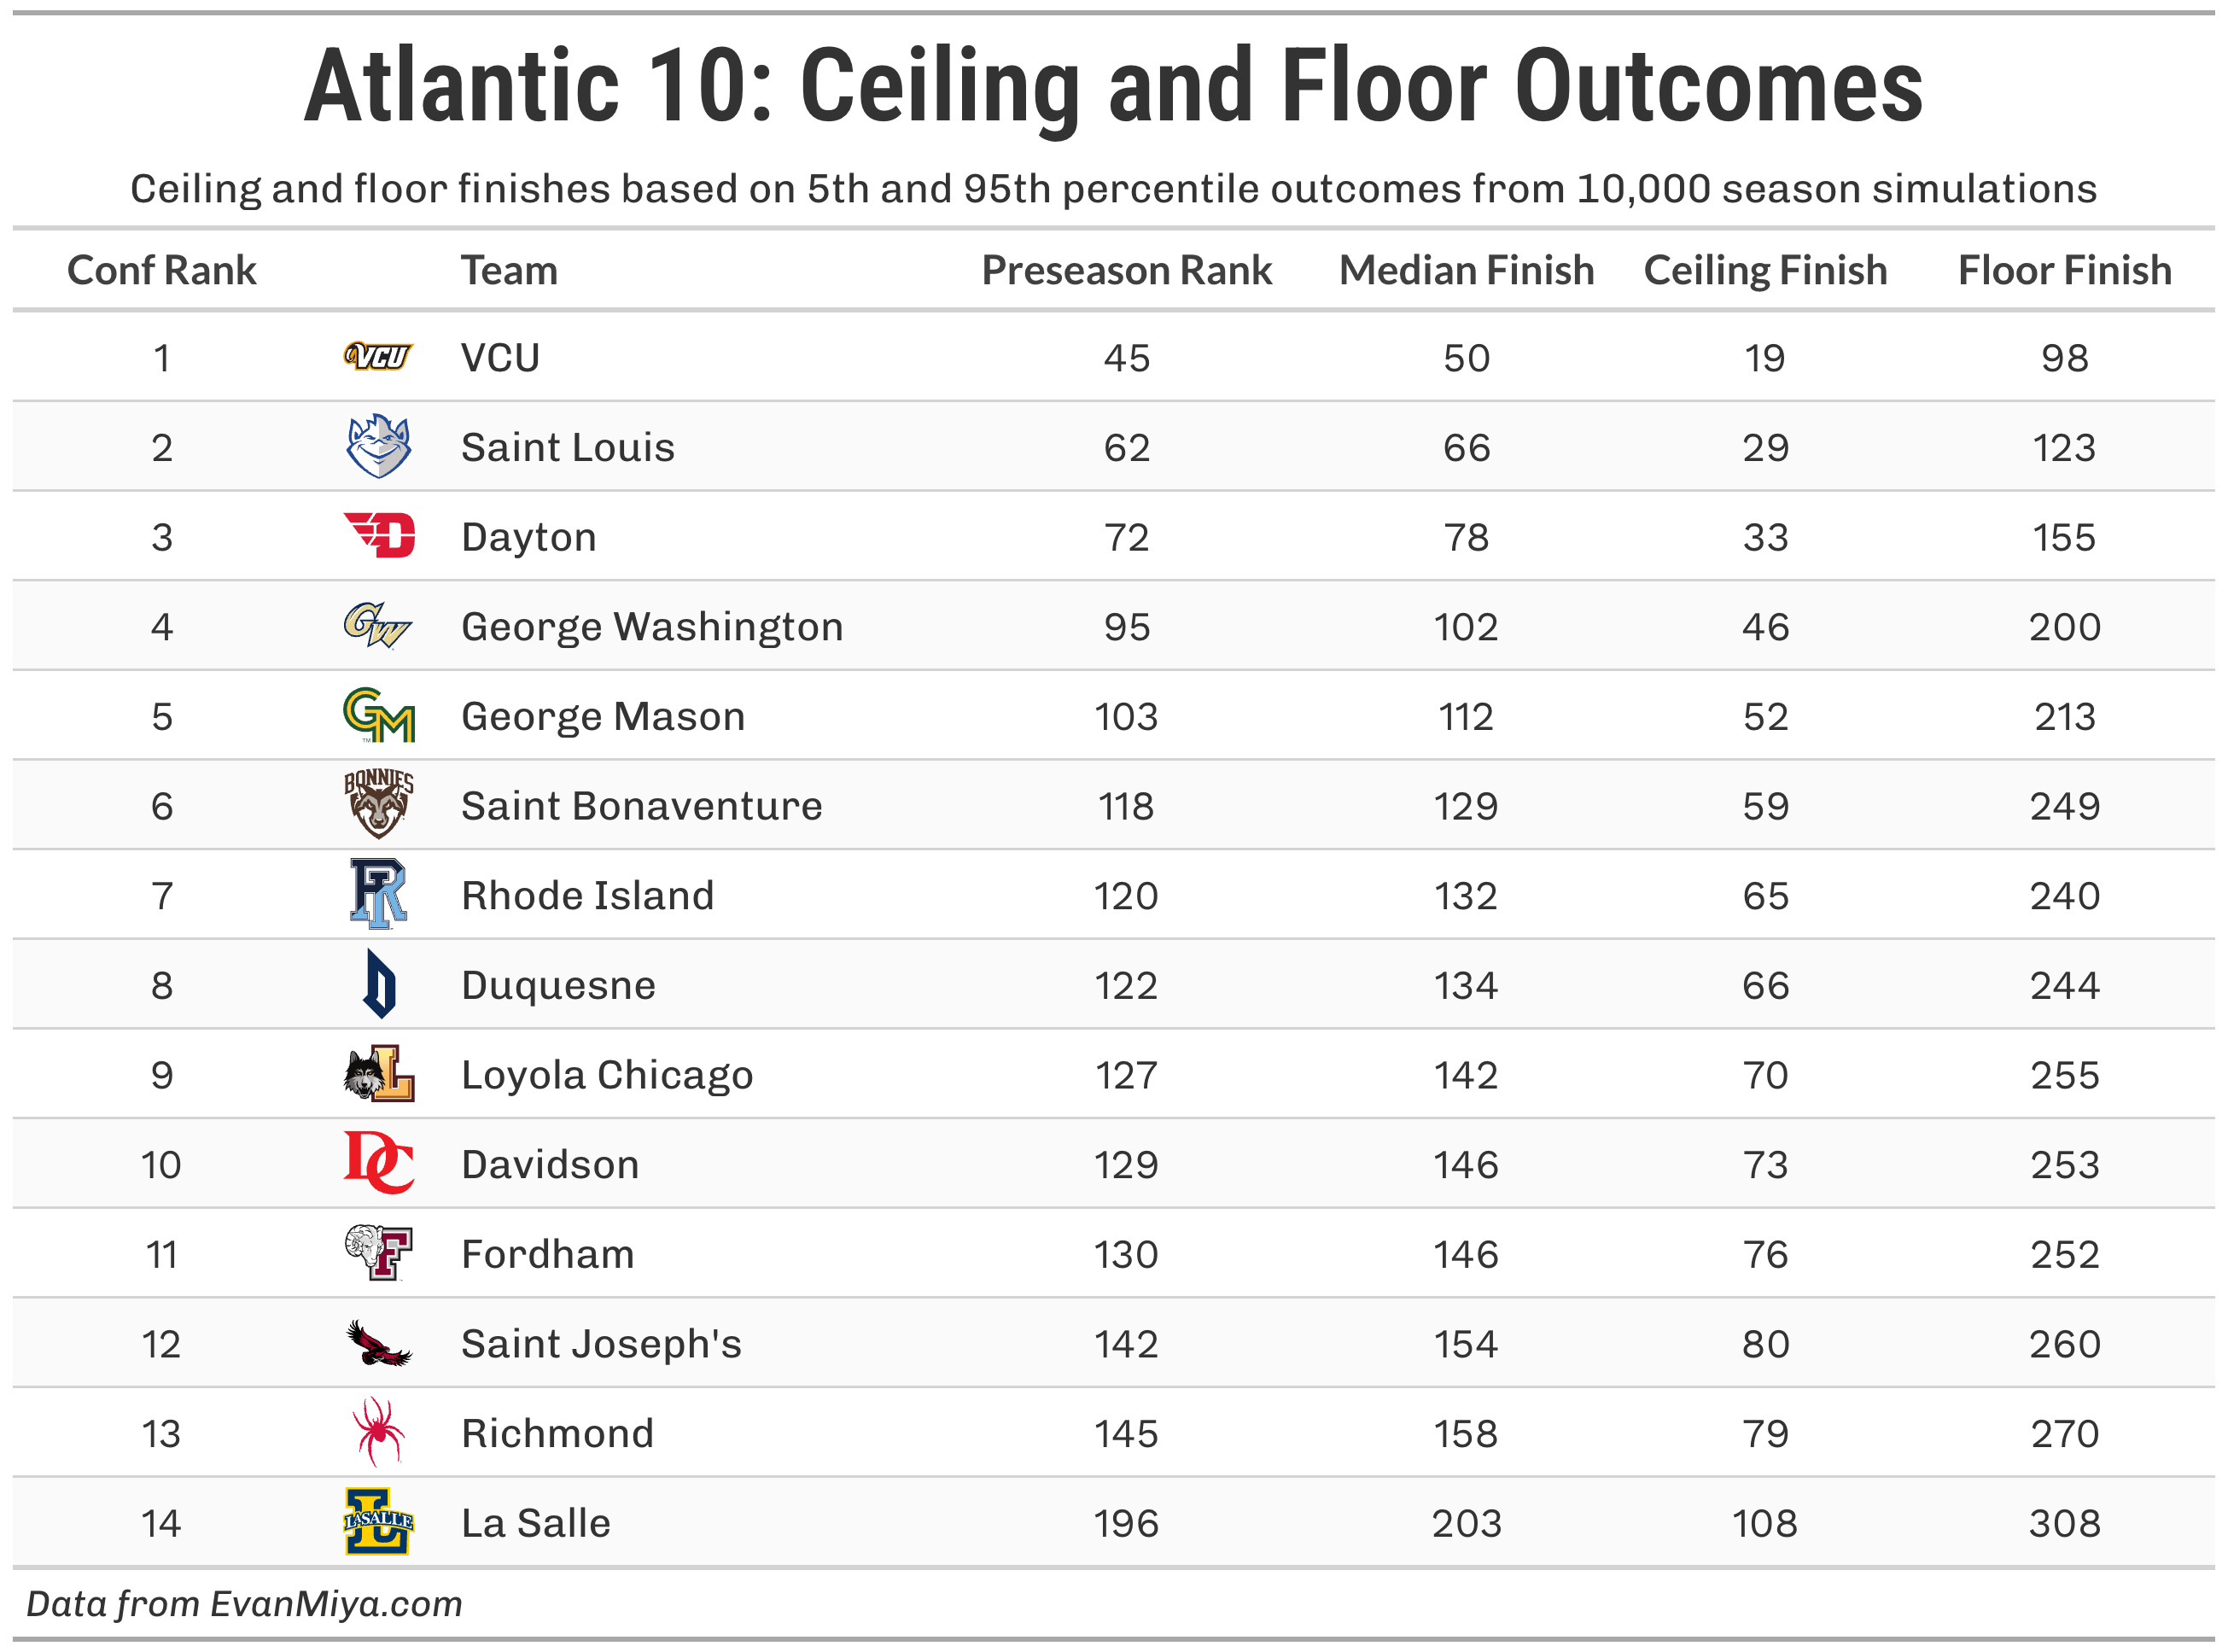
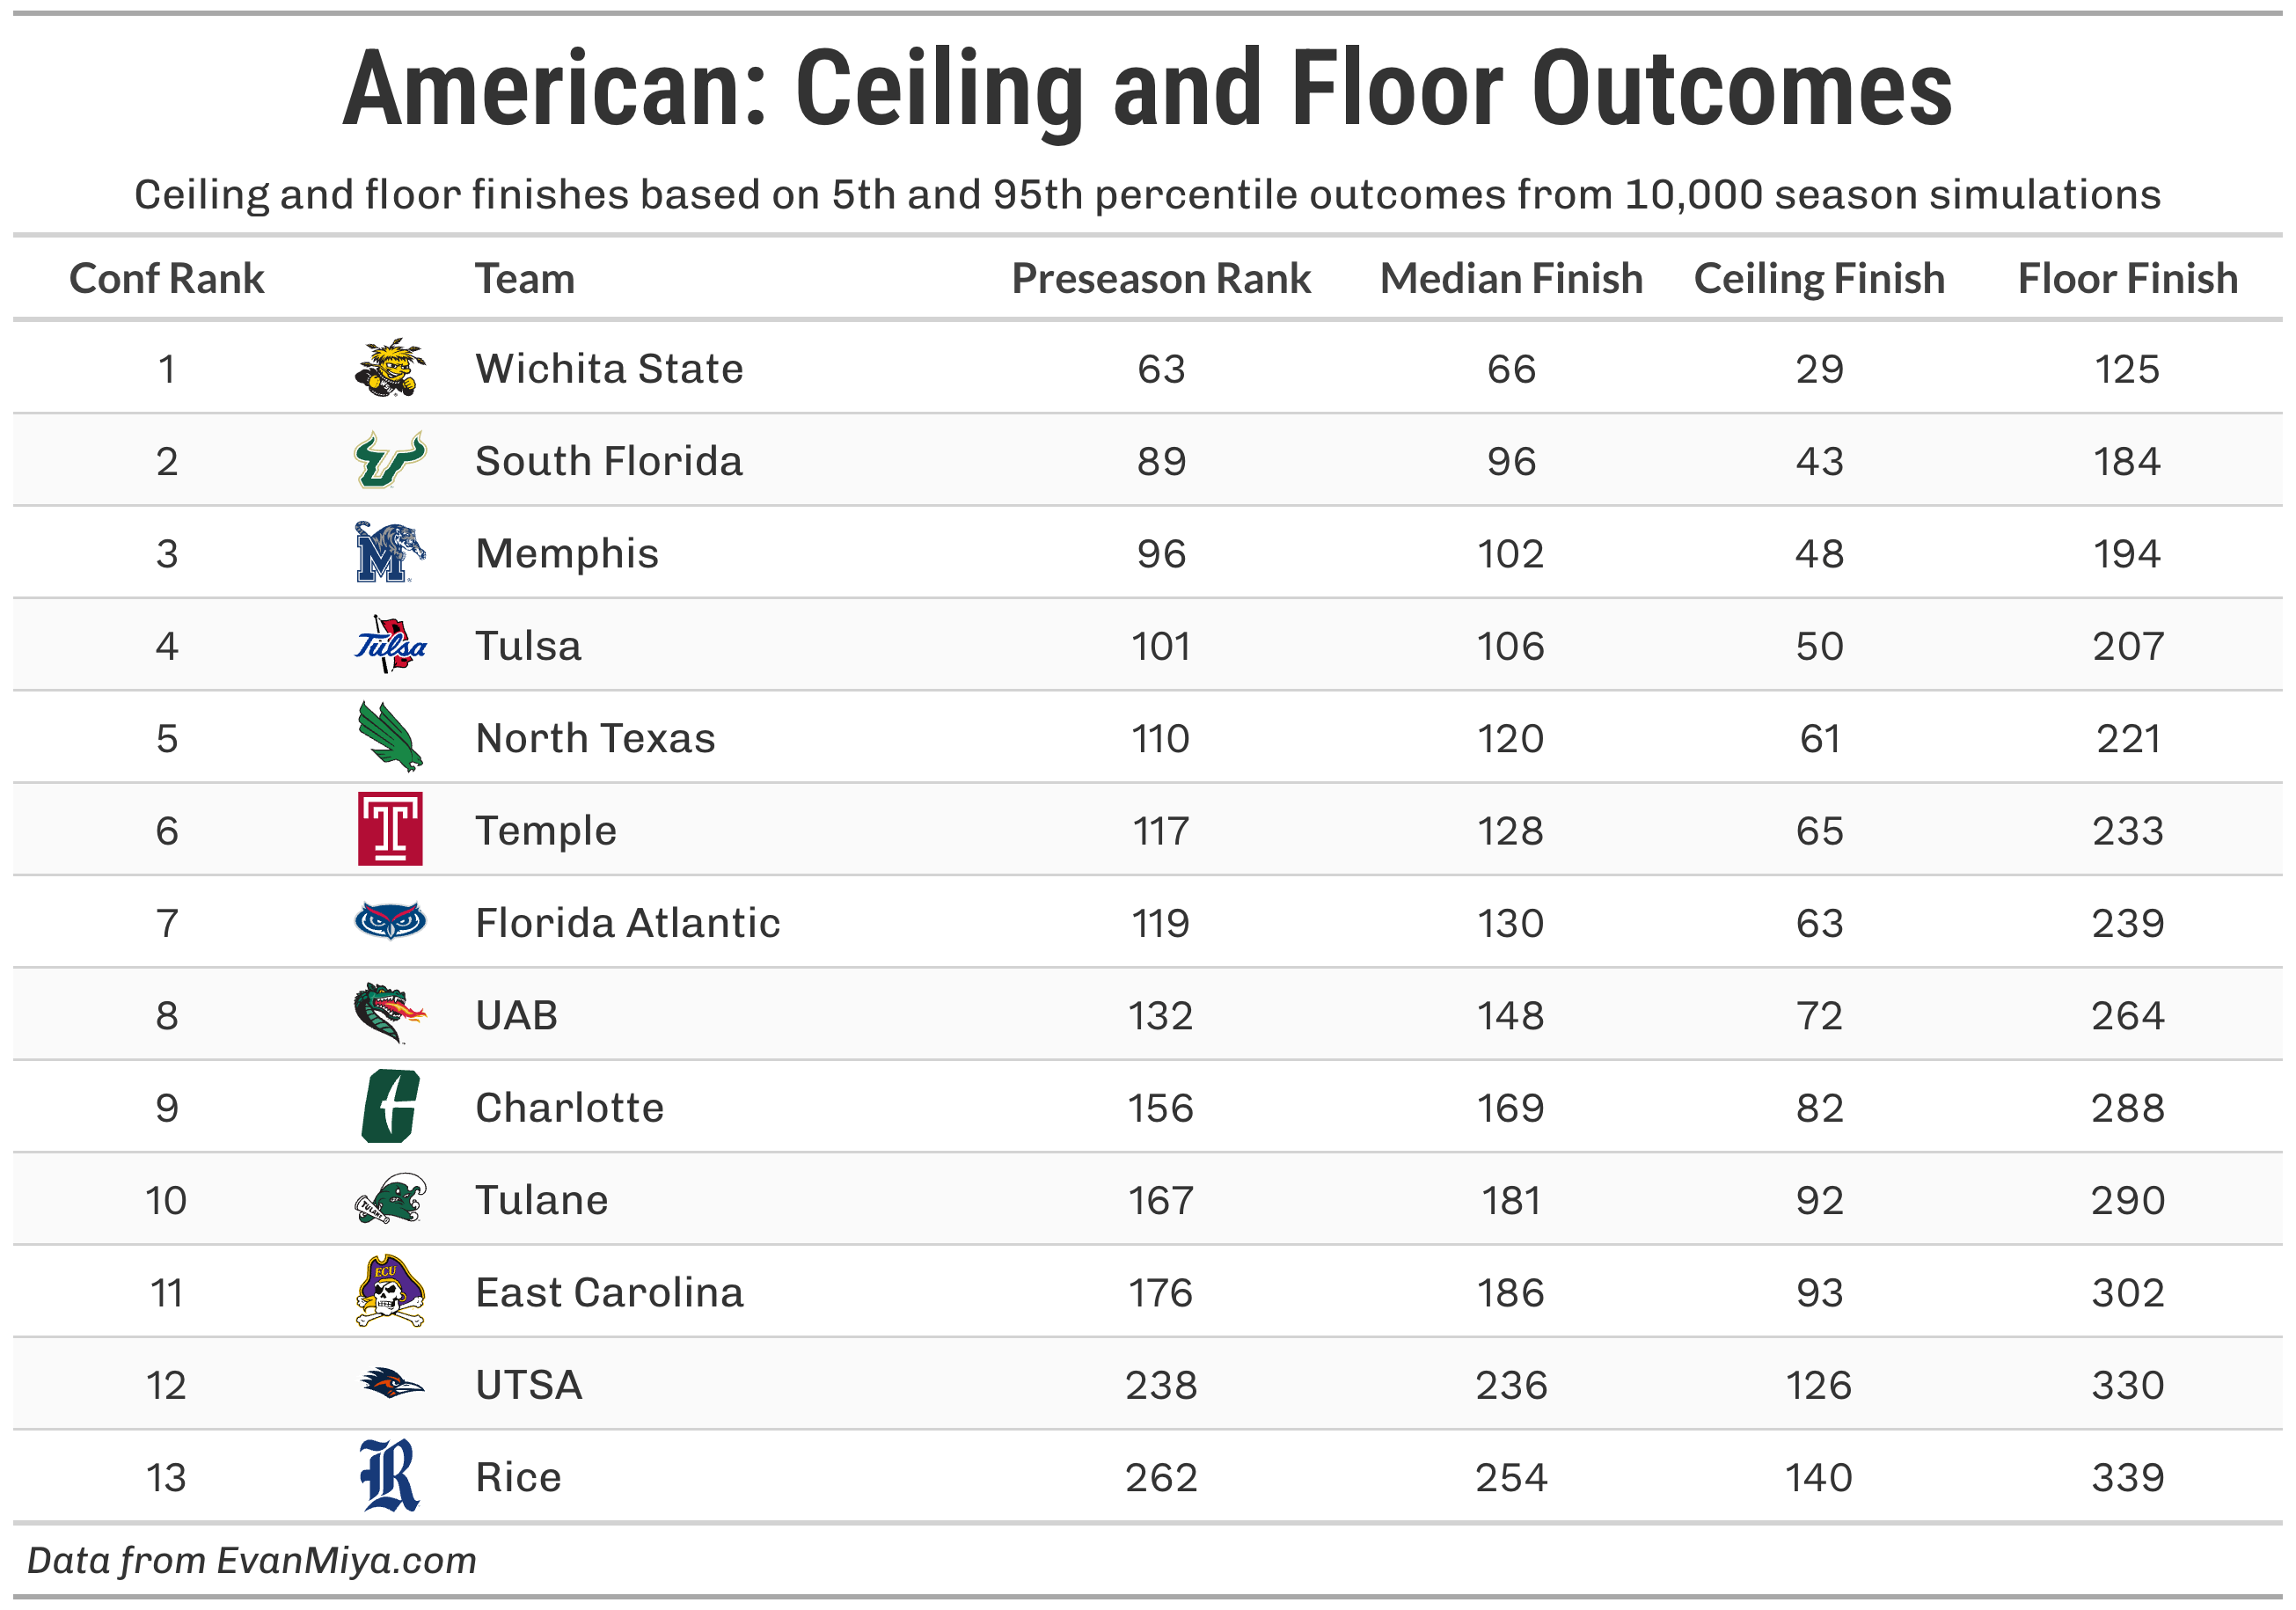
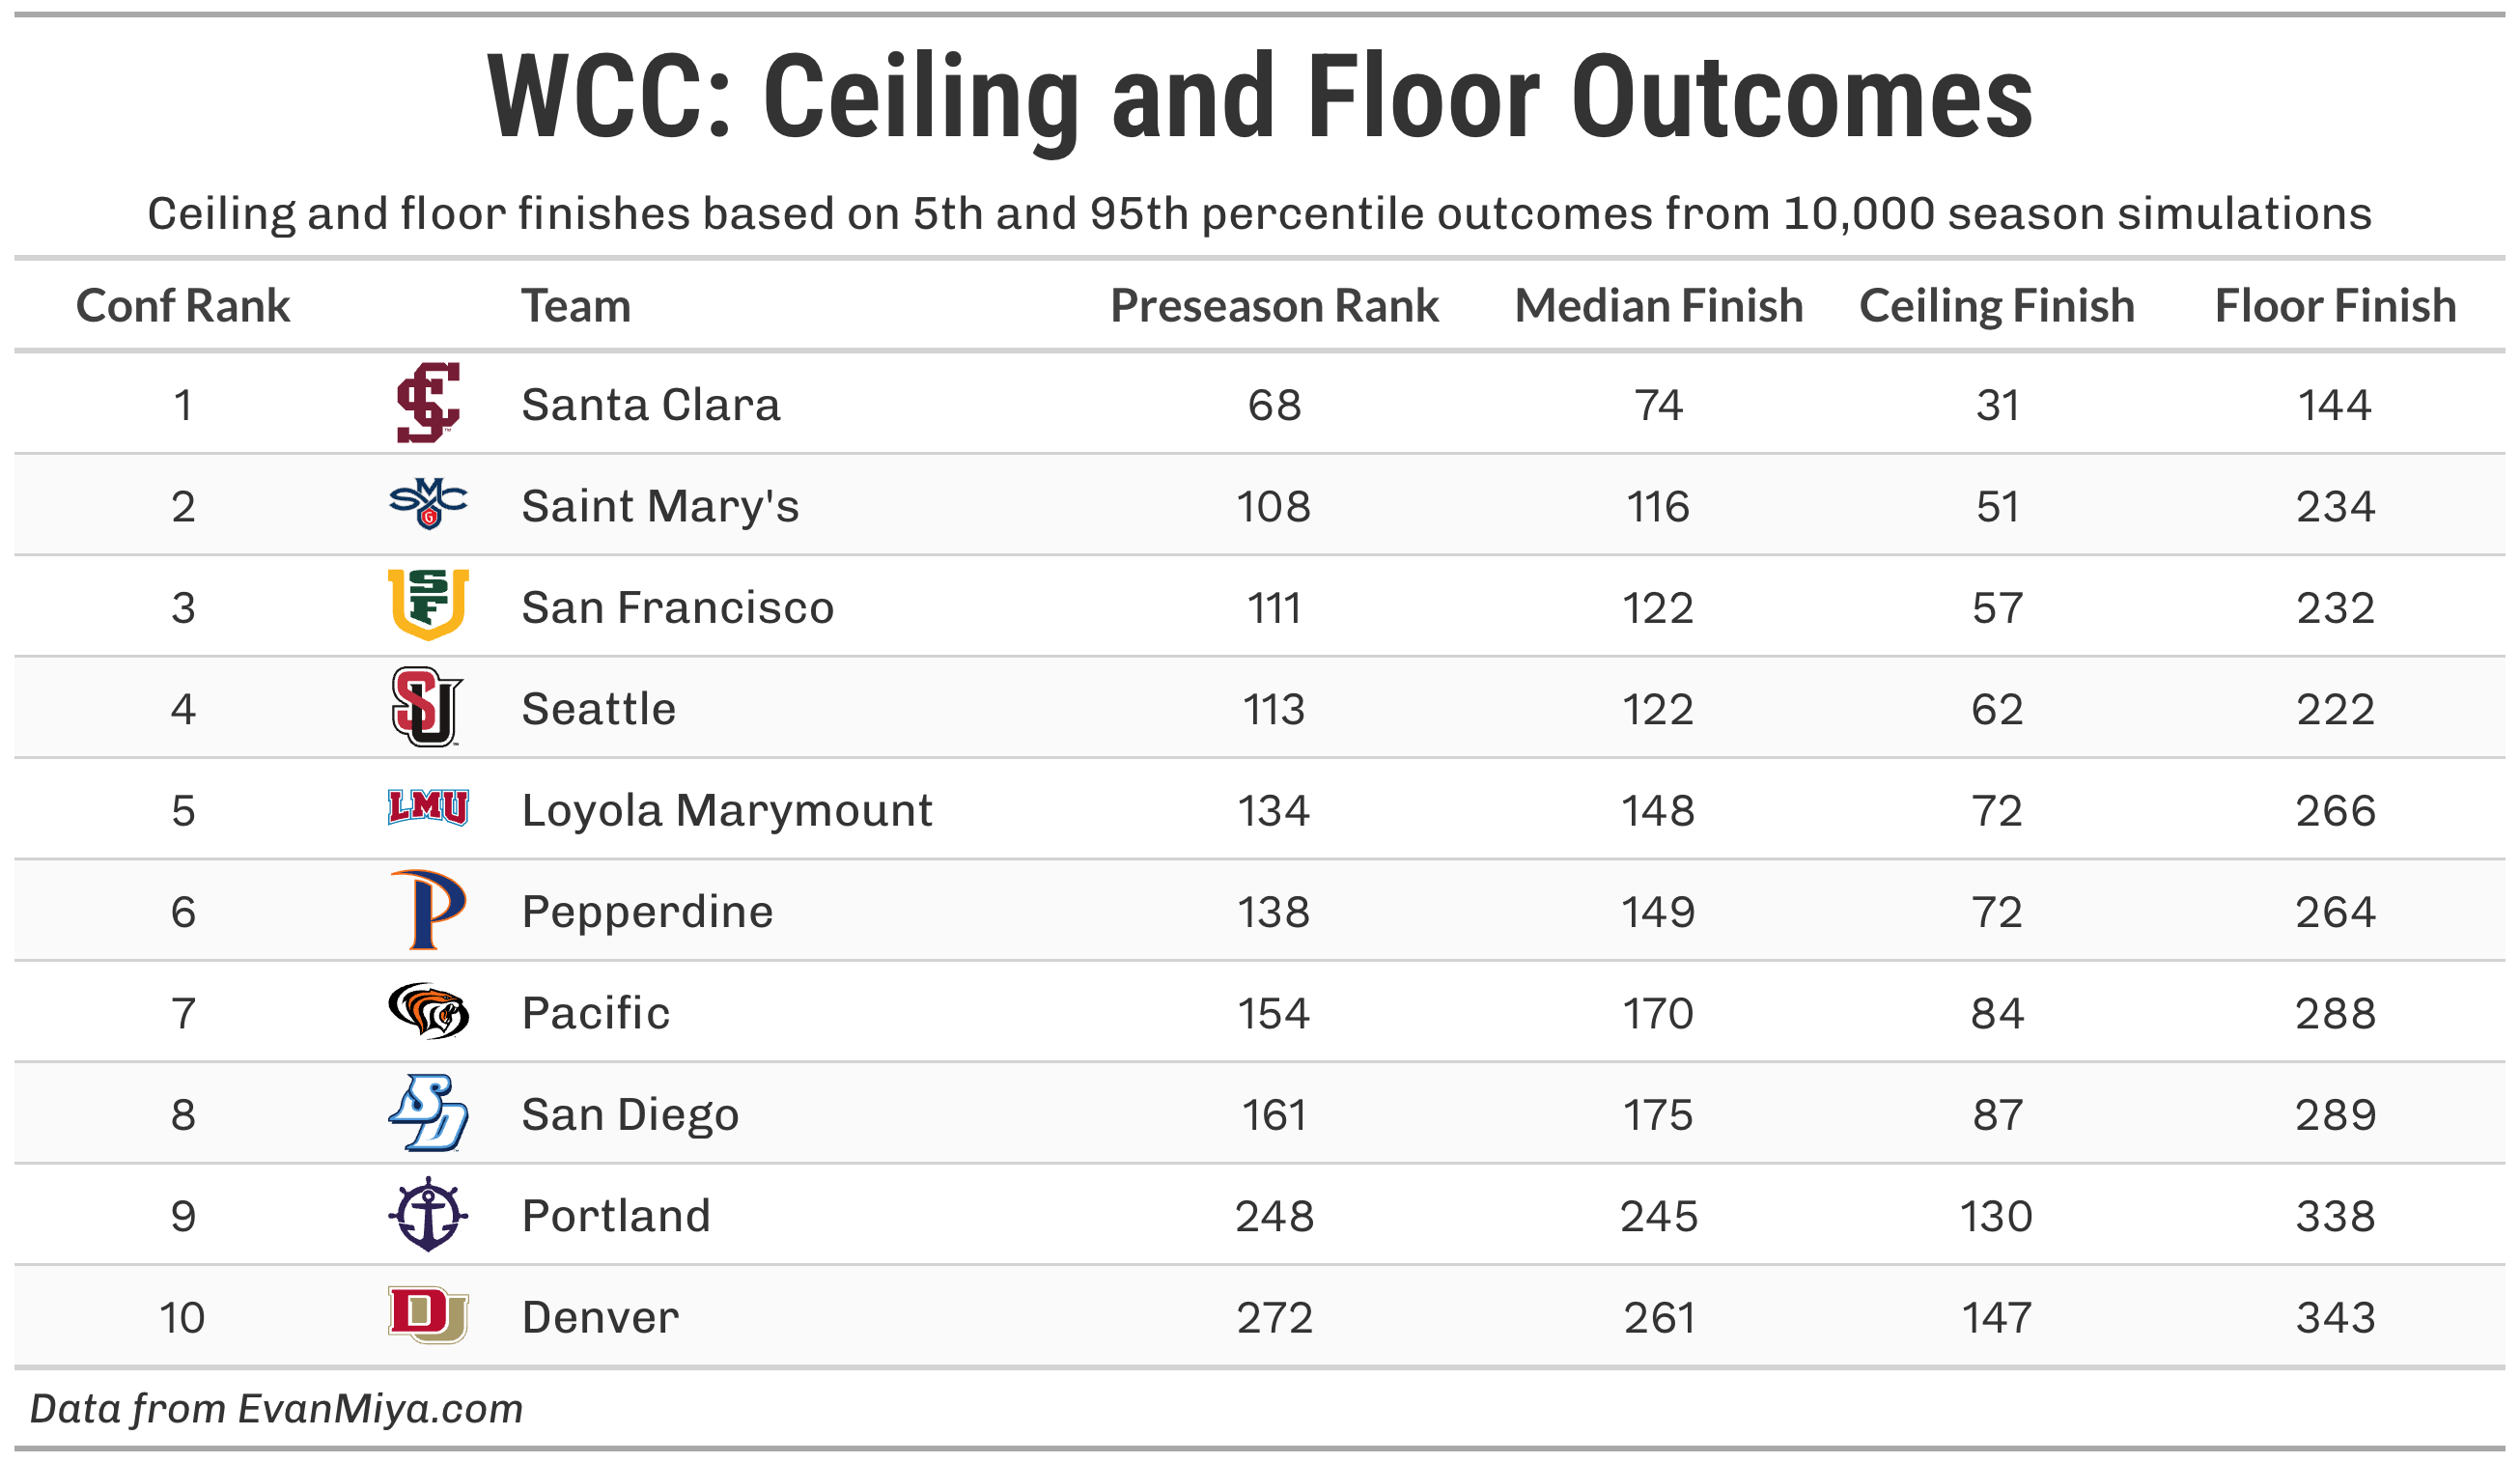
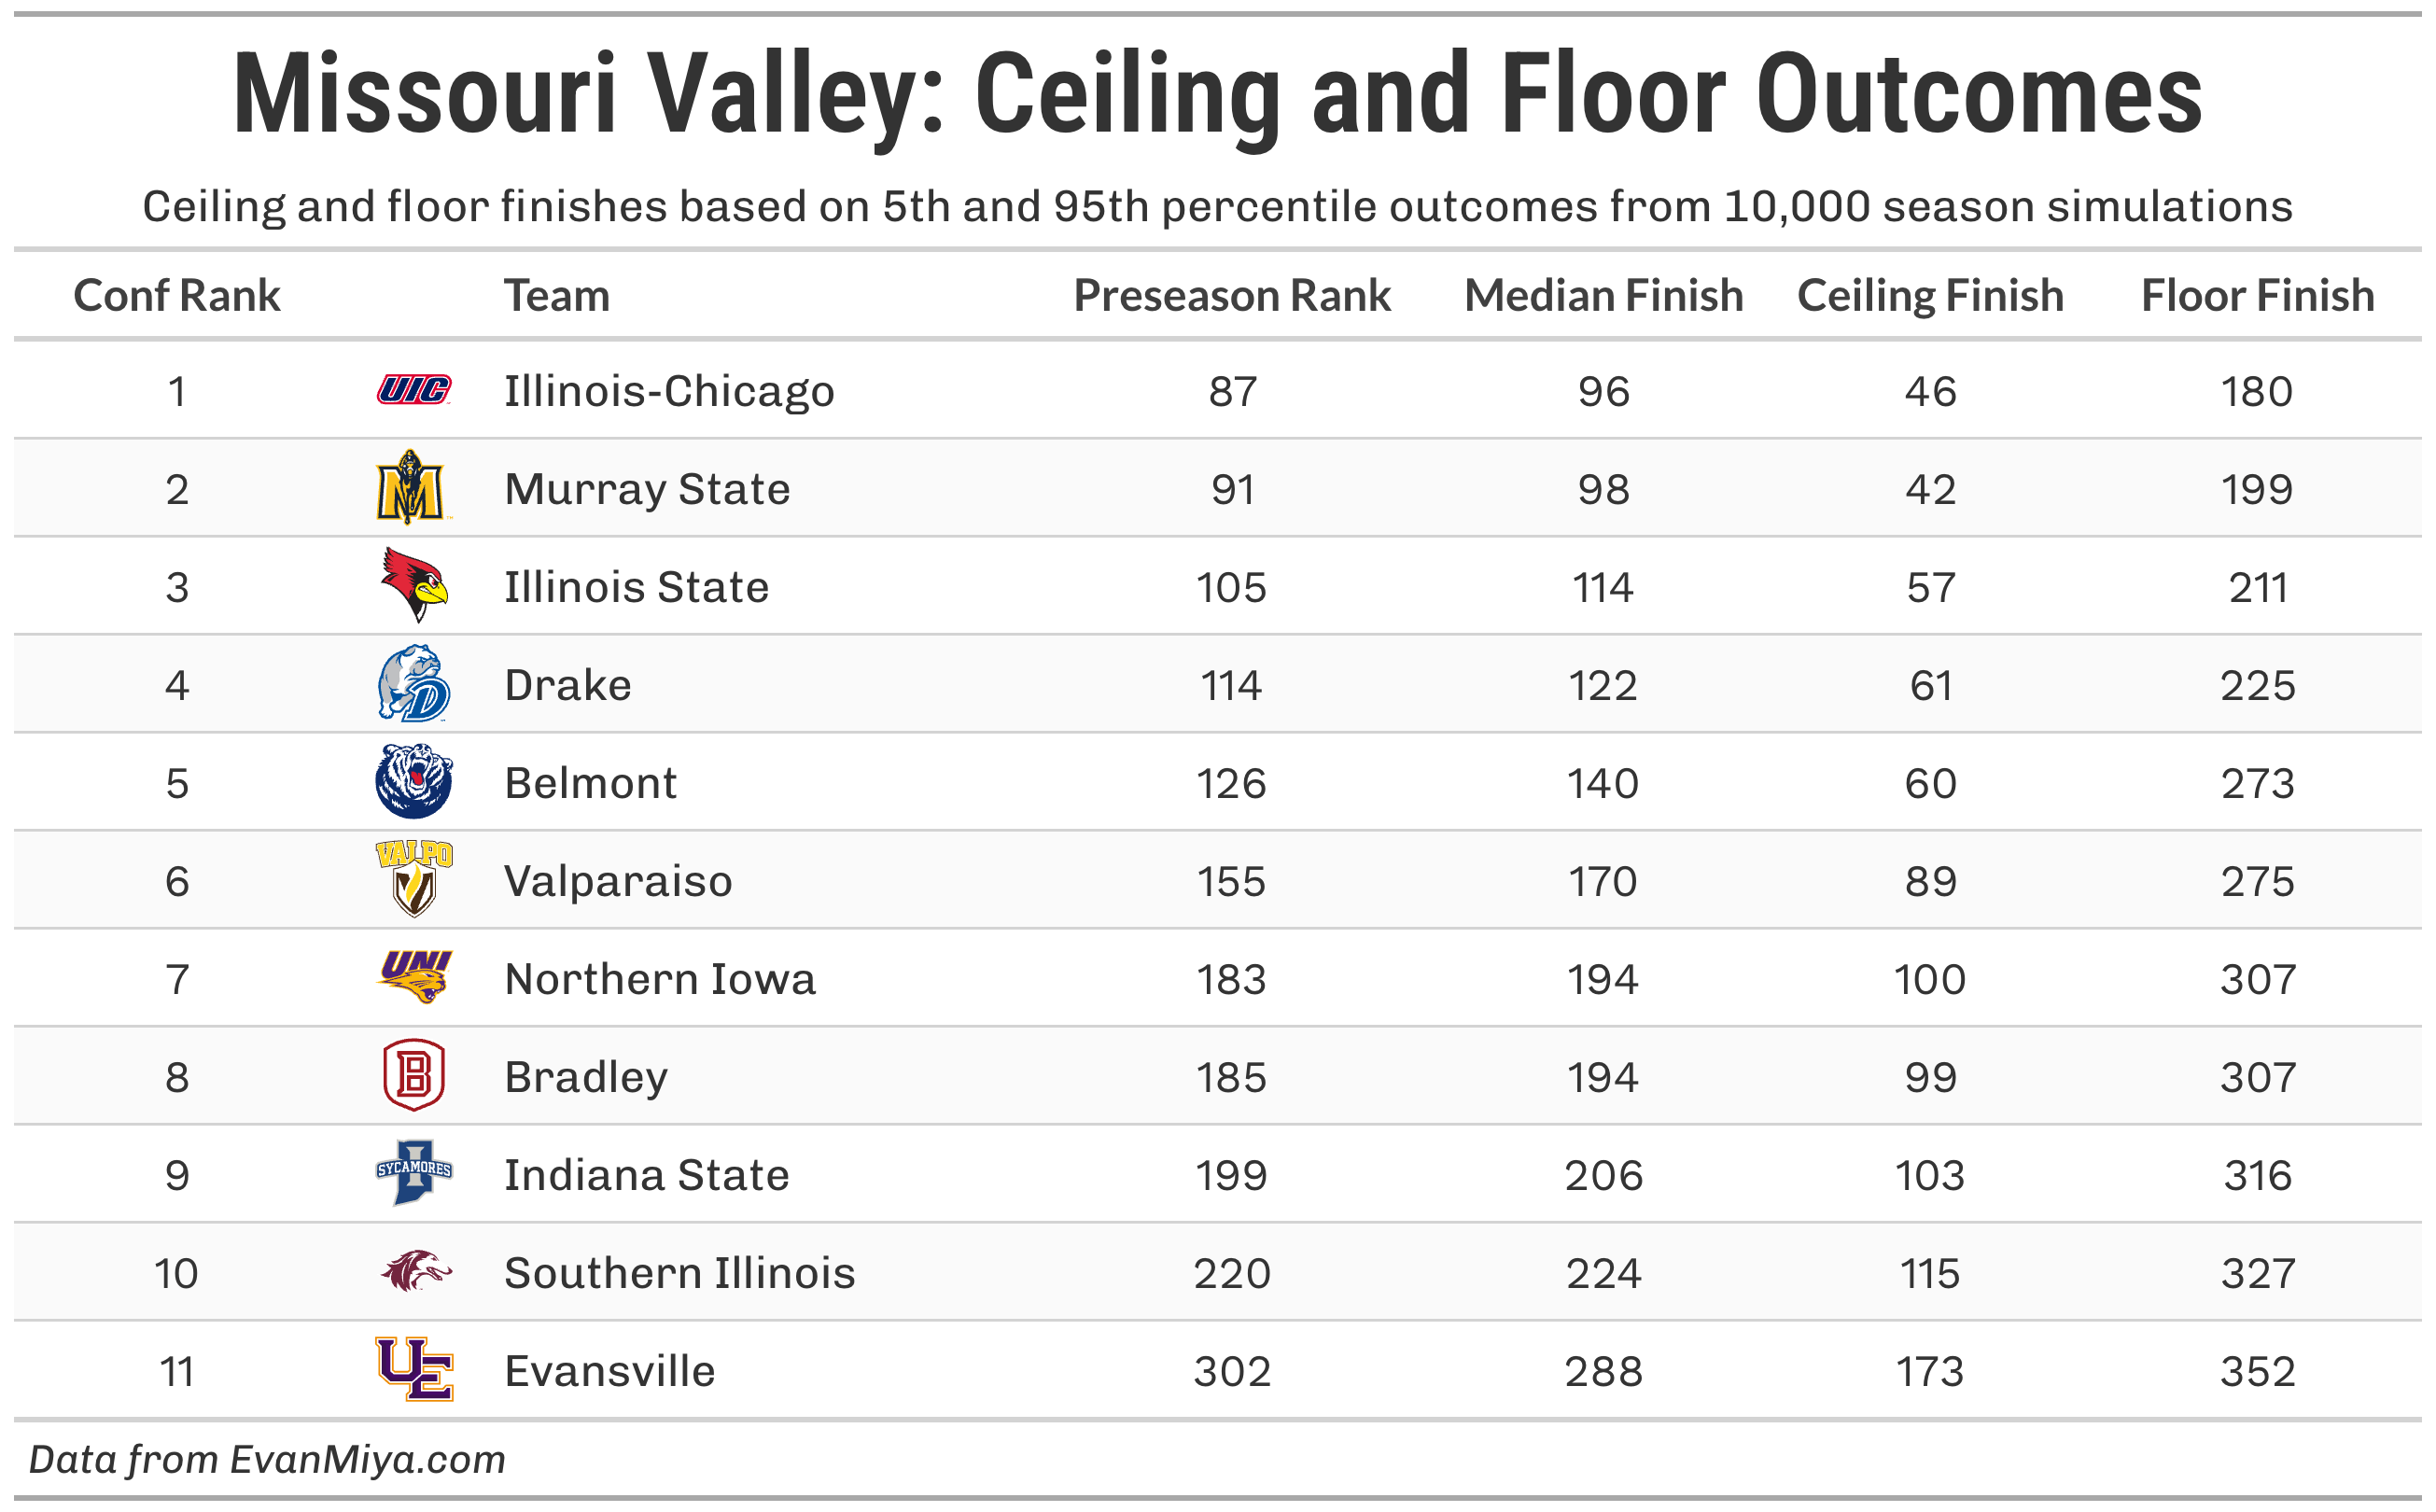
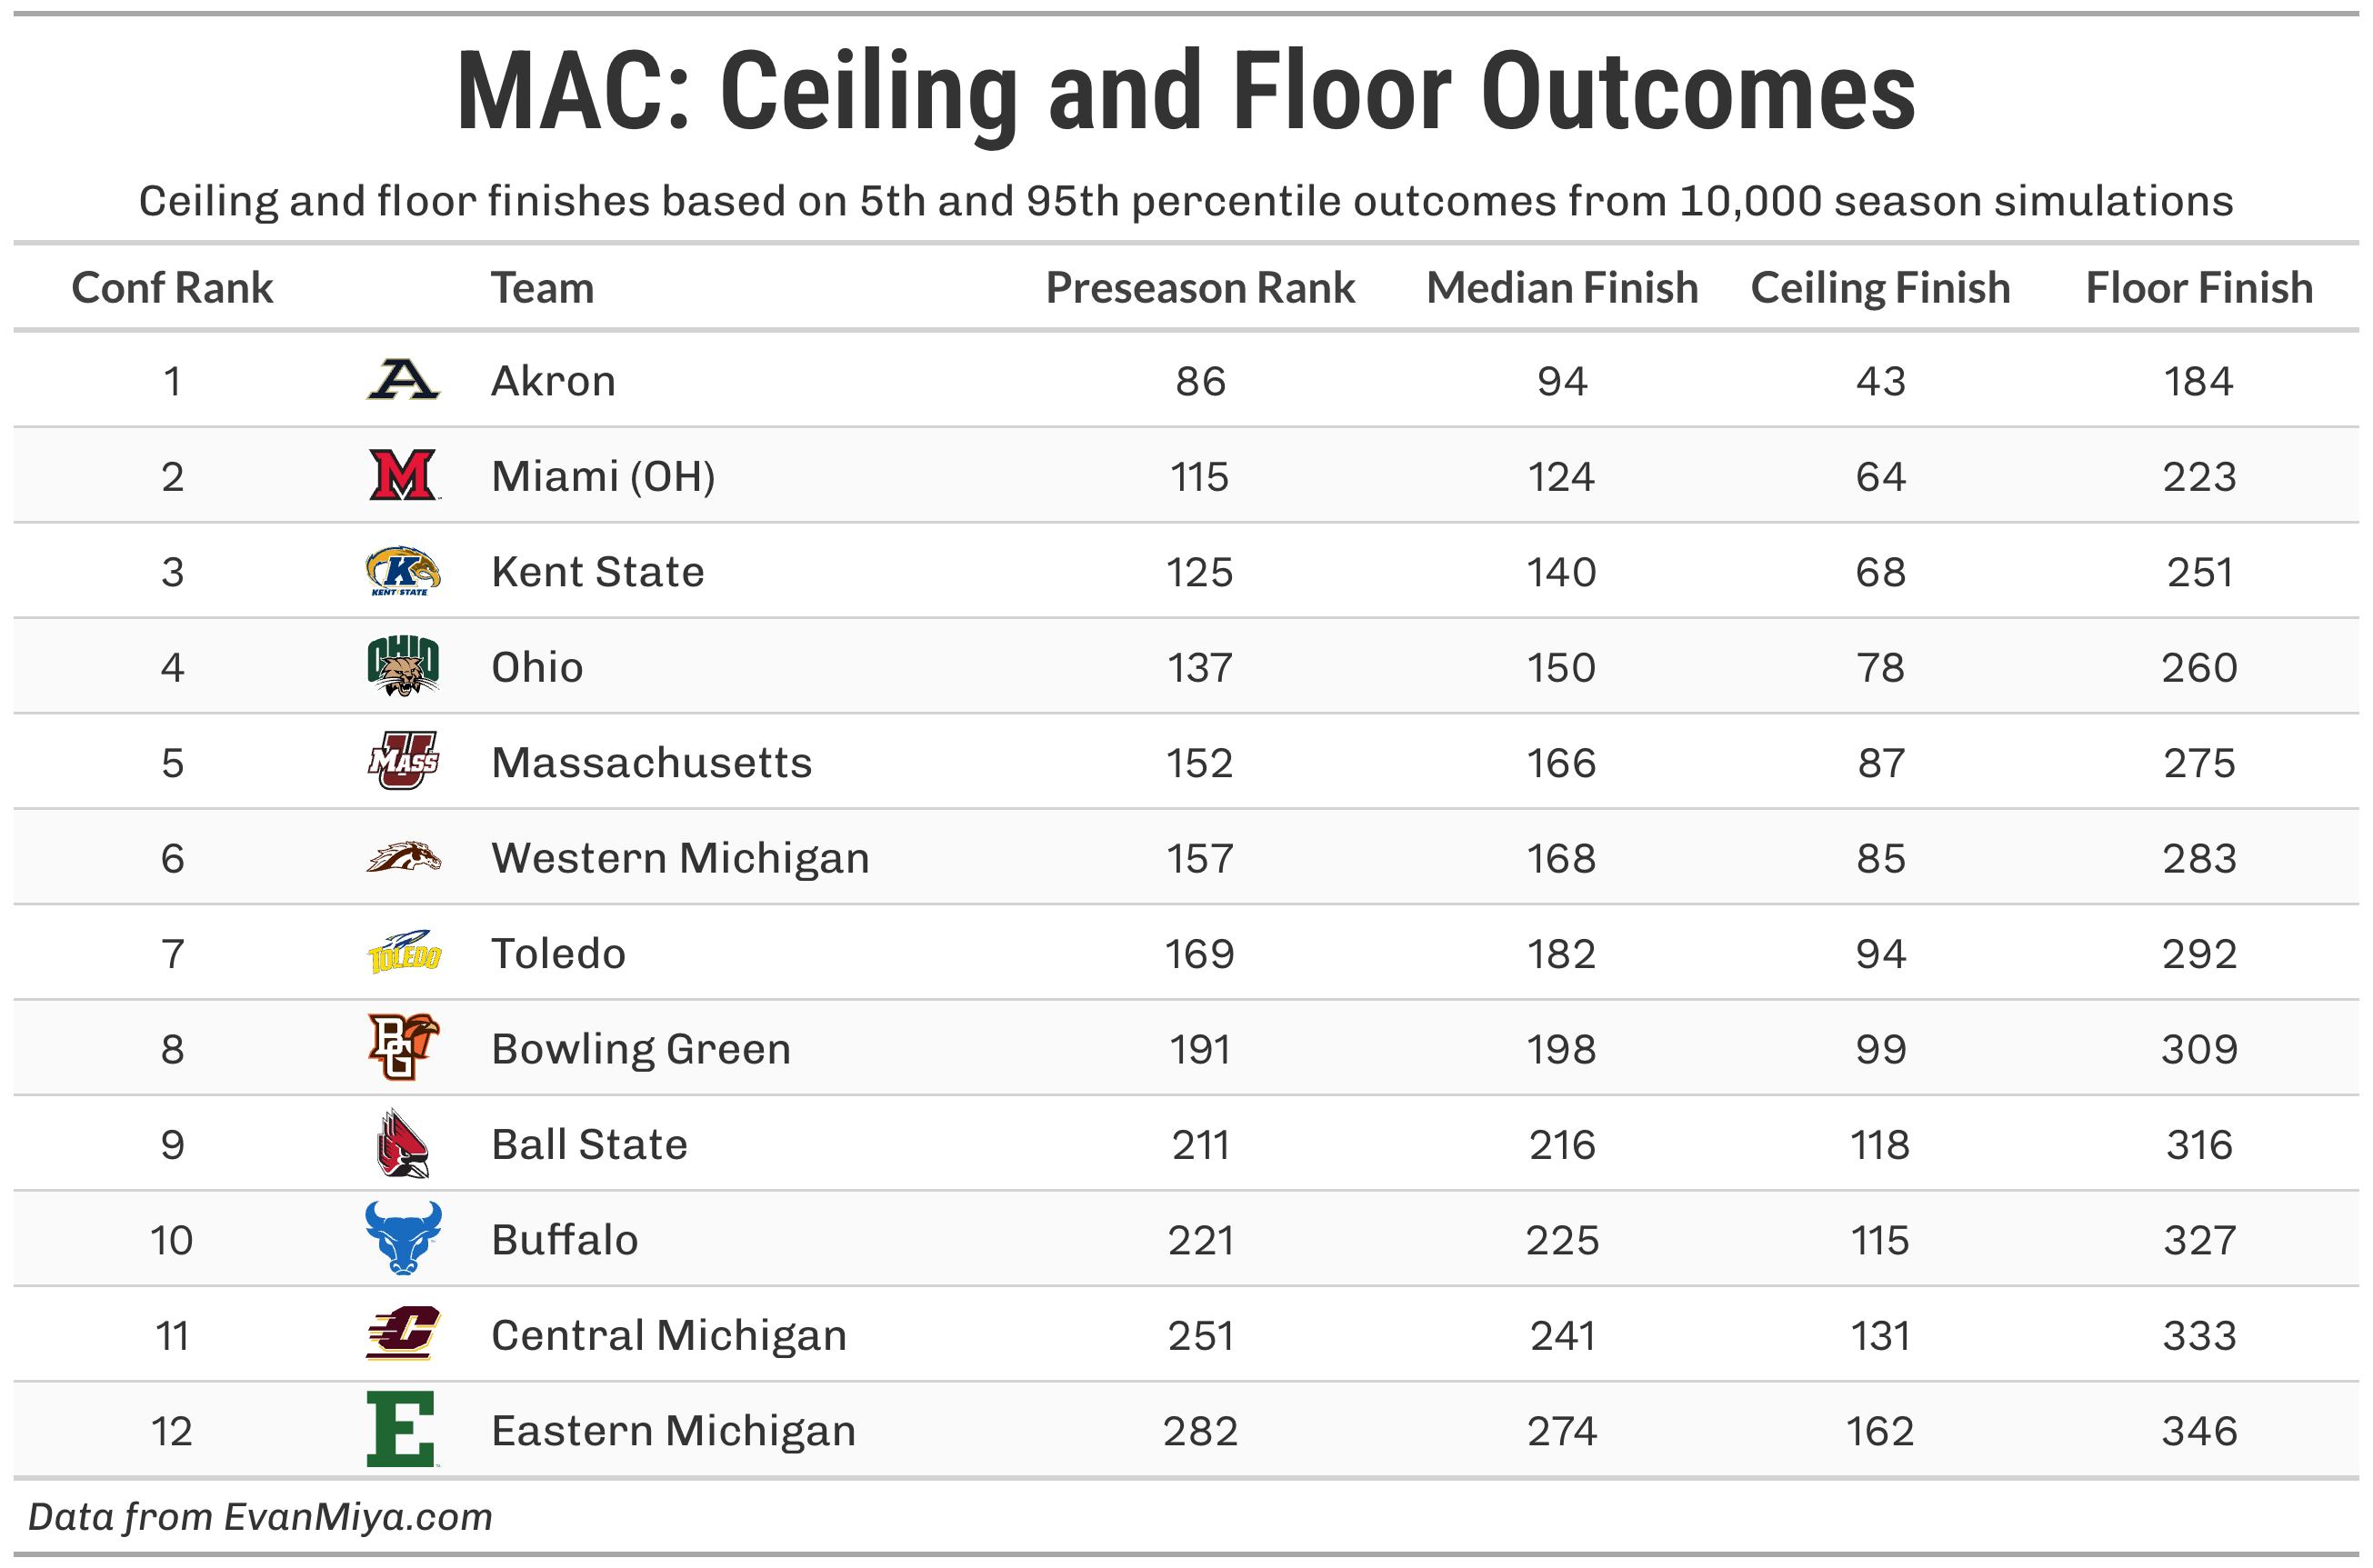
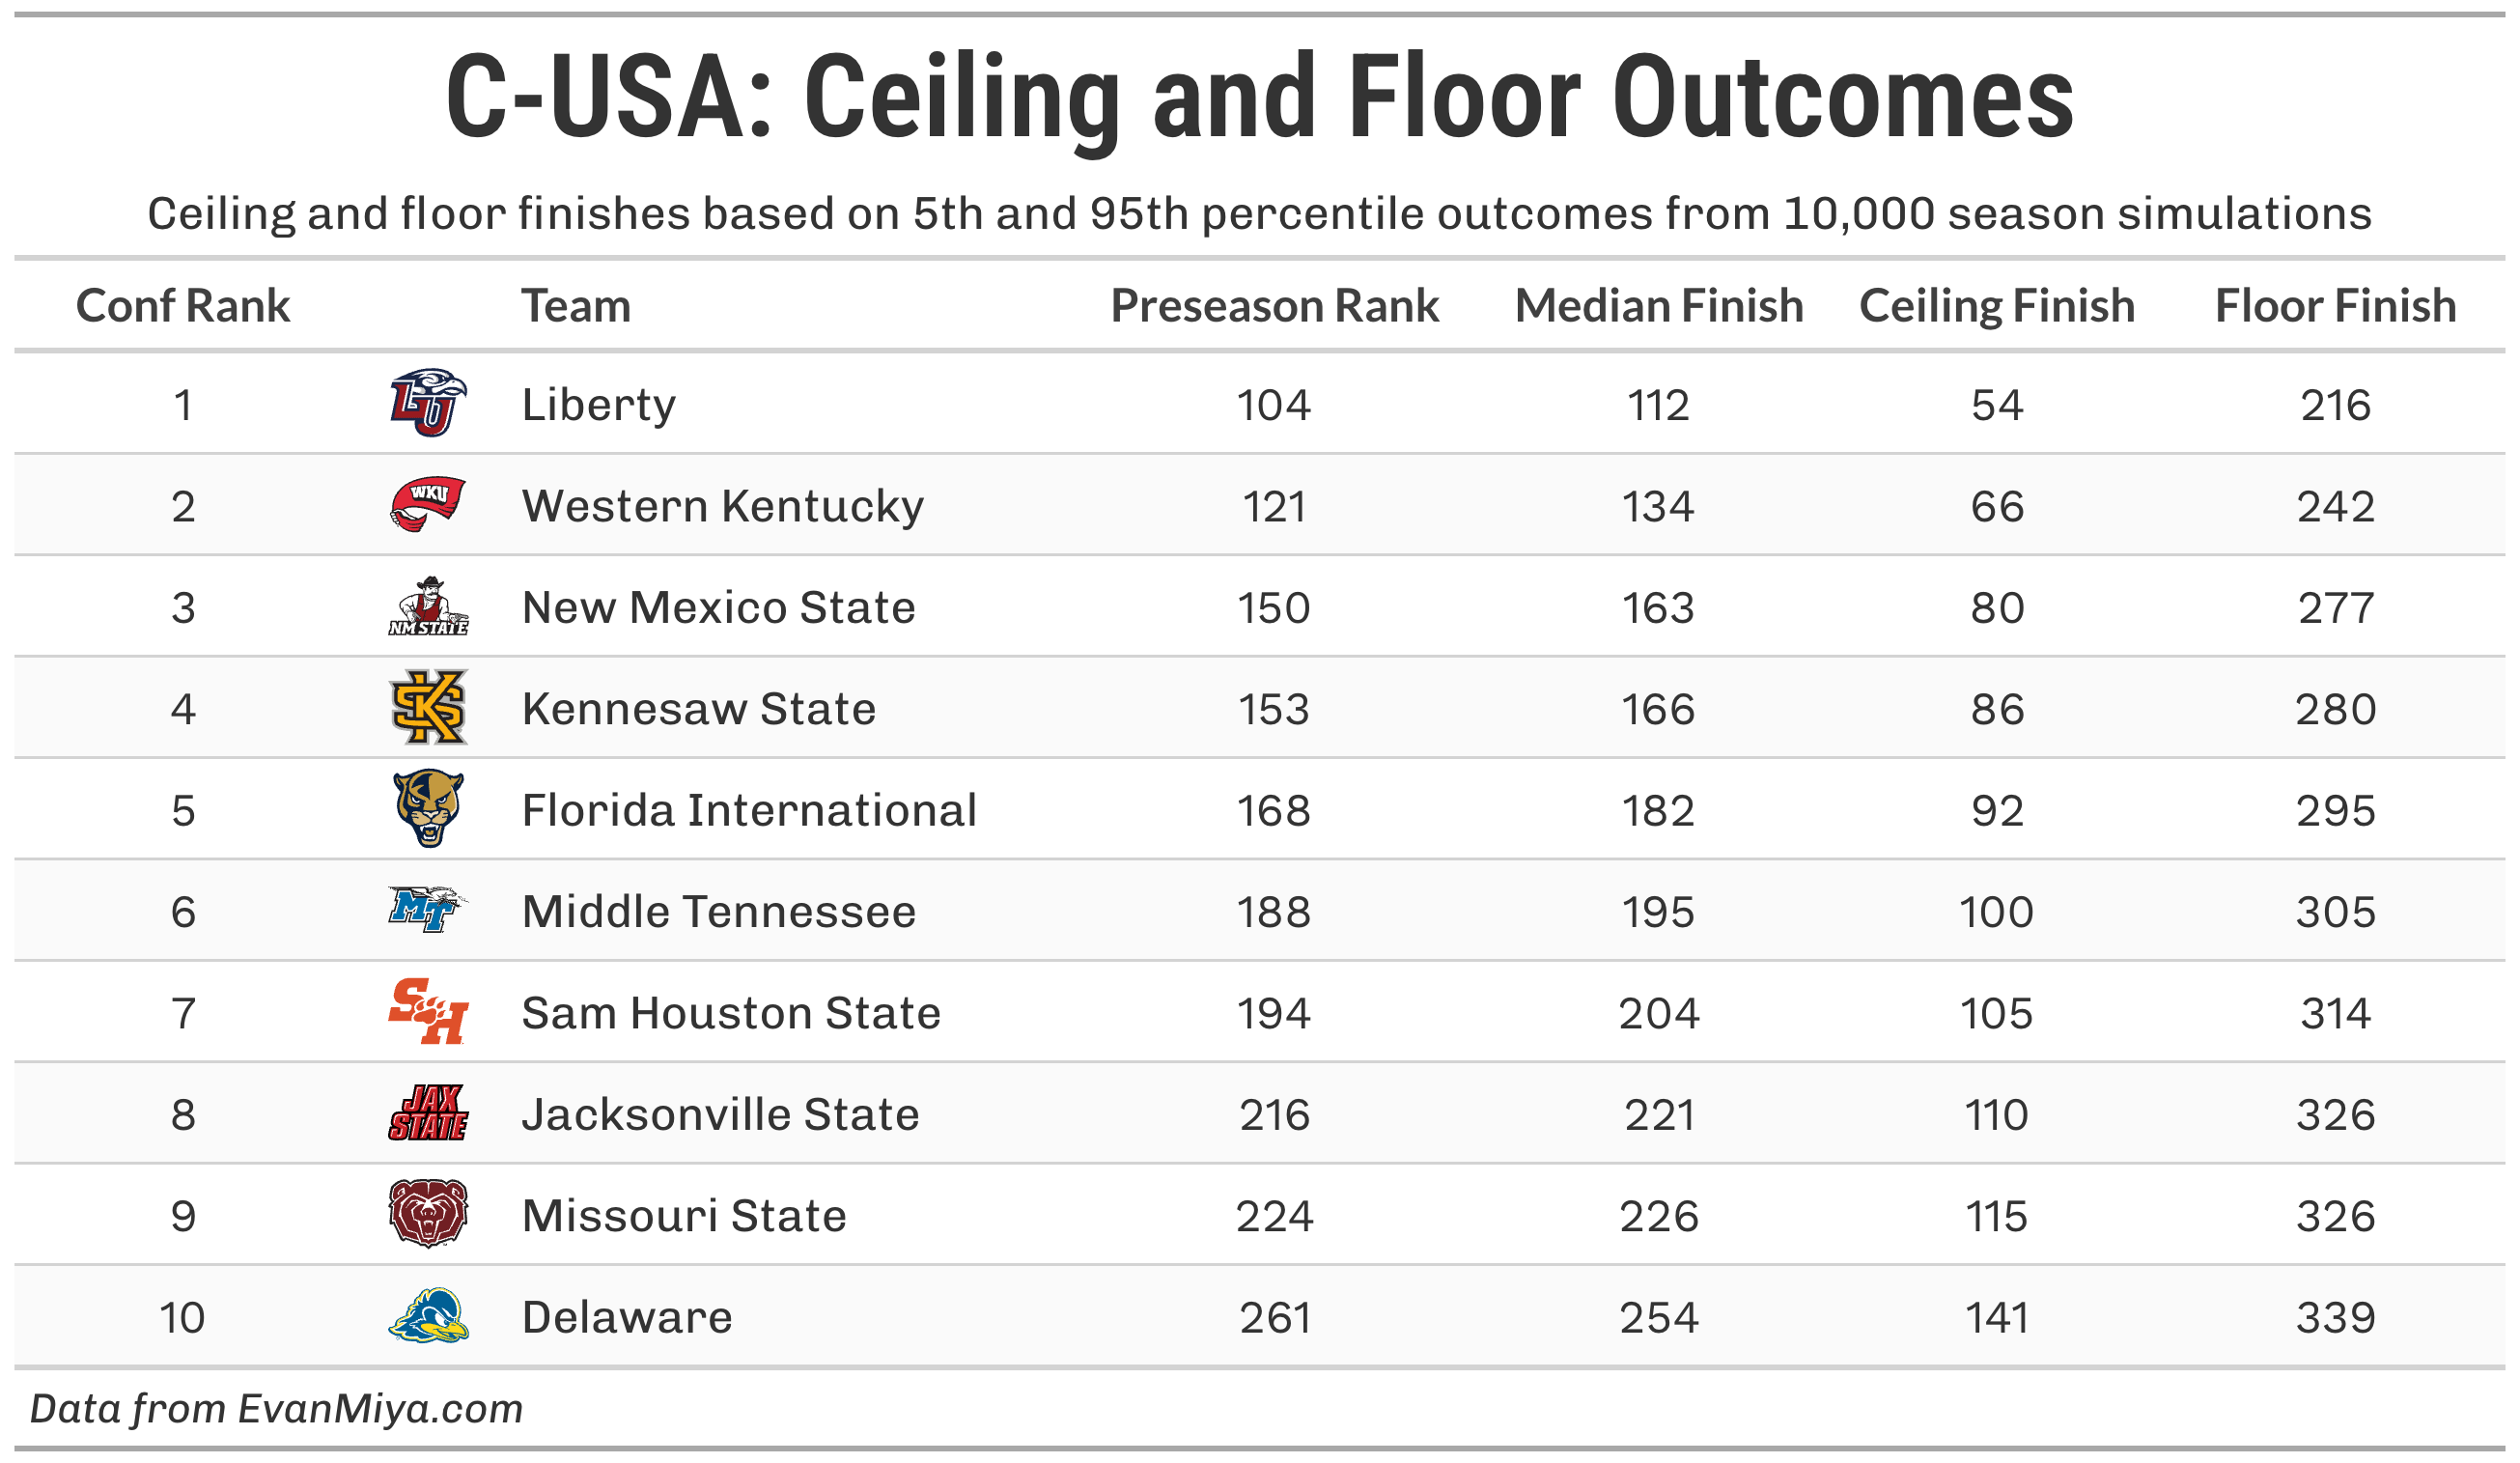
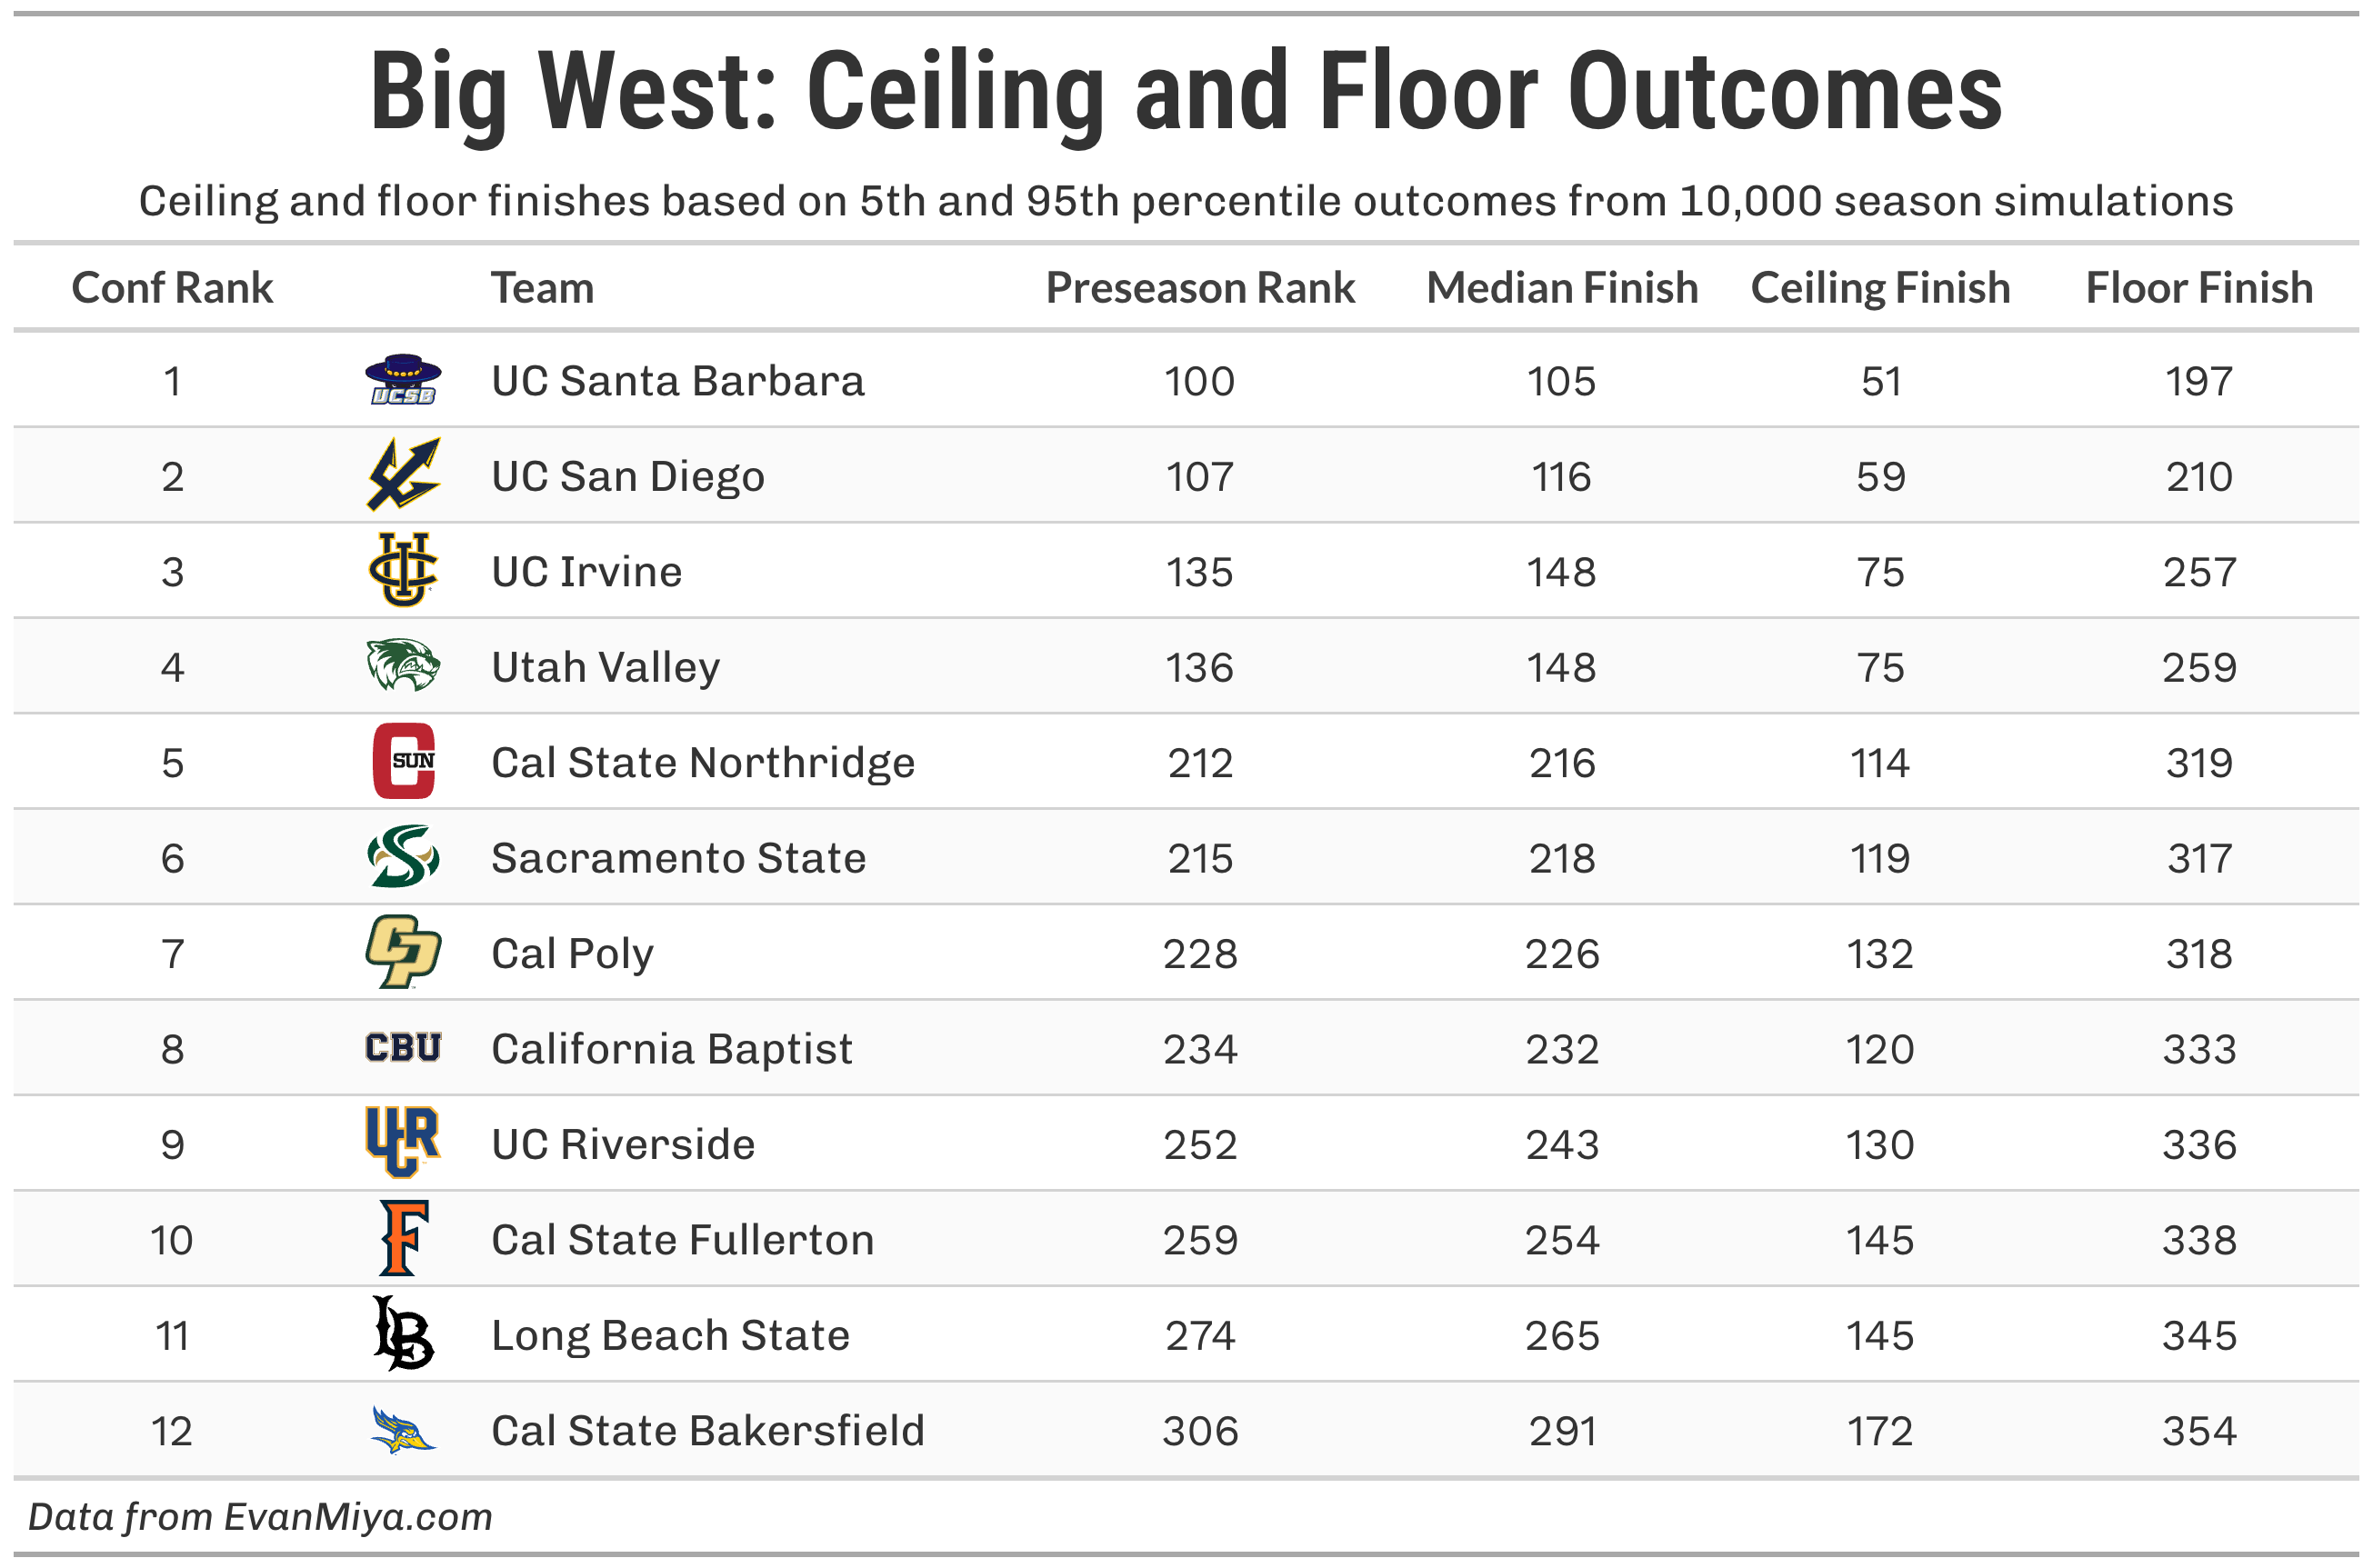
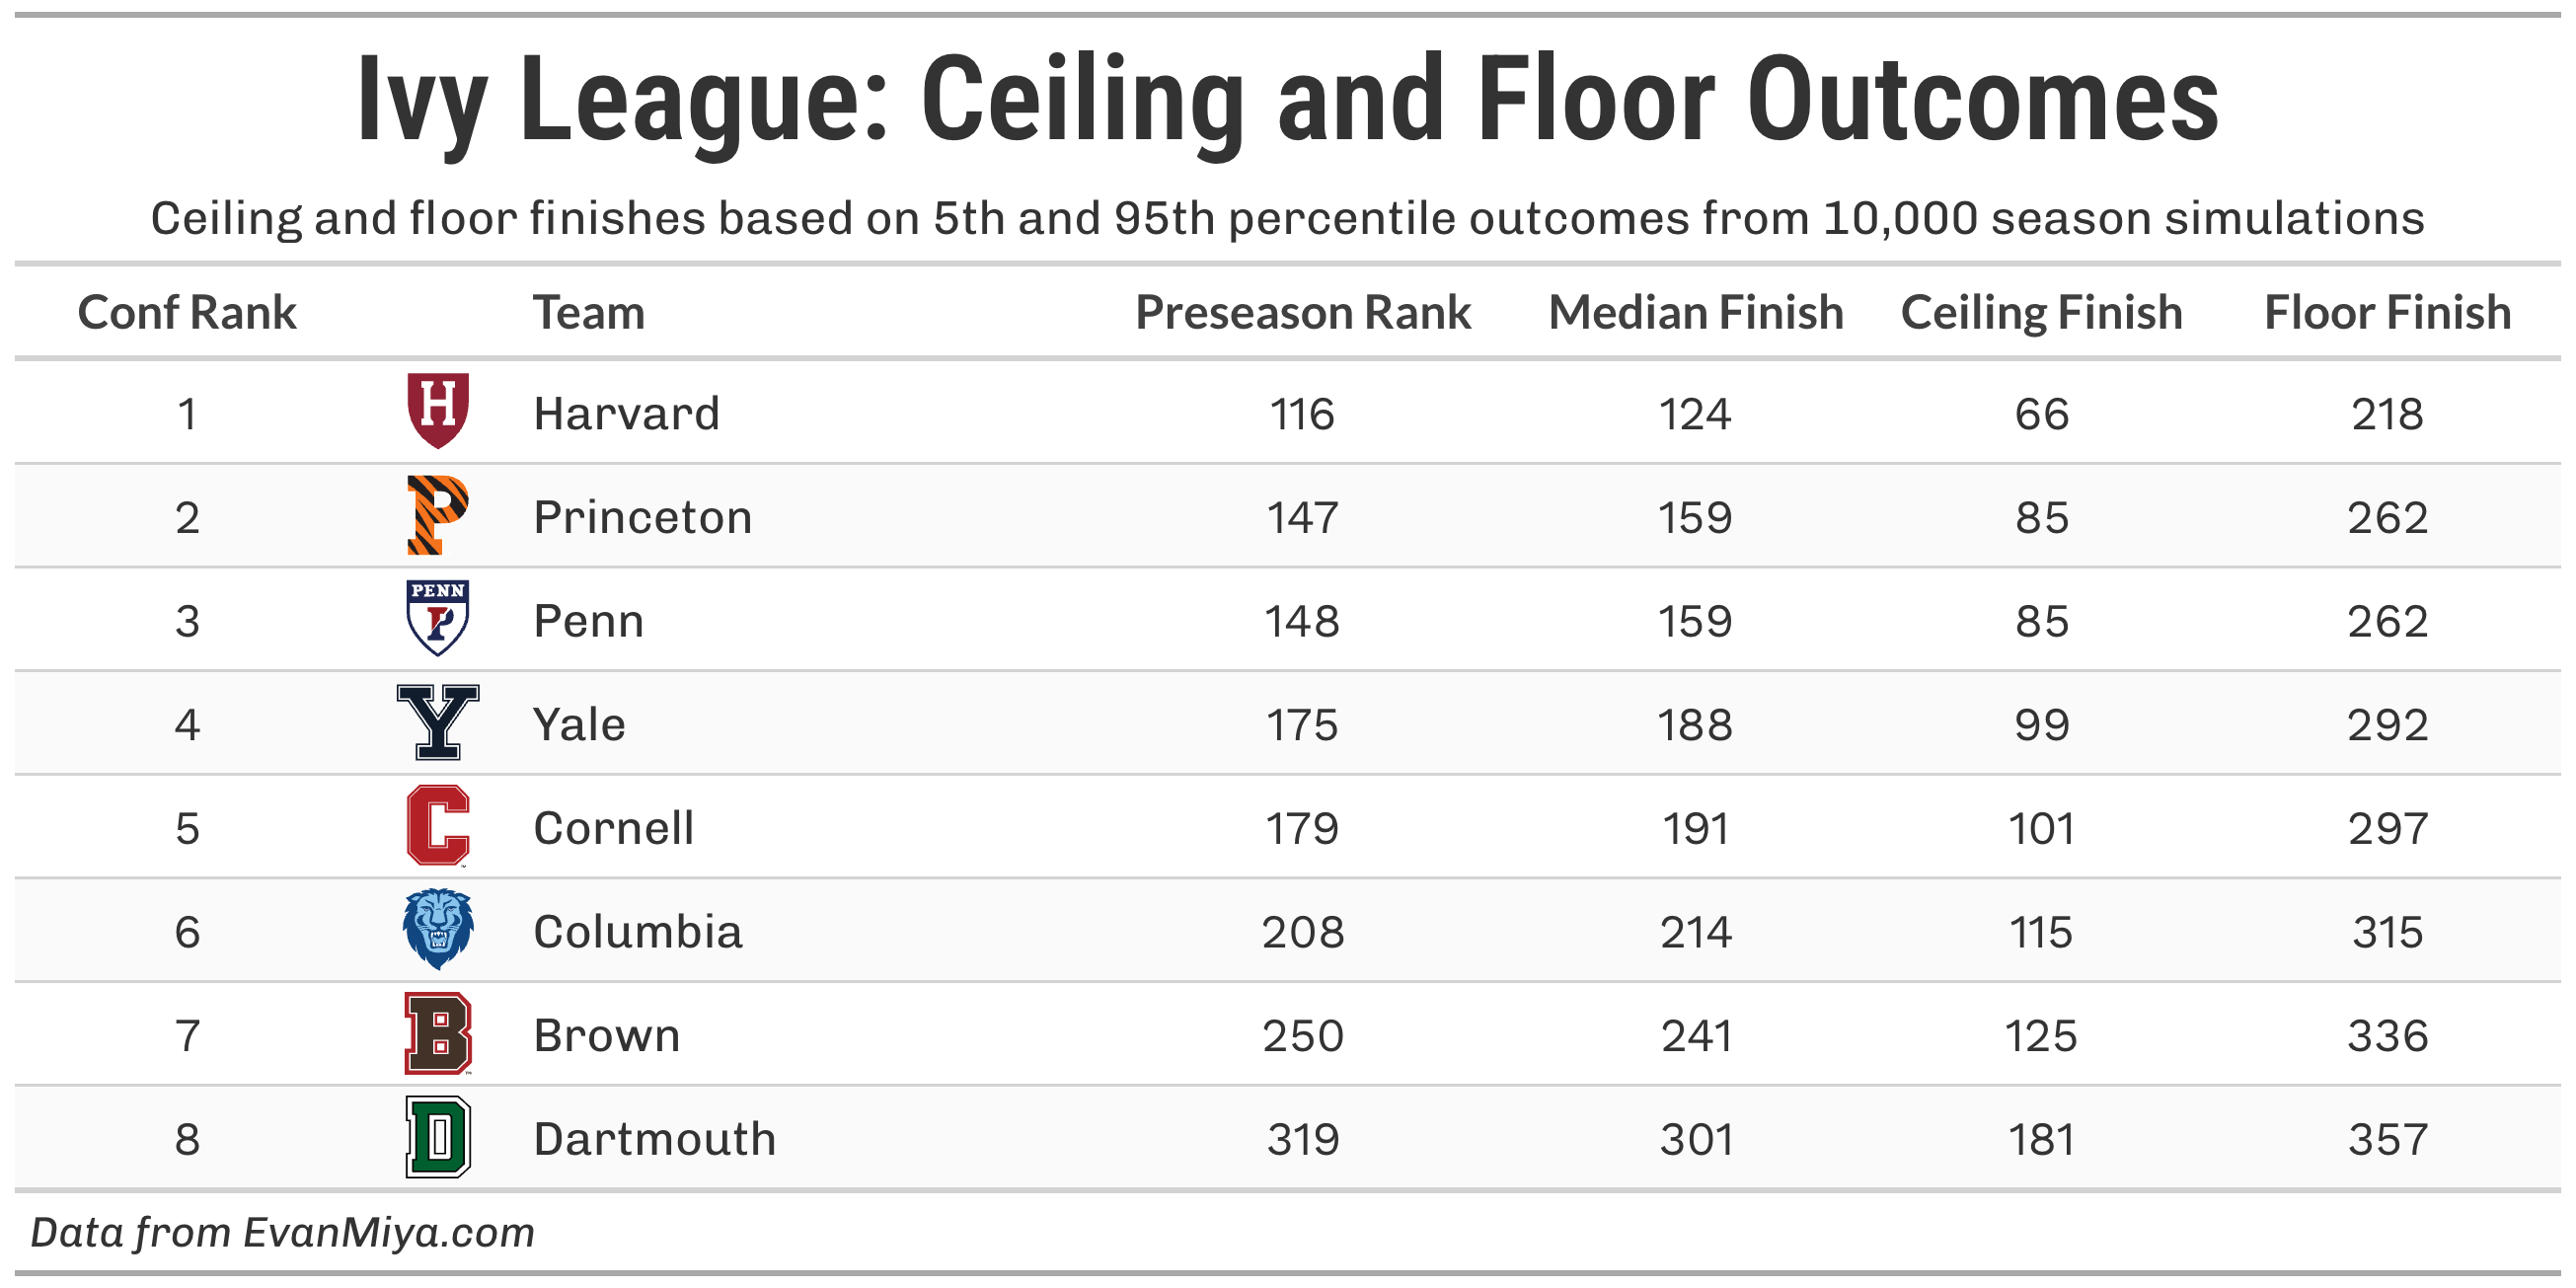
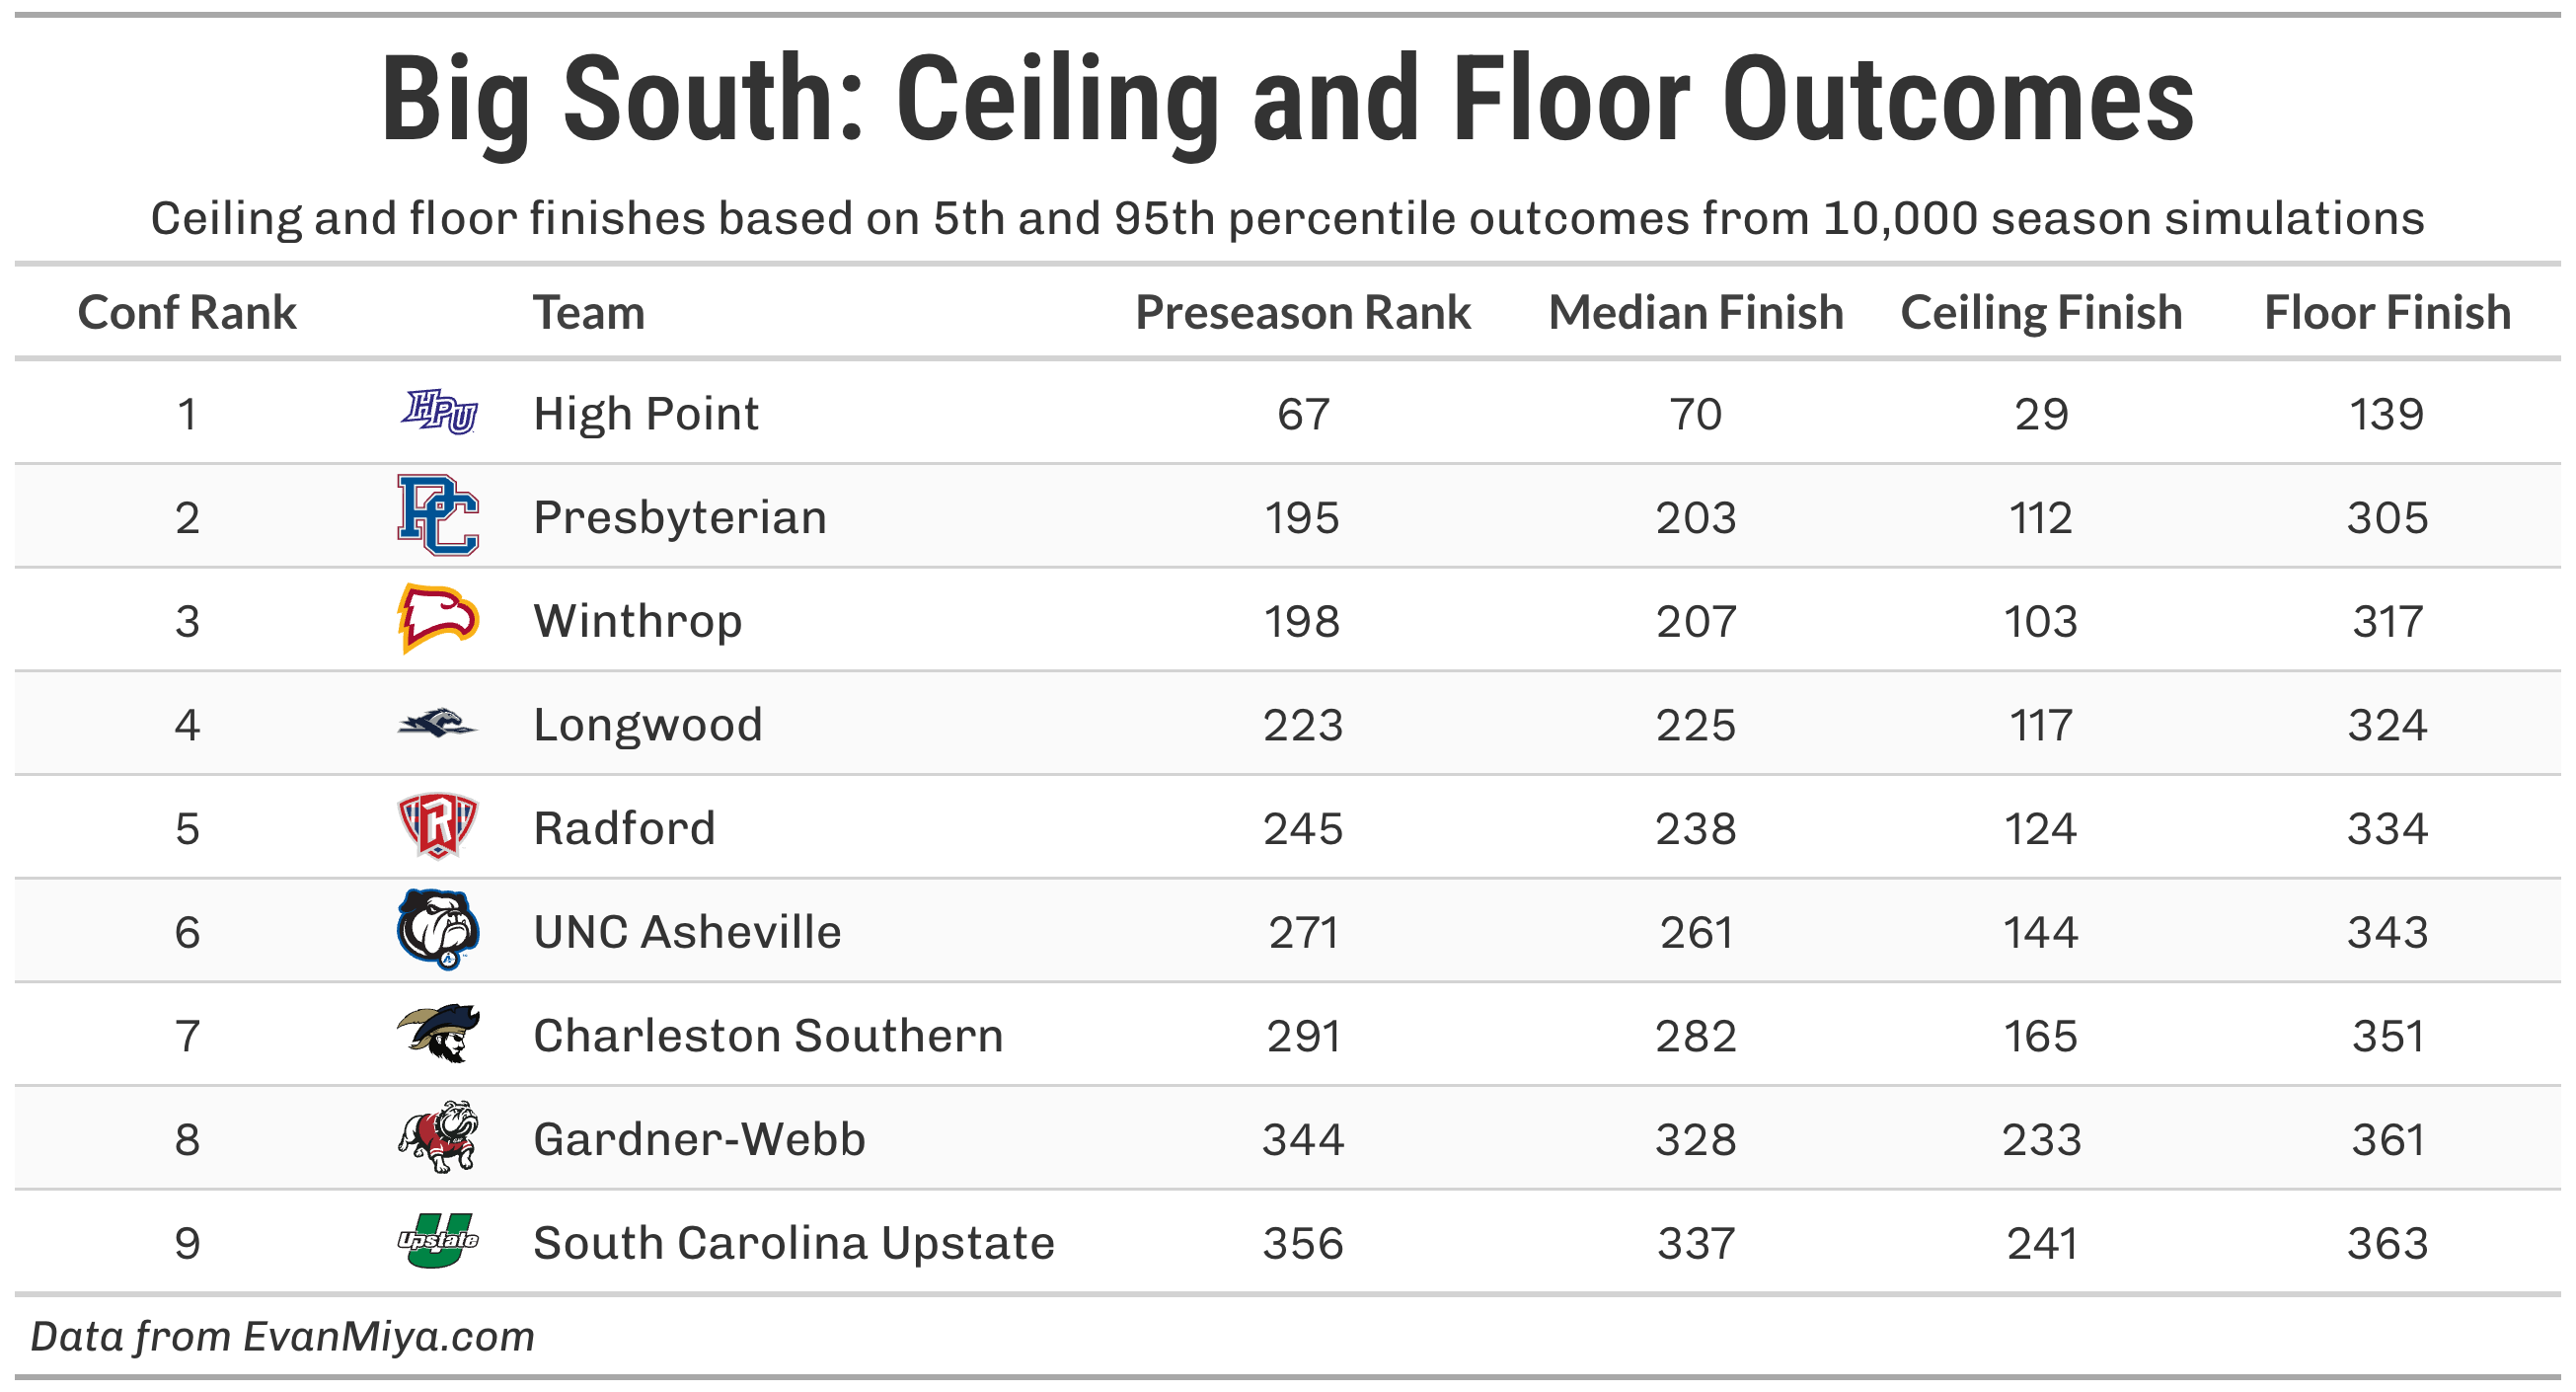
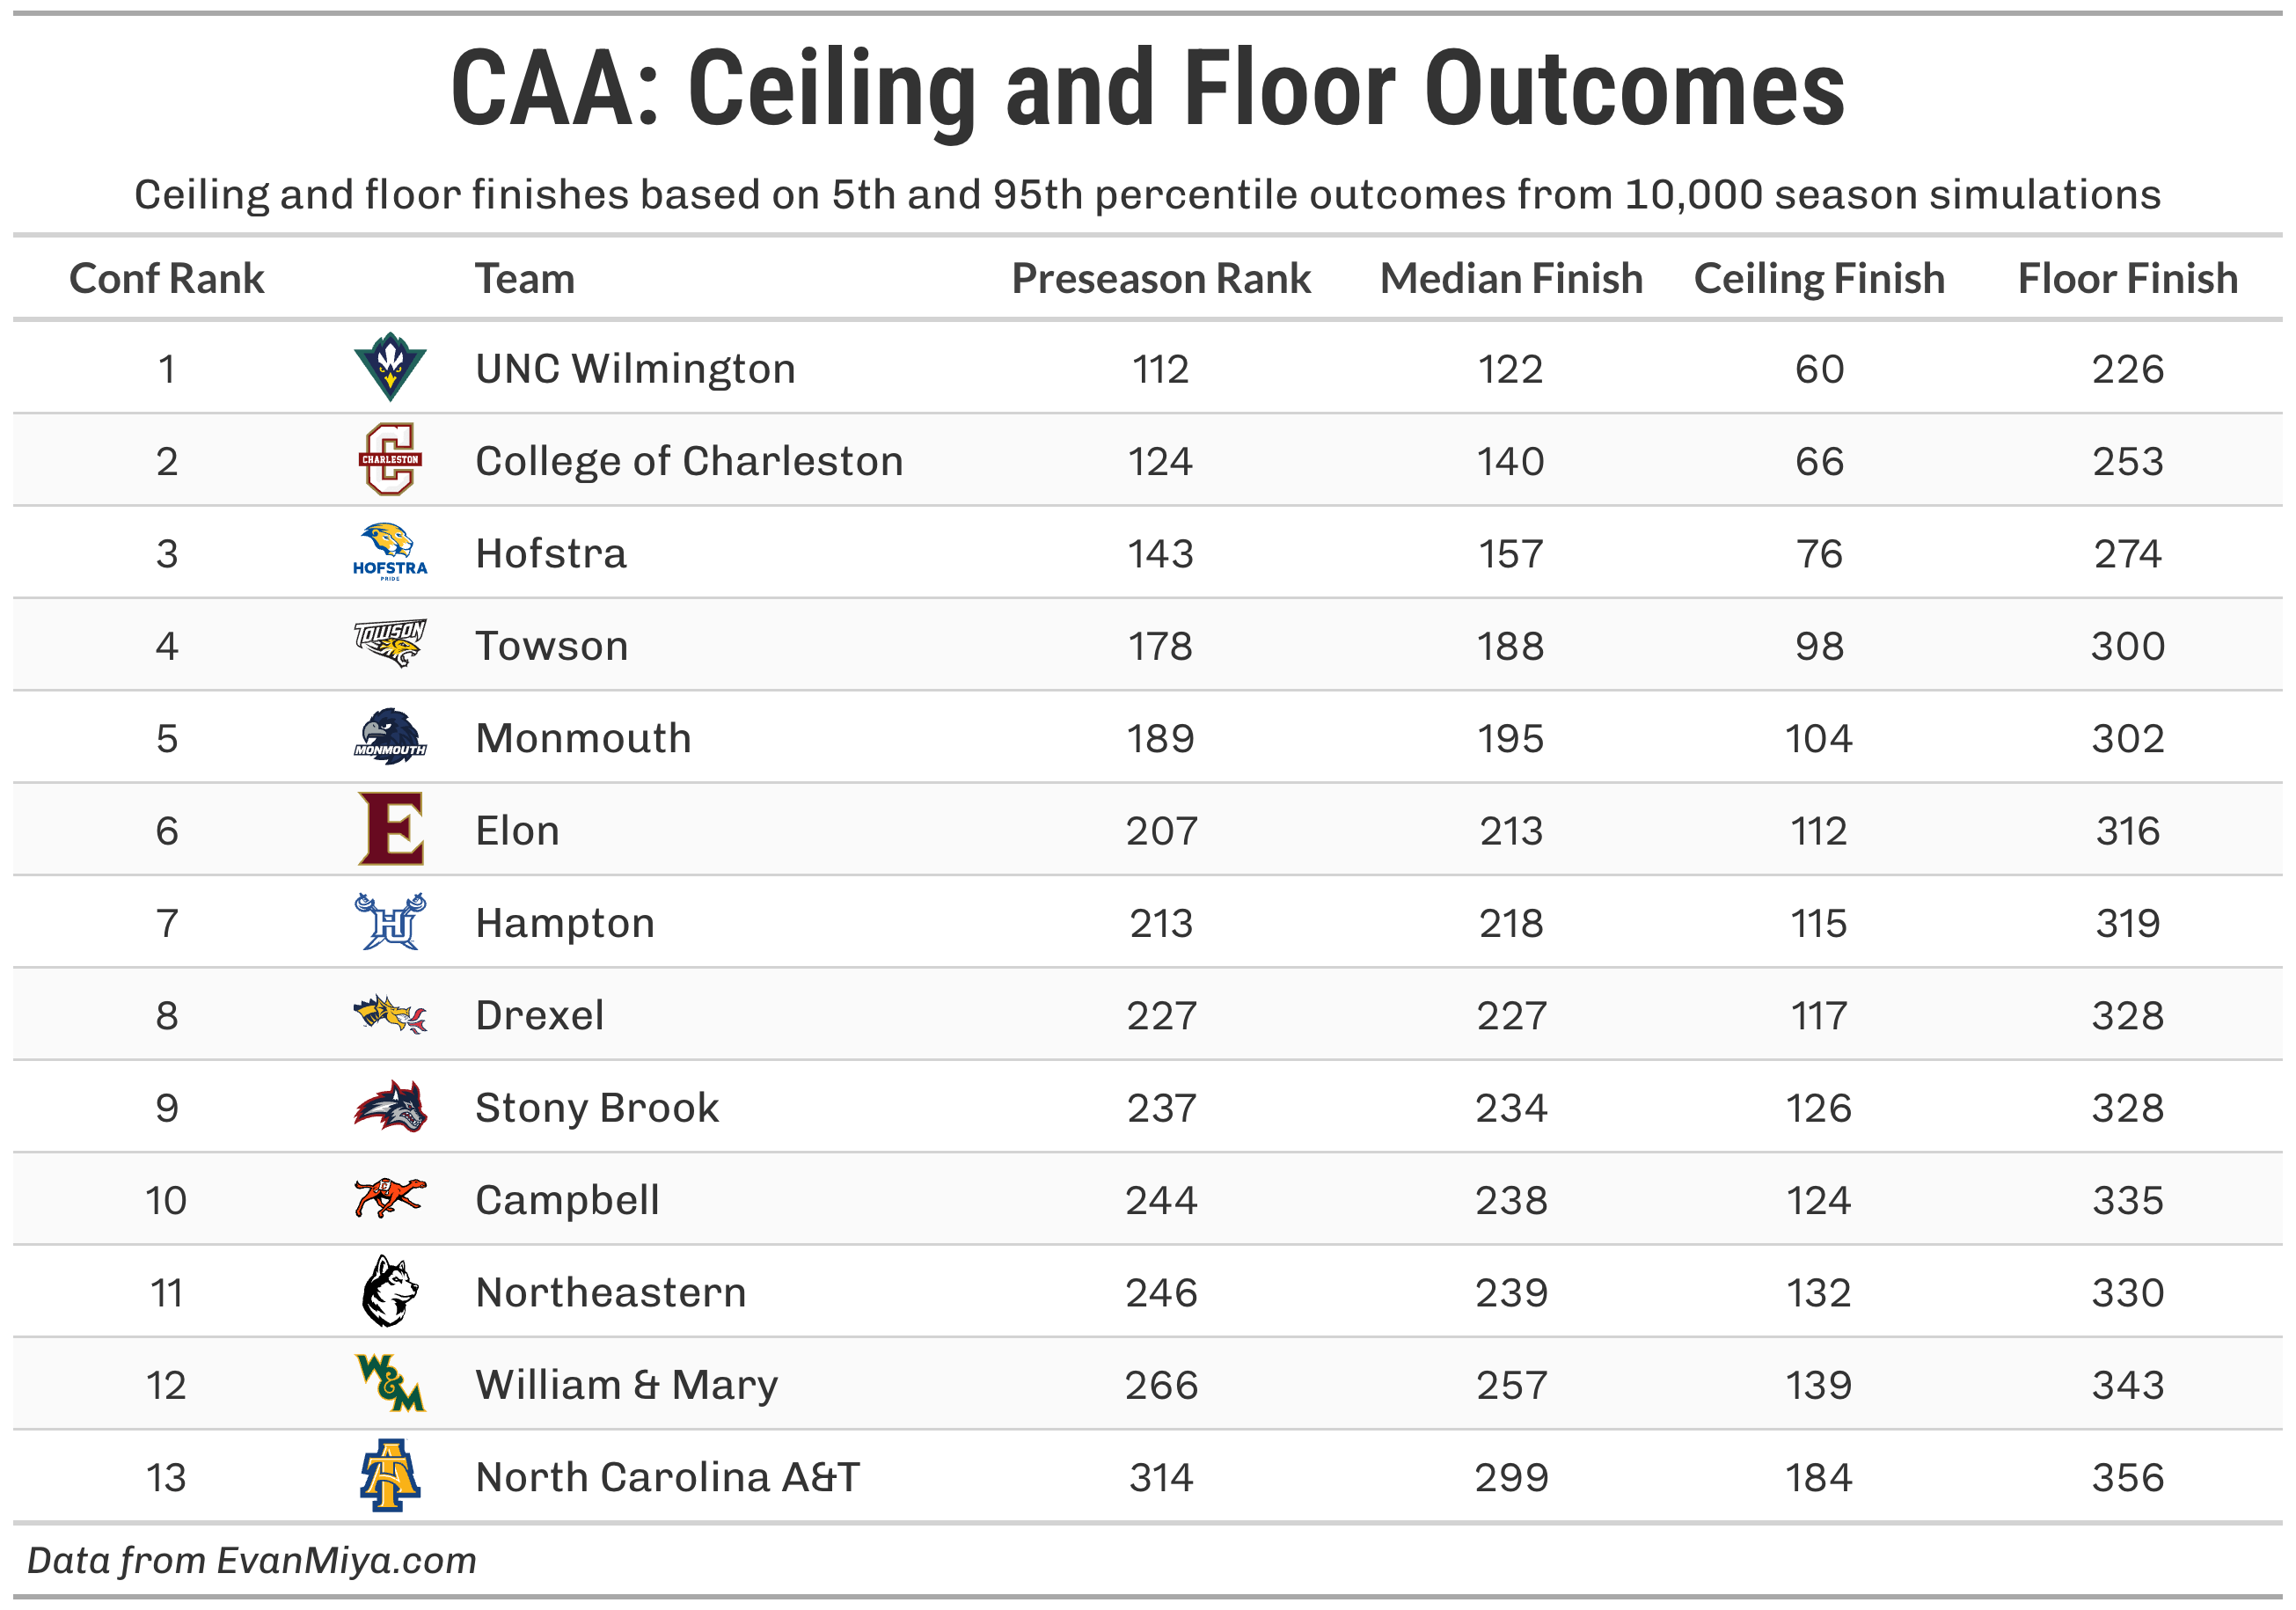
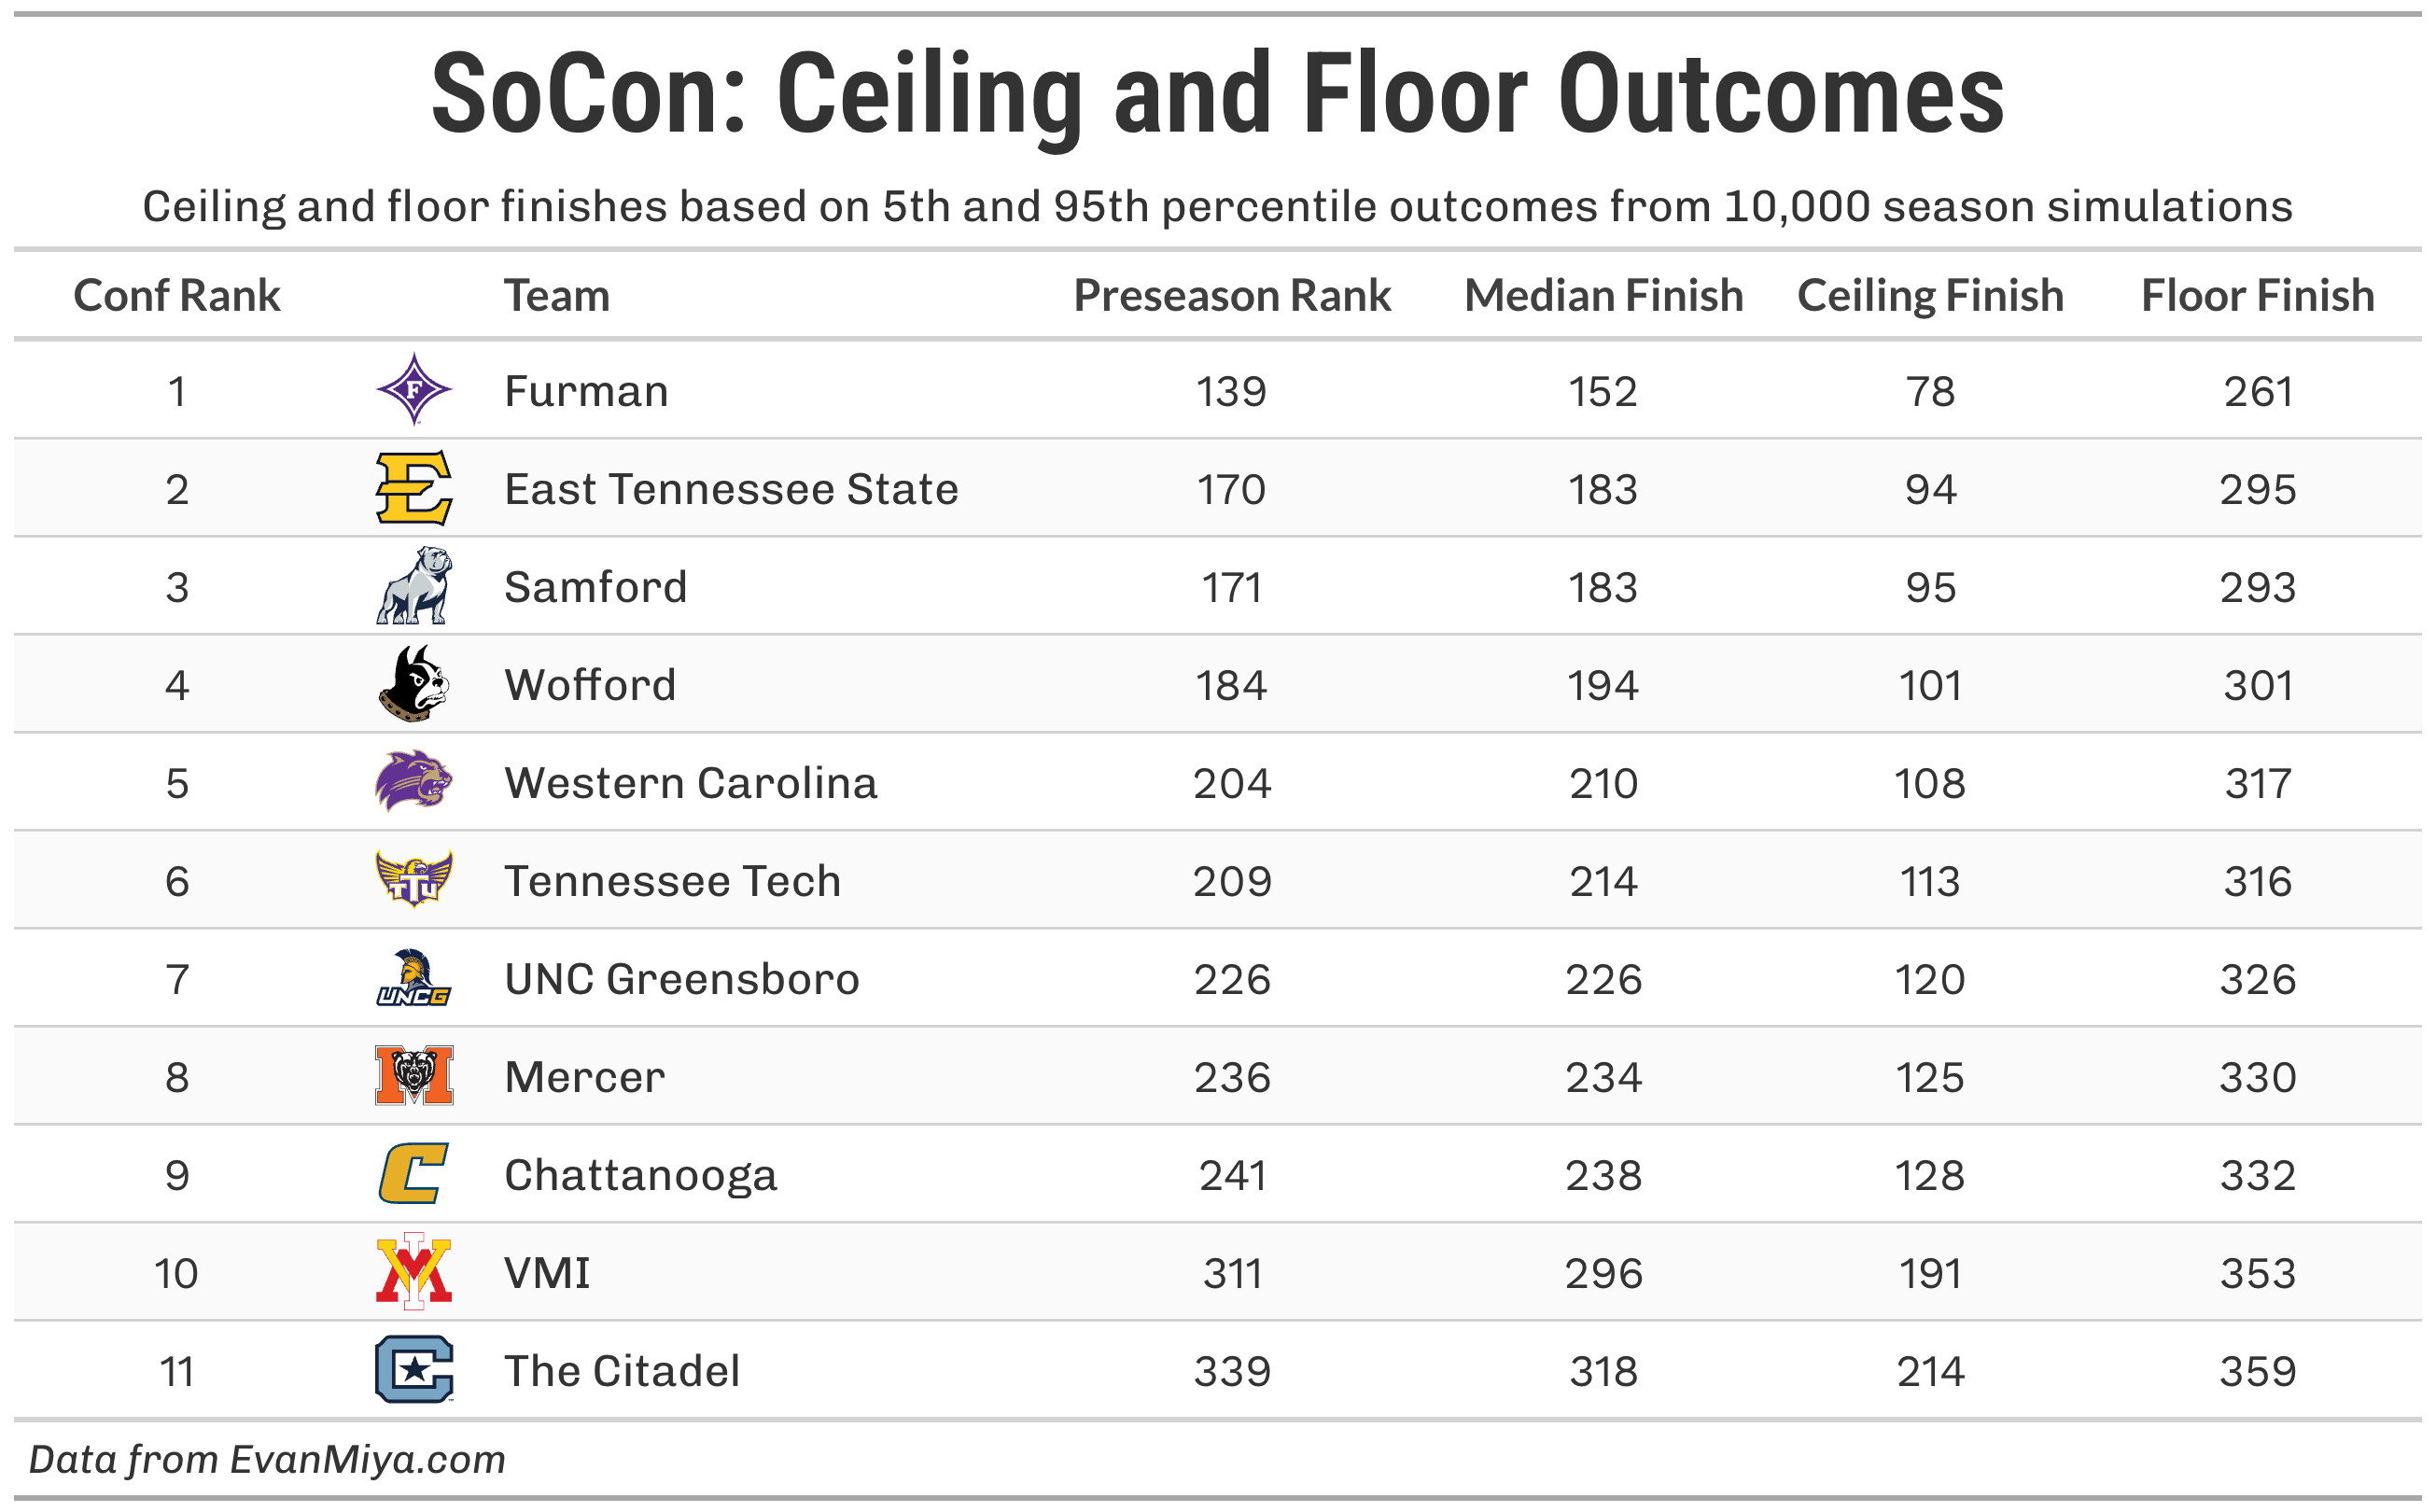
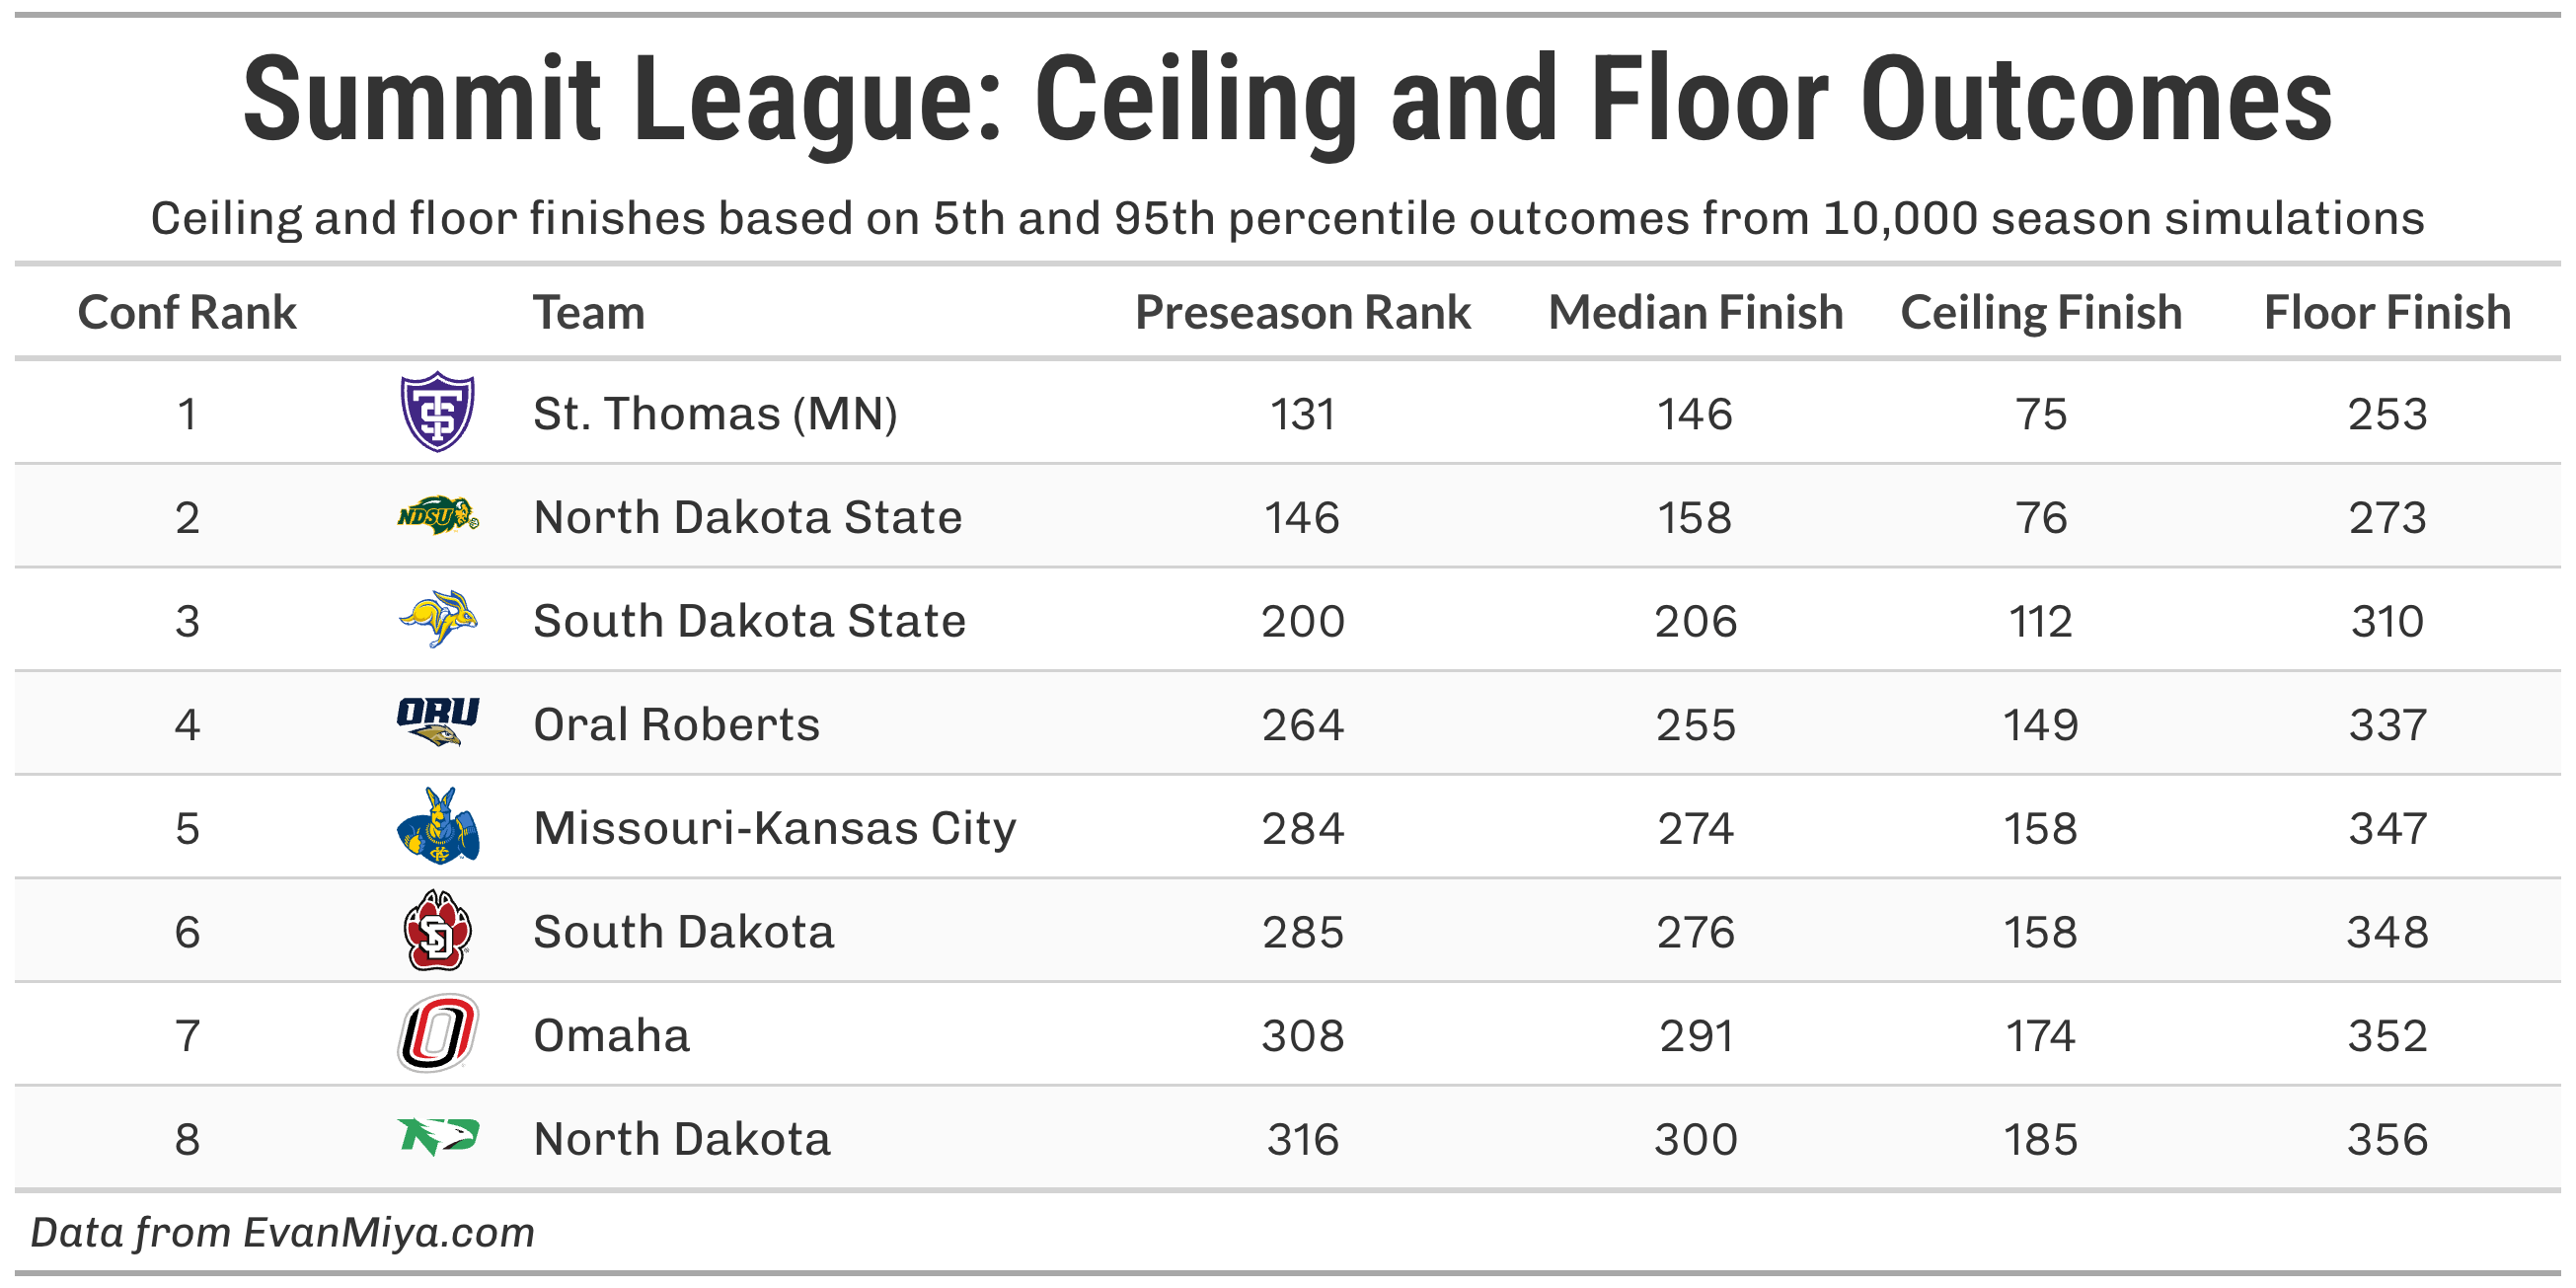
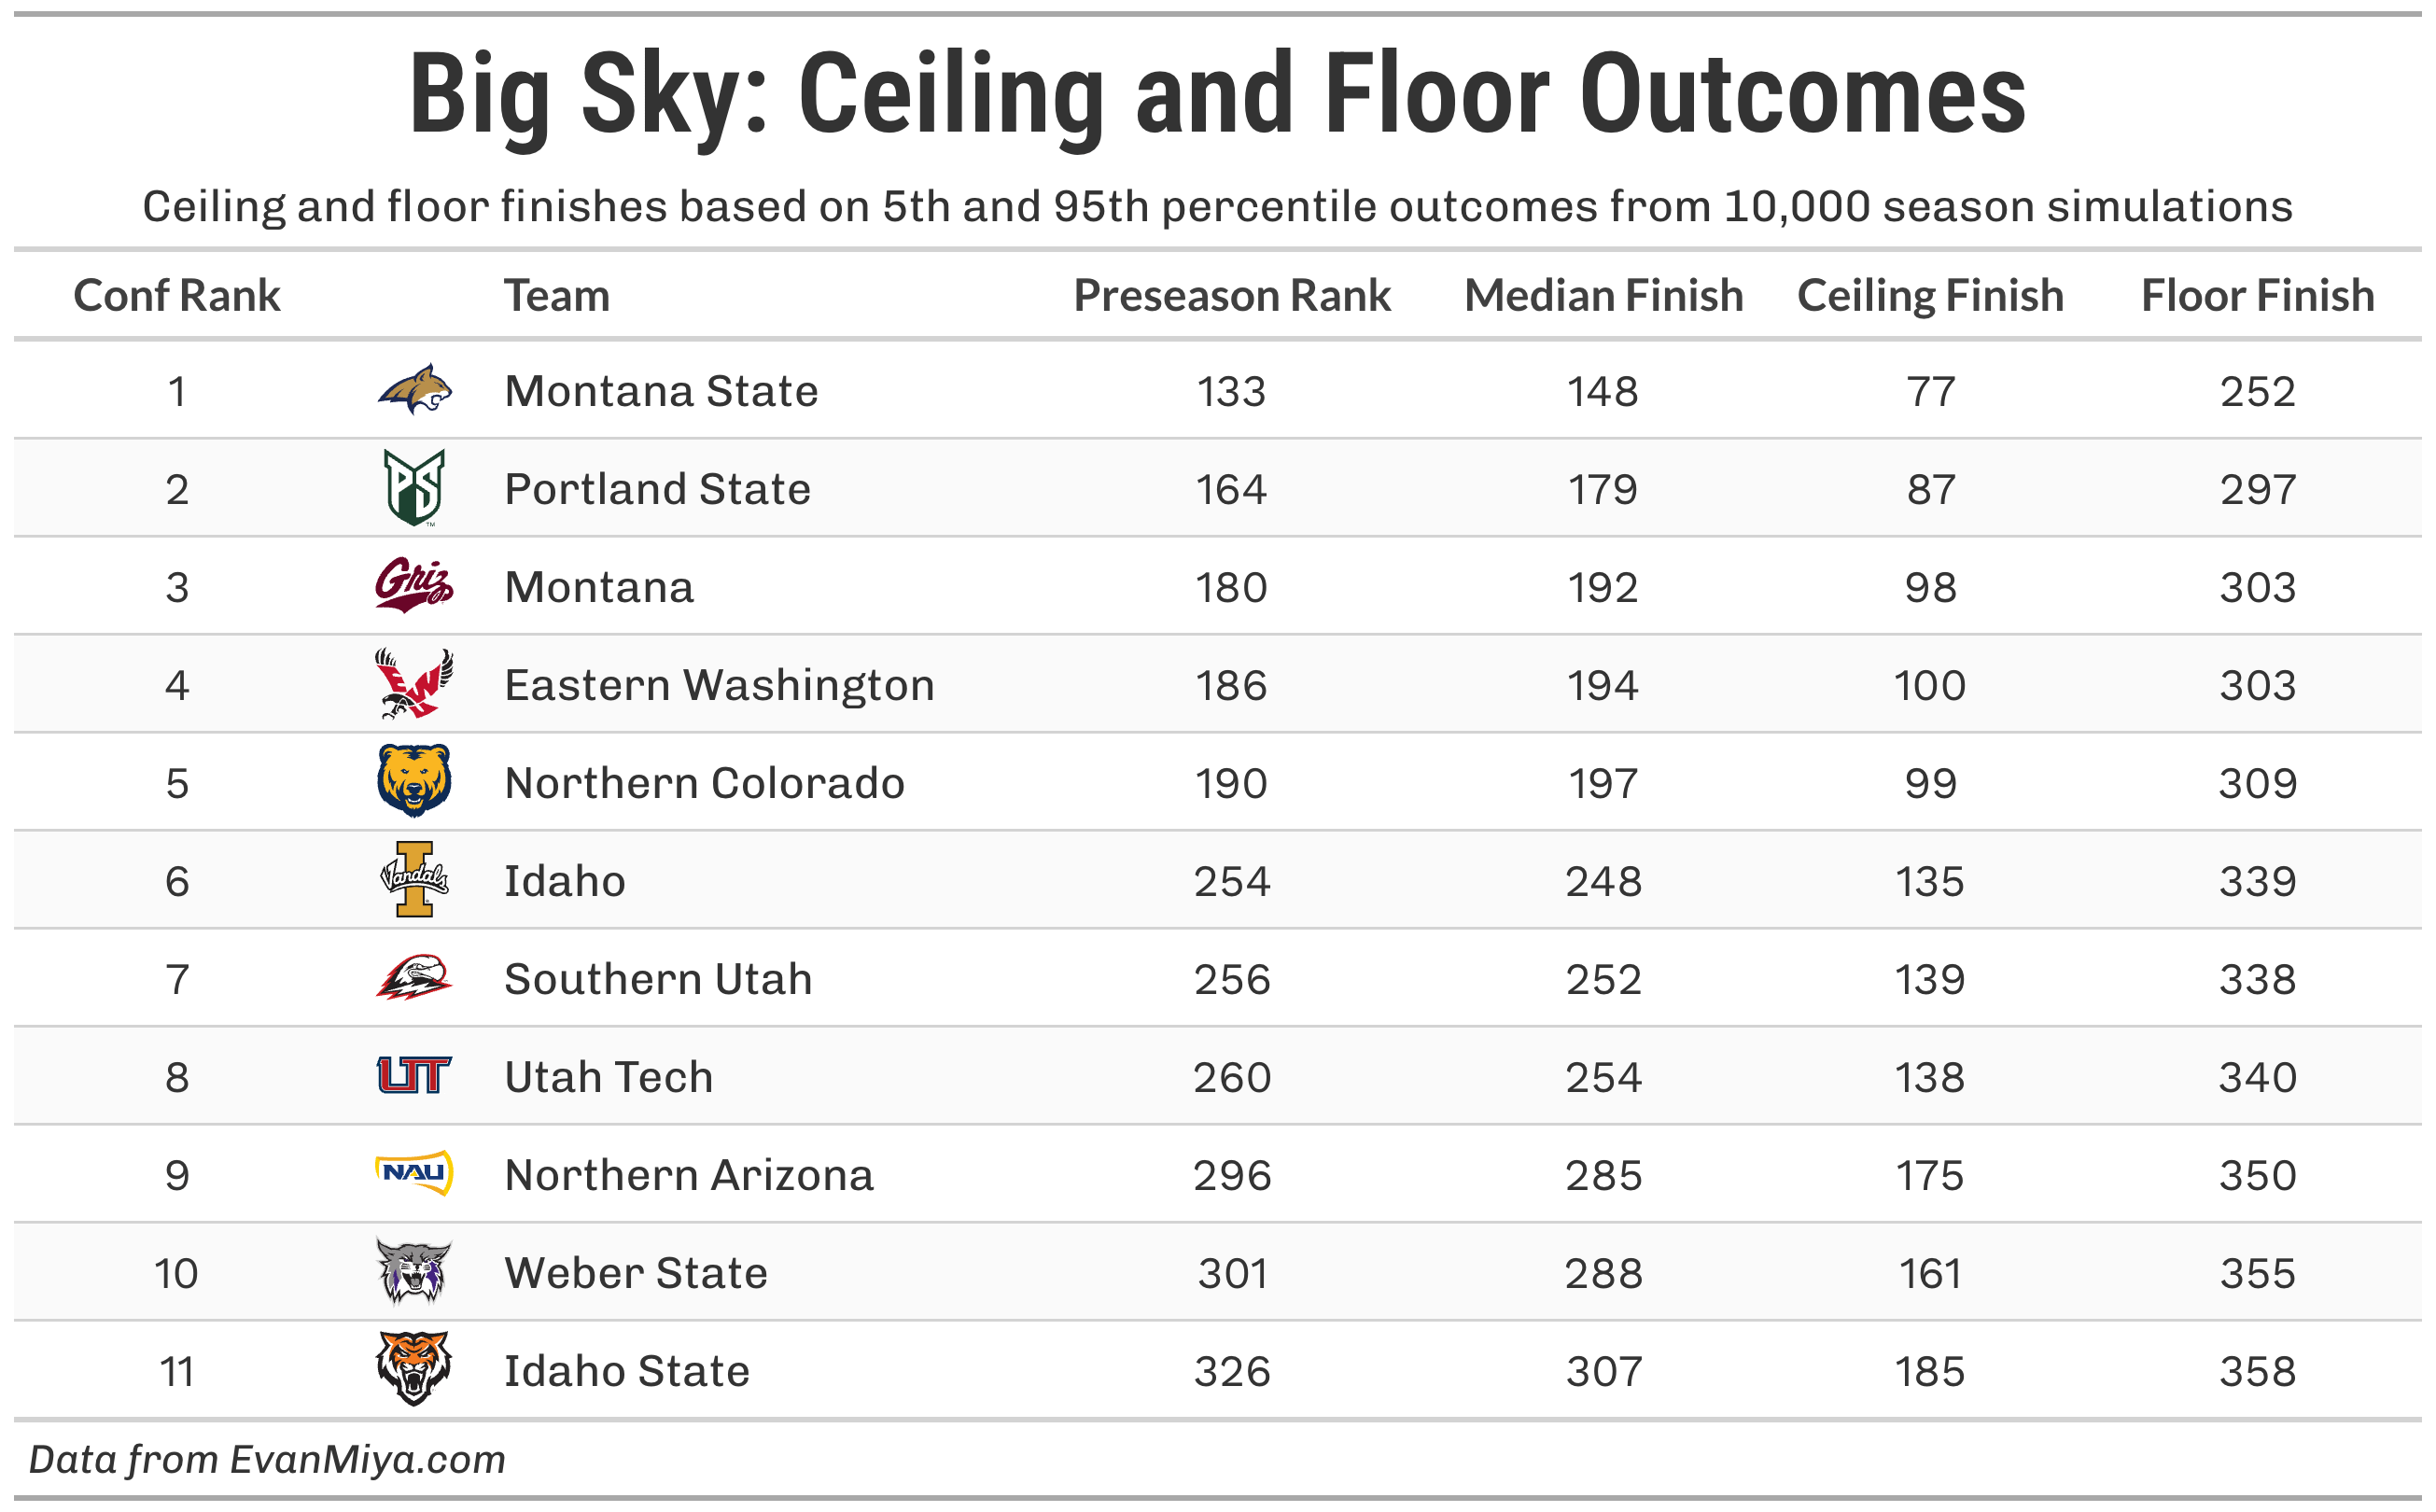
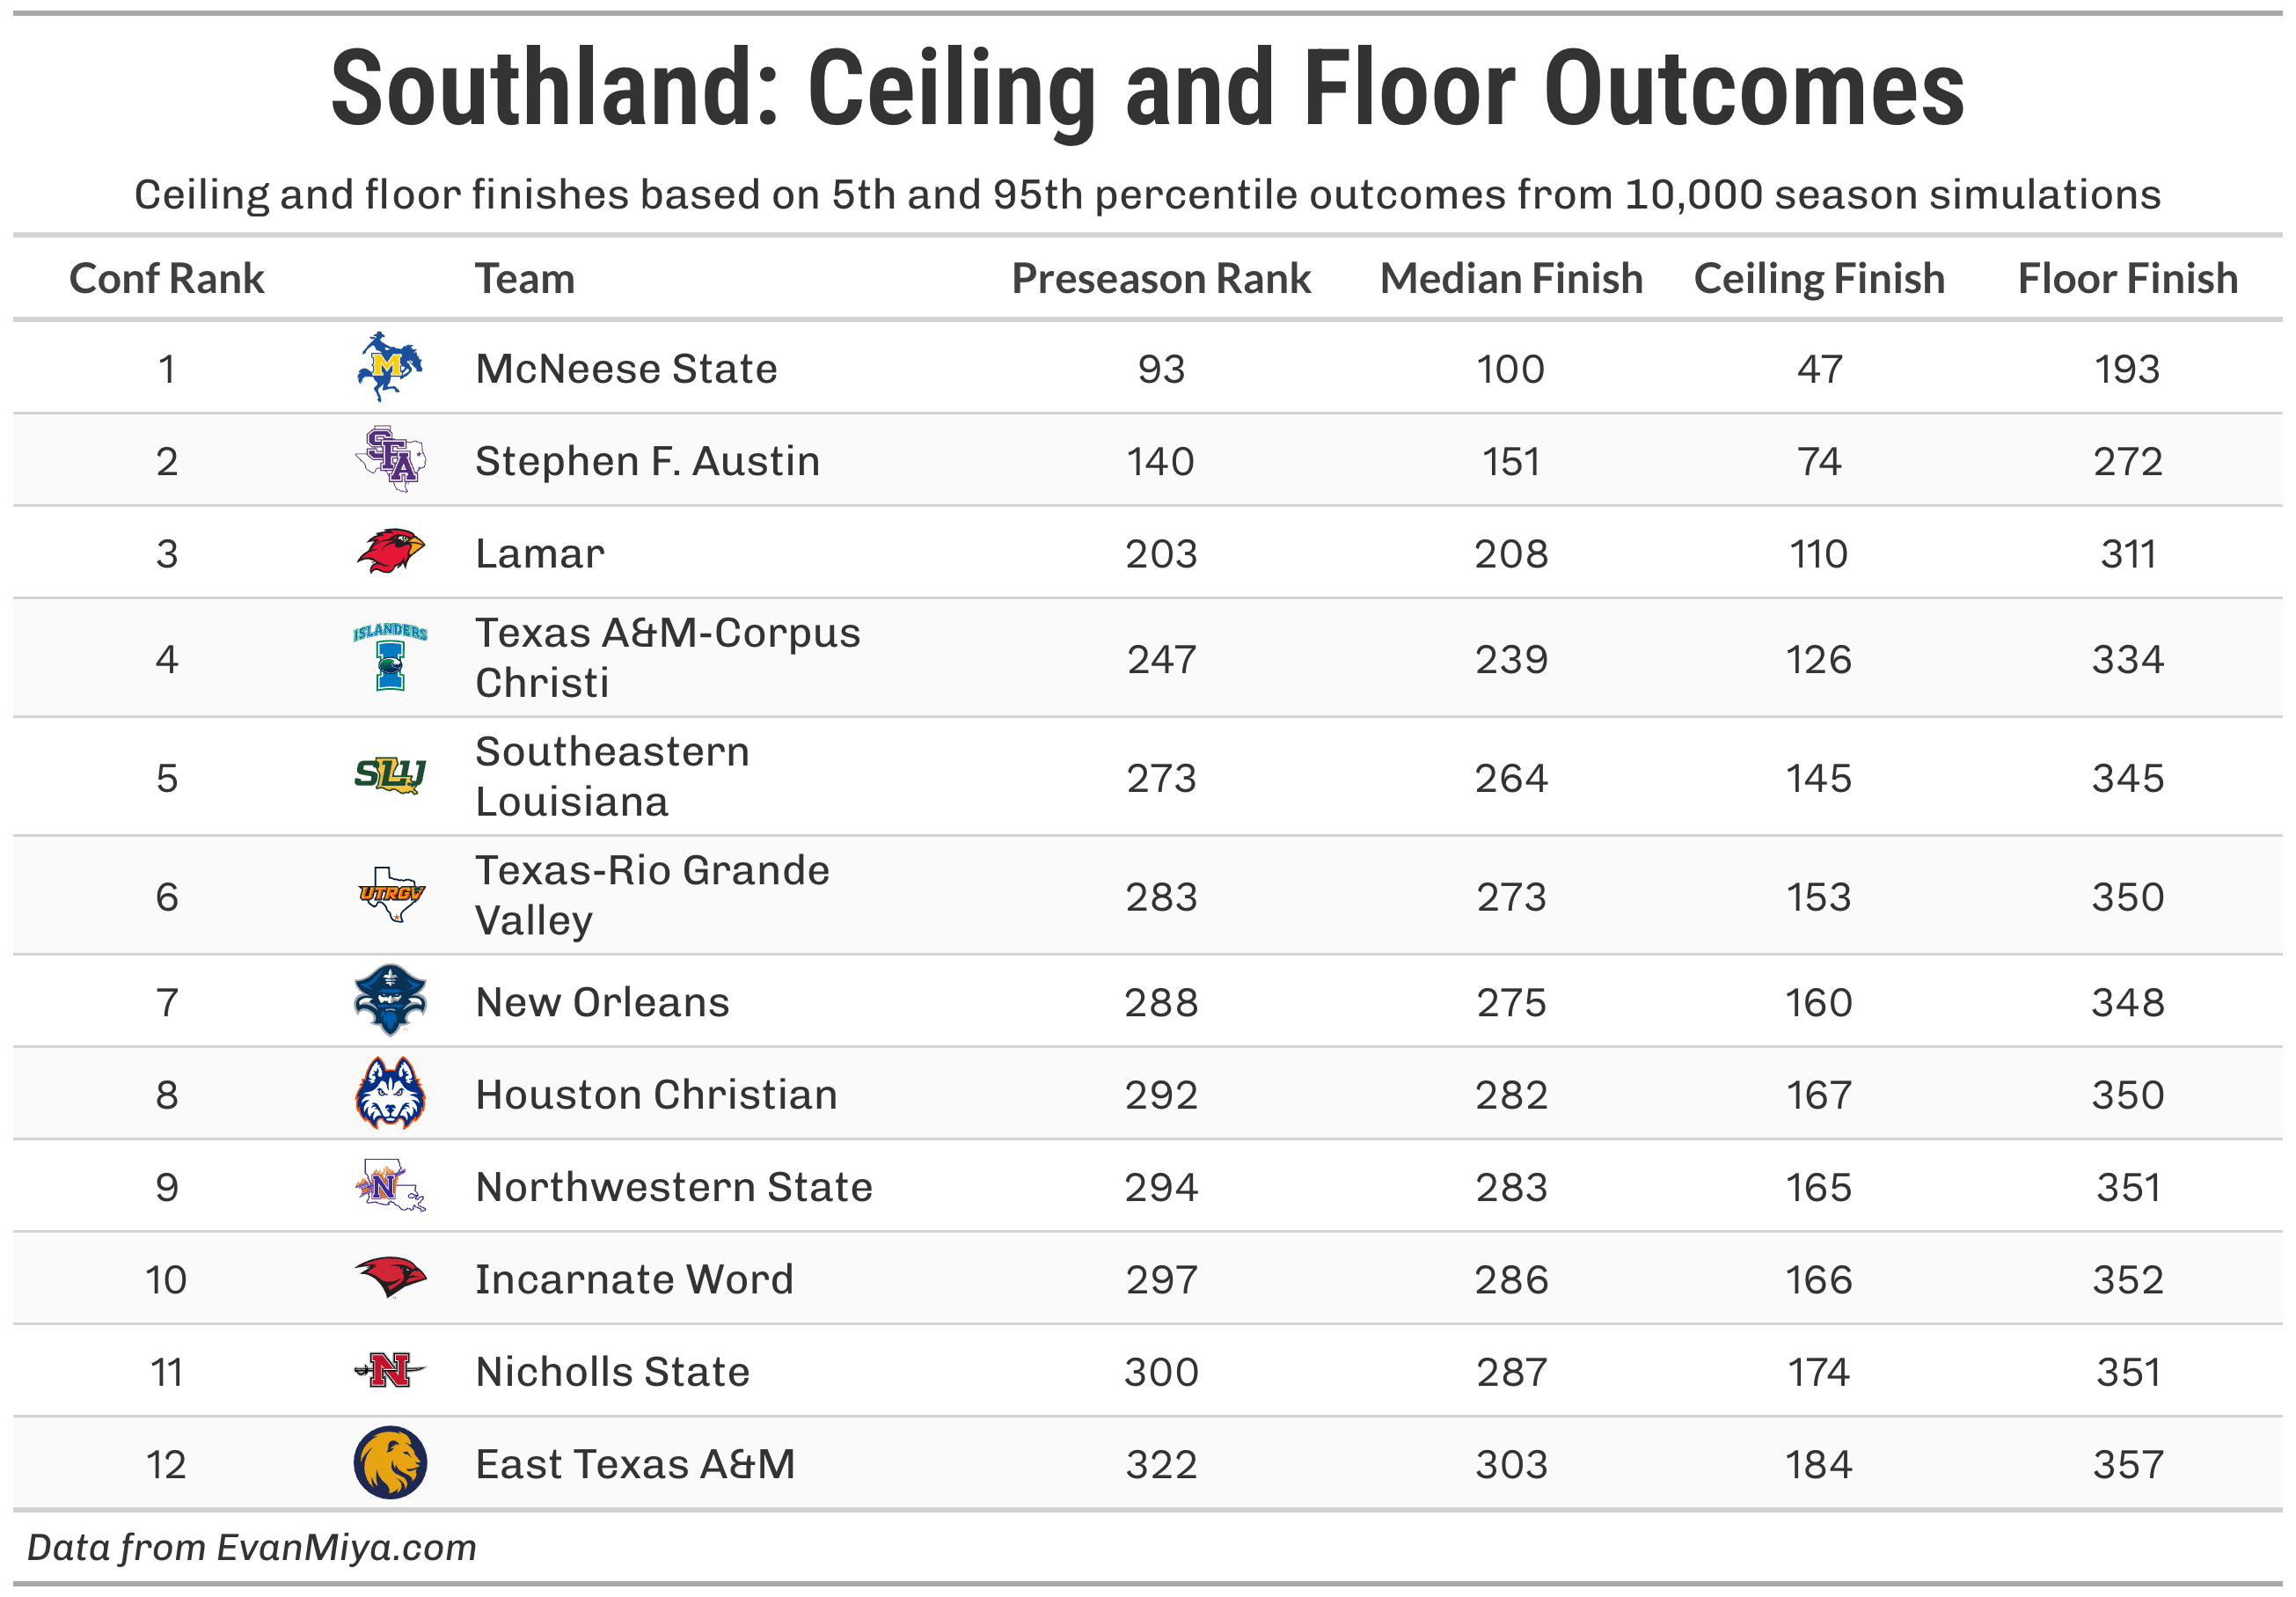
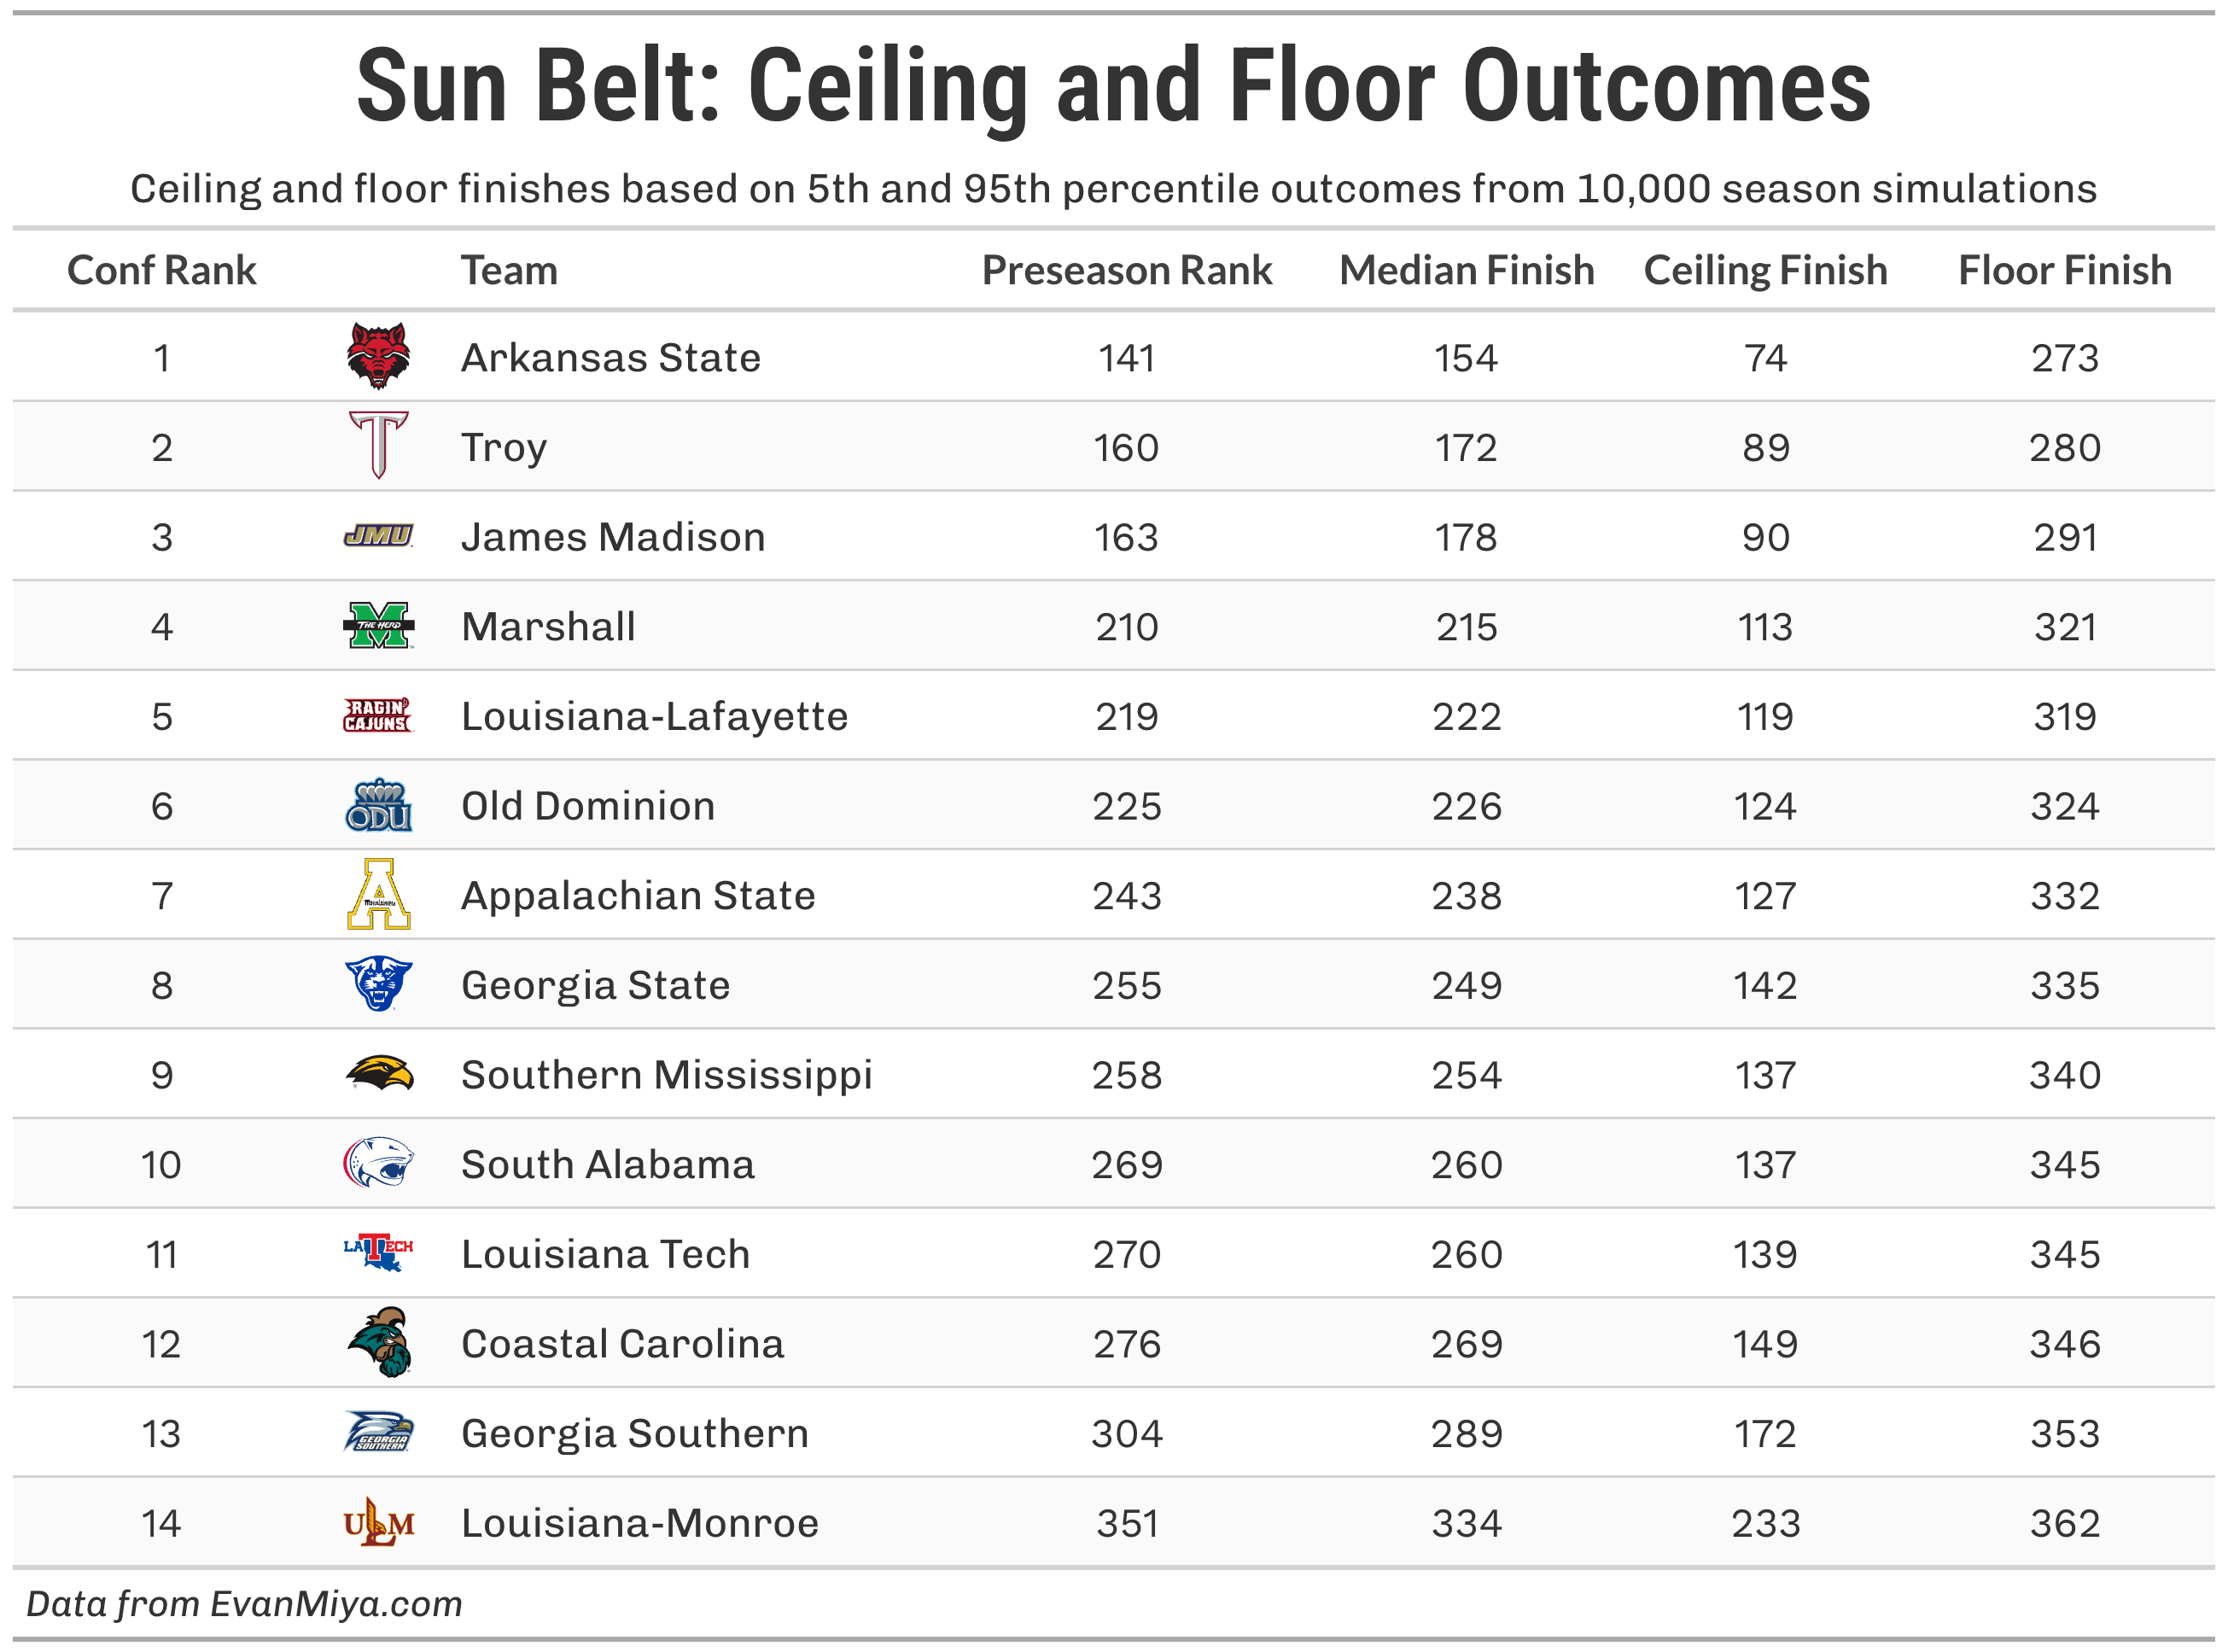
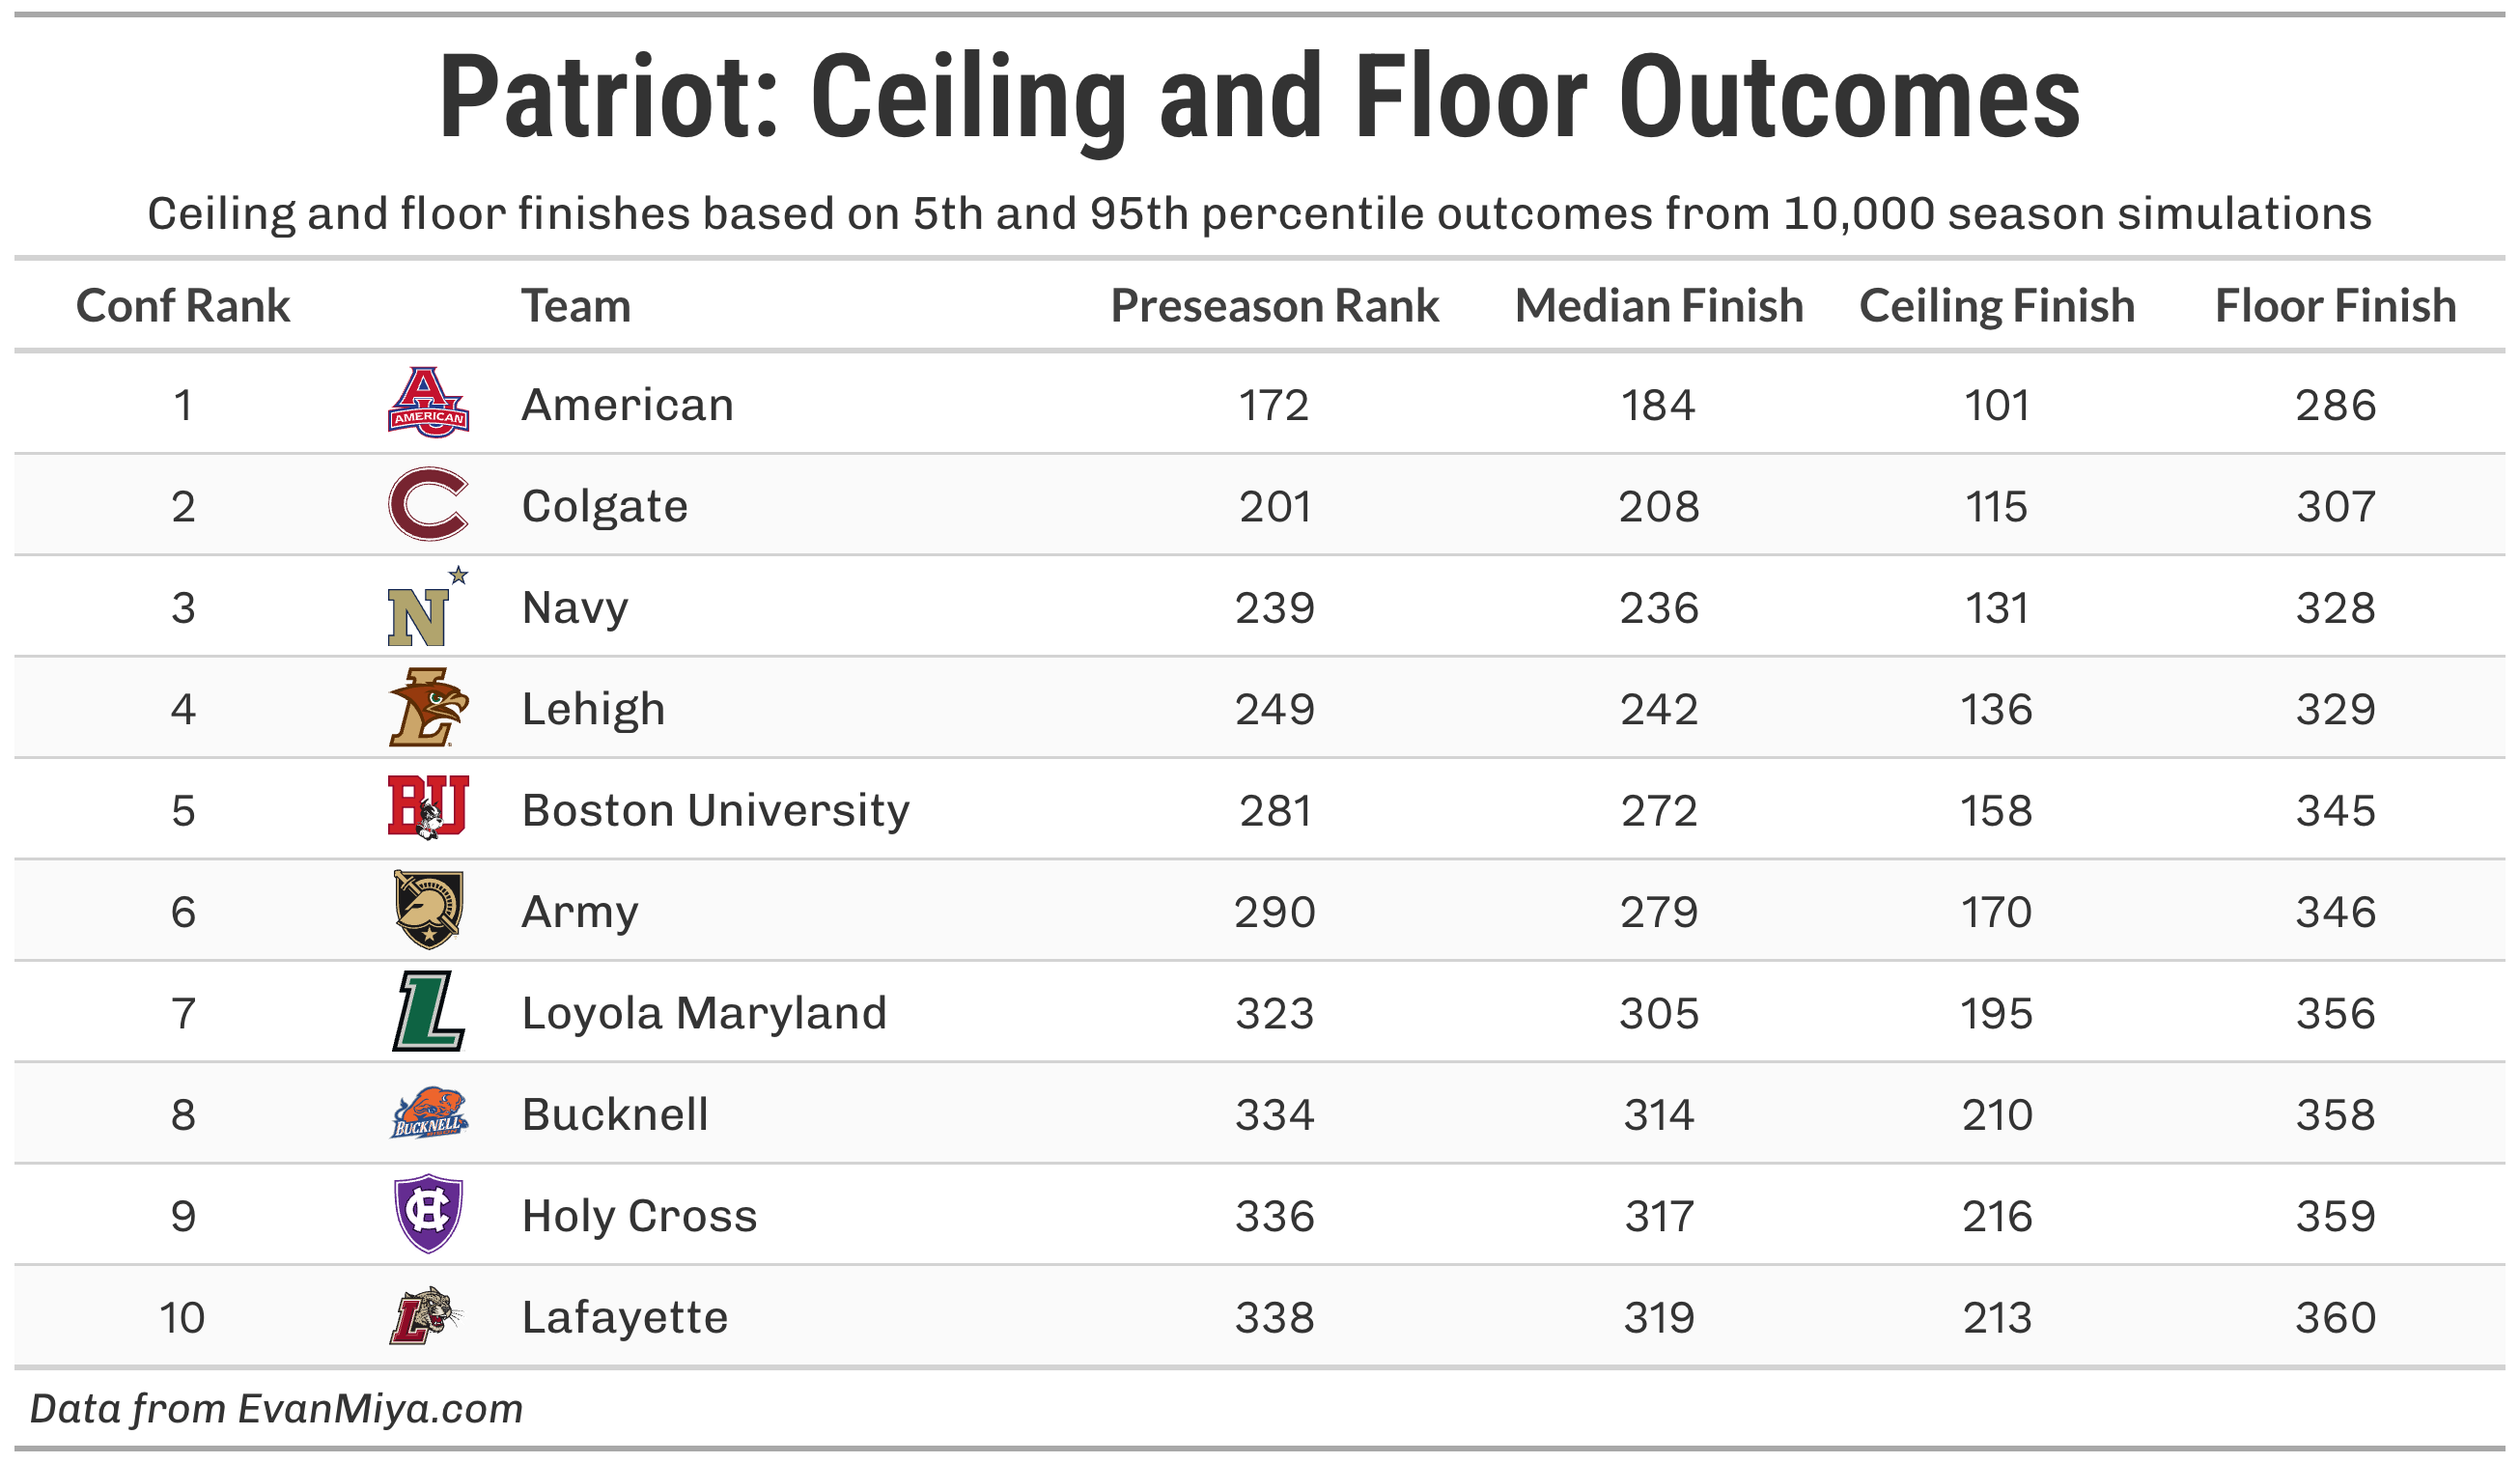
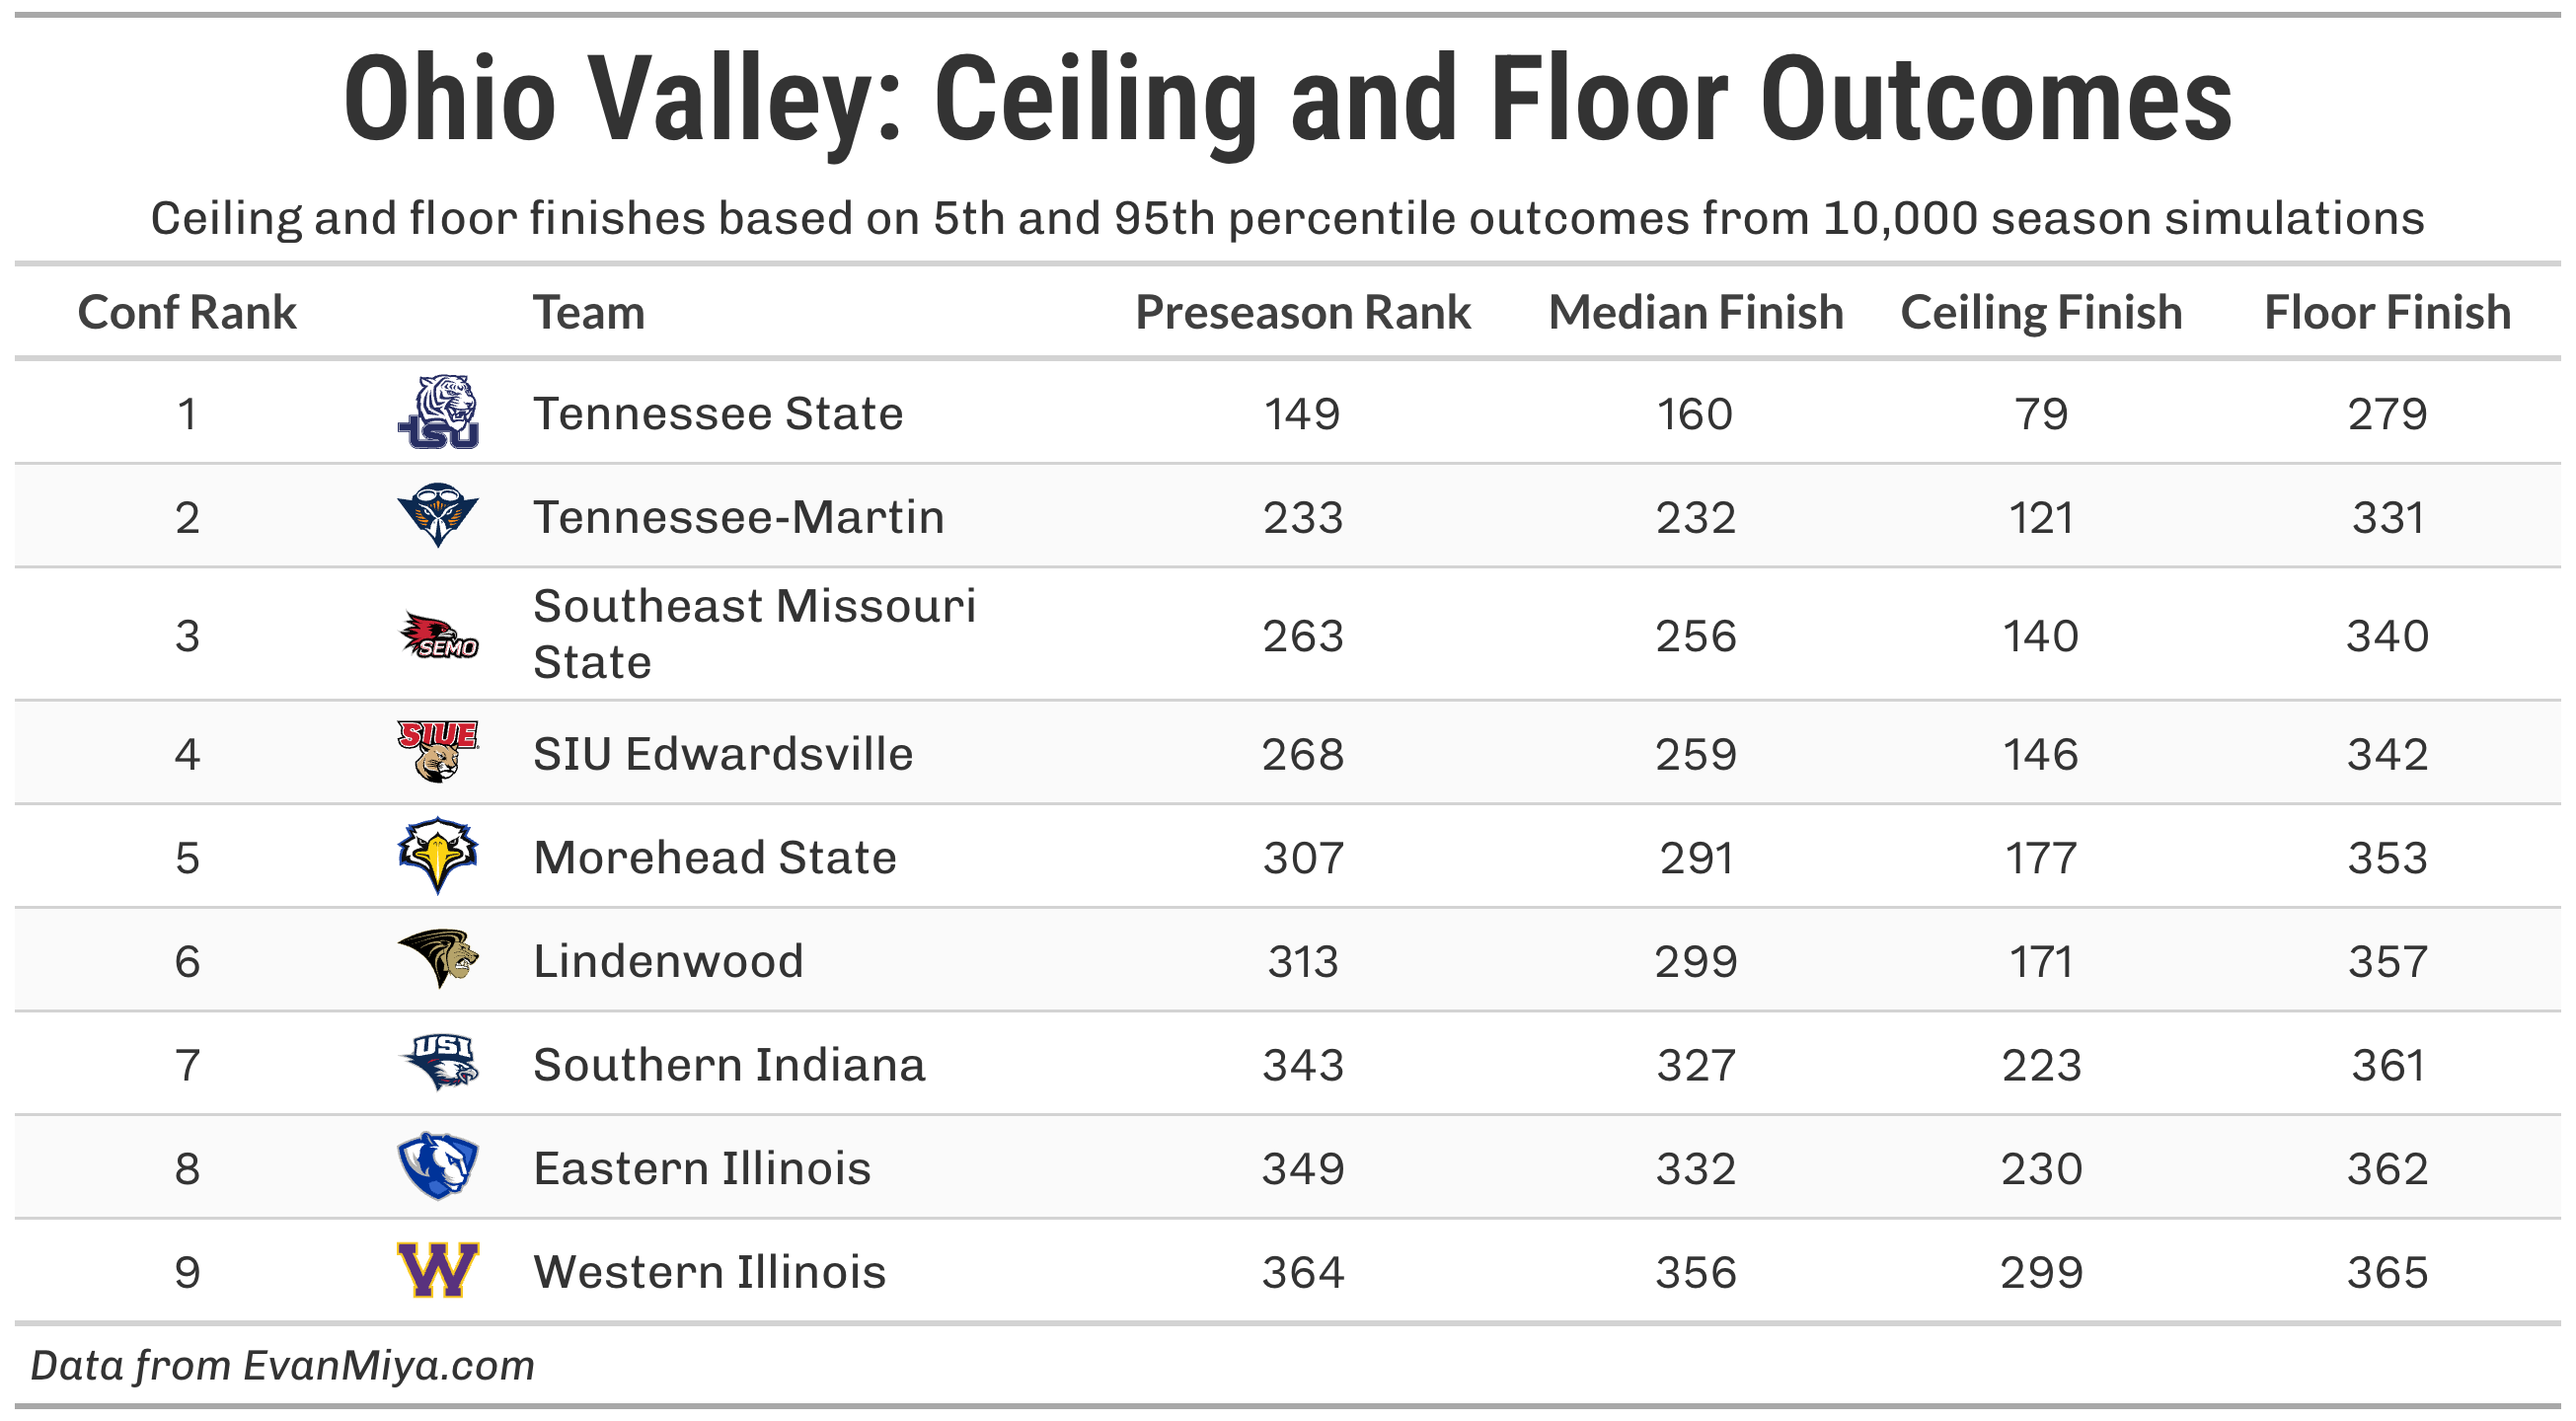
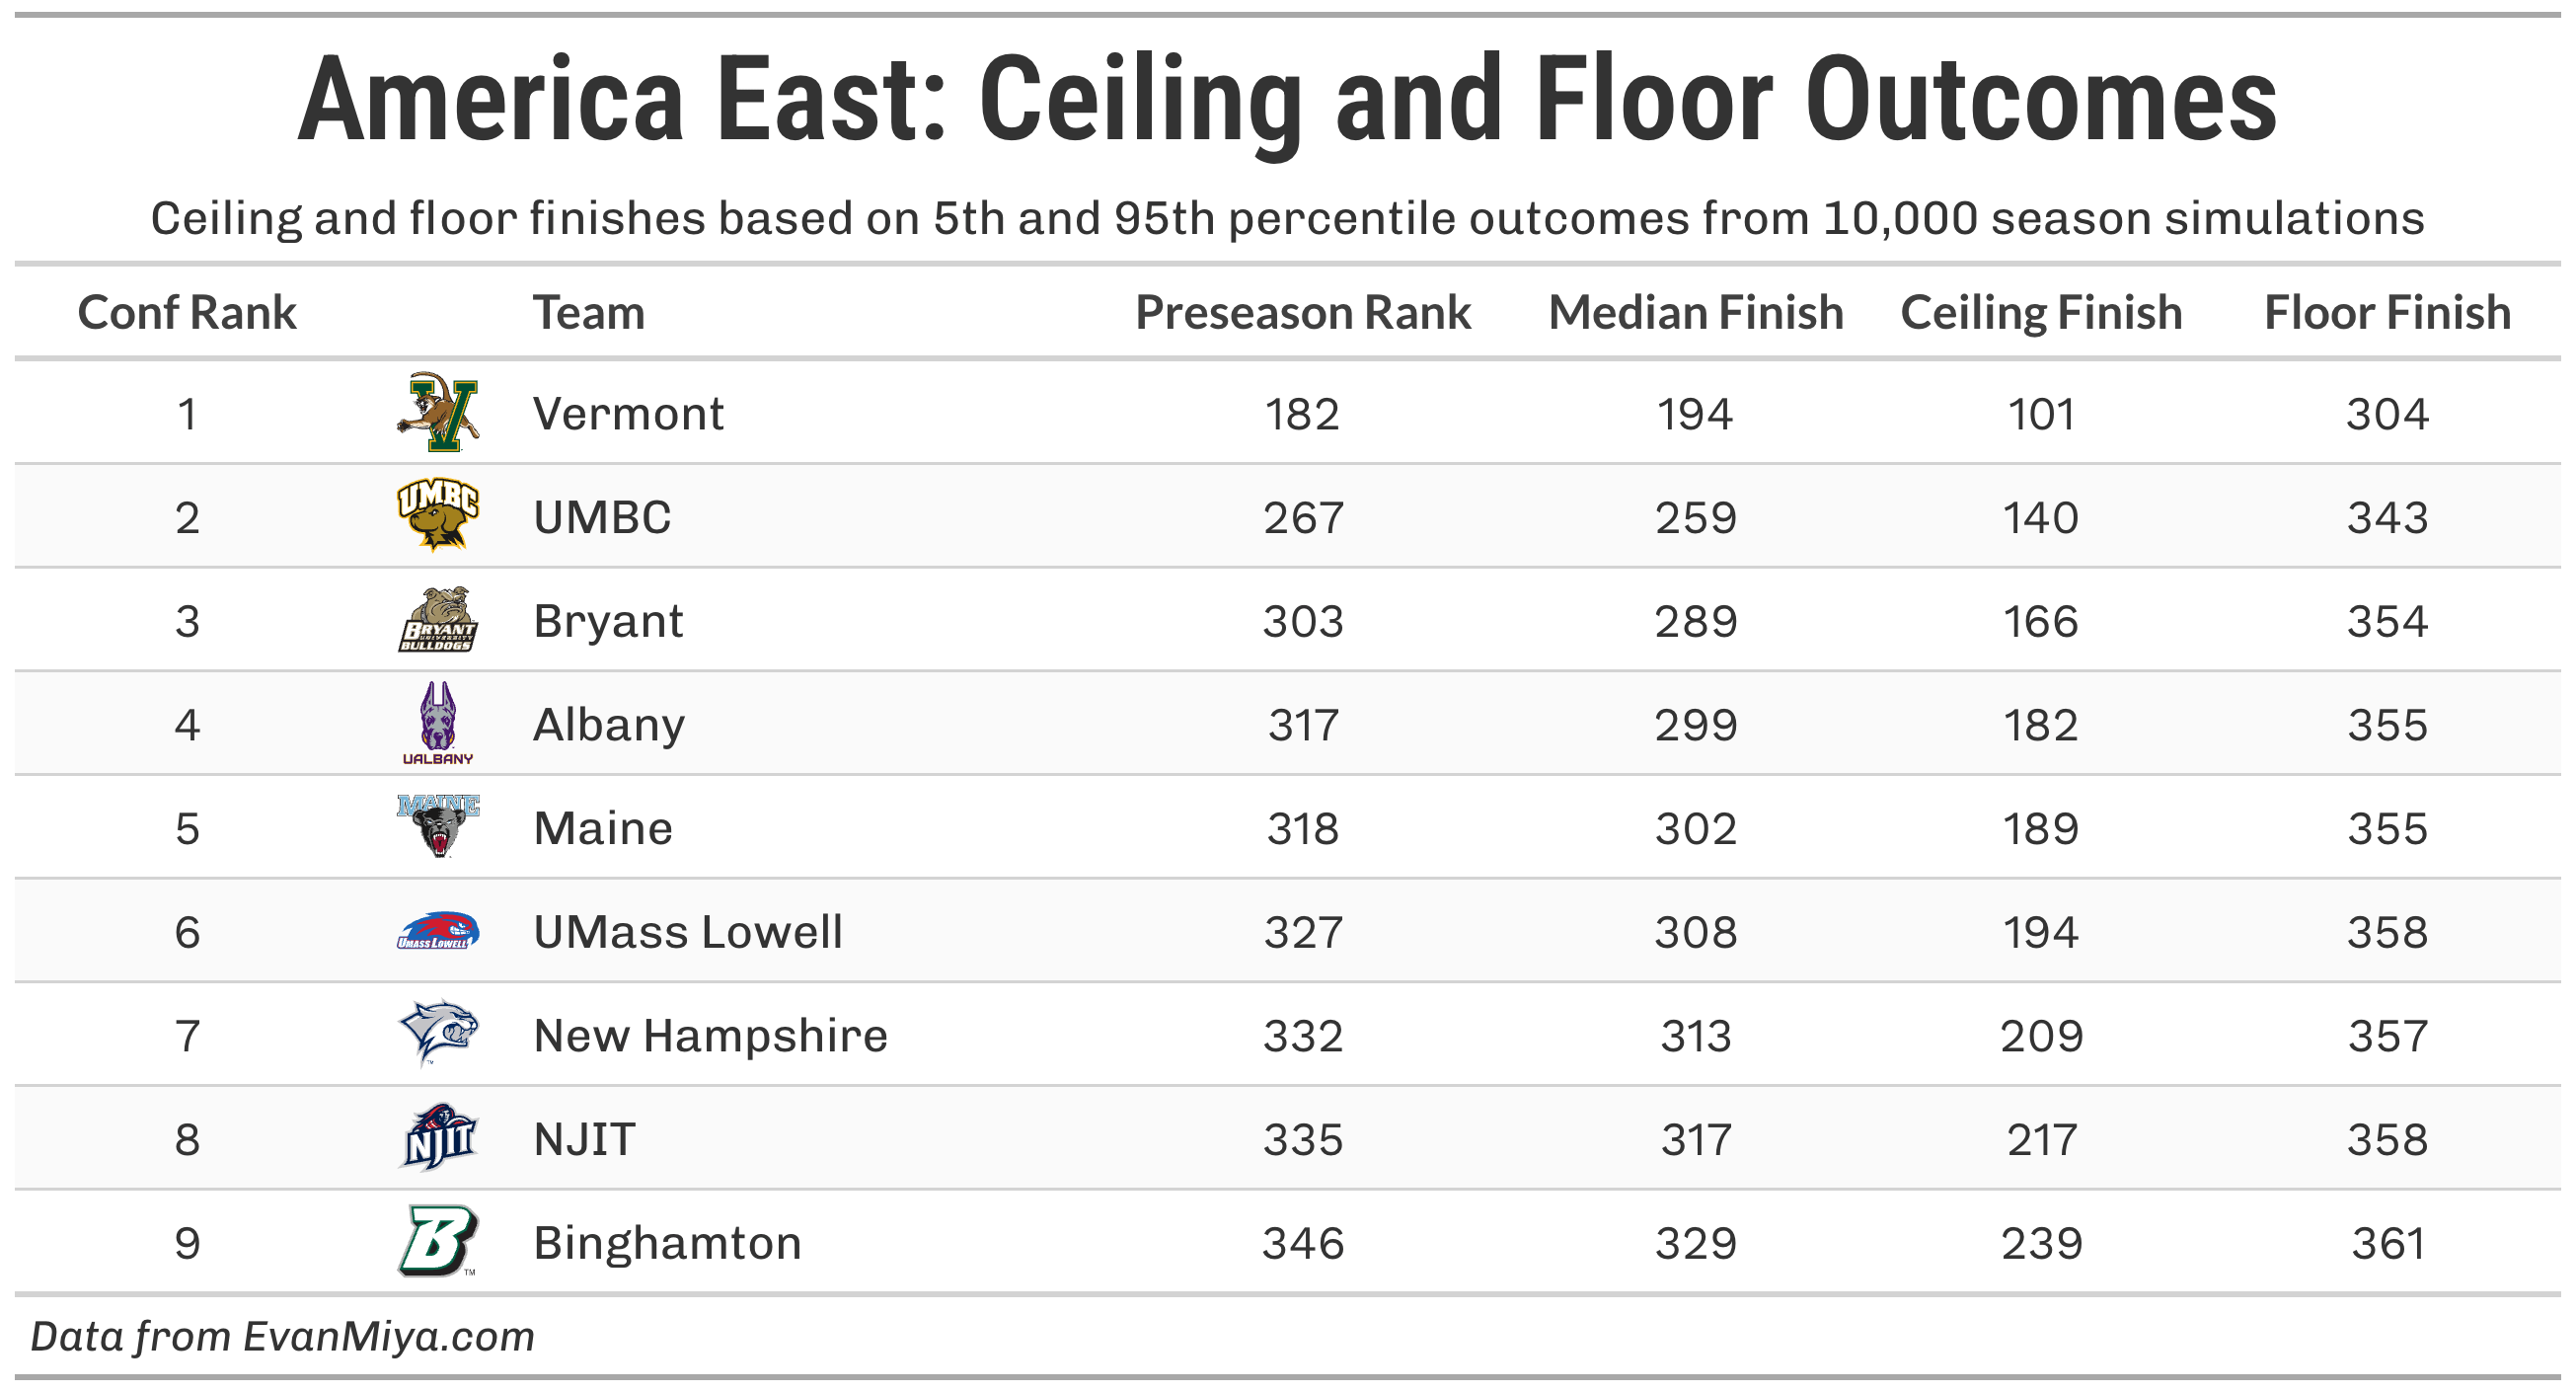
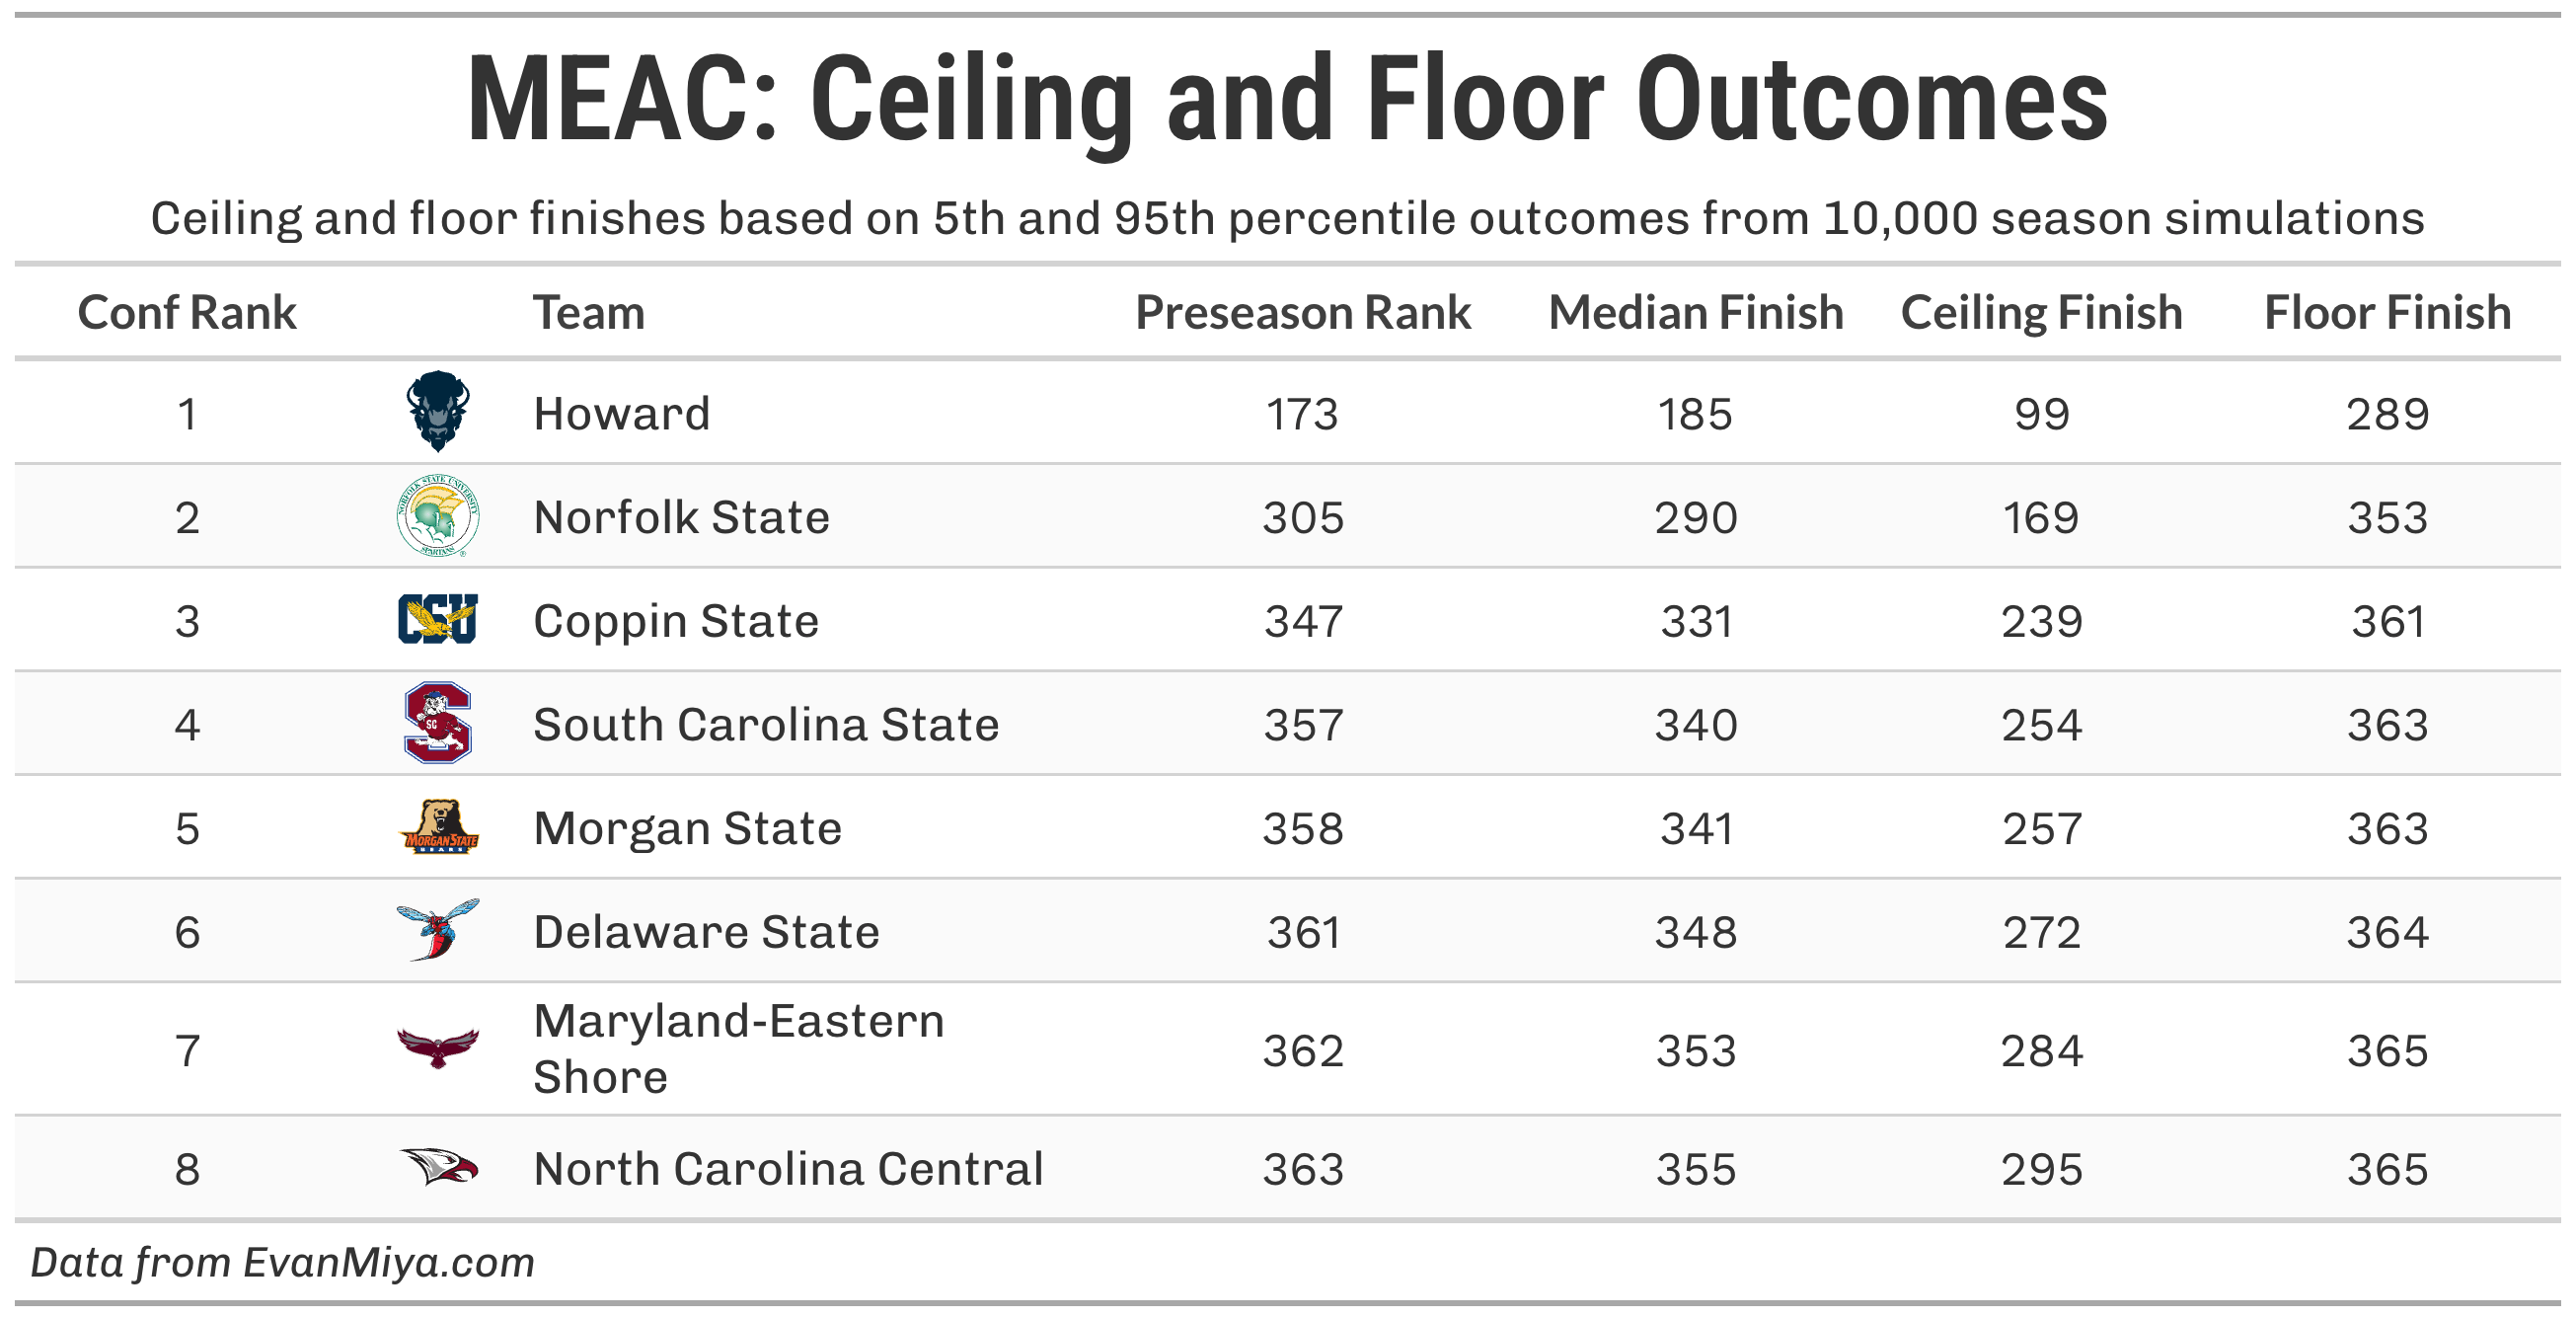
To present this data nationally, I’m breaking it down by conference and showing the median (most likely), ceiling (95th percentile), and floor (5th percentile) outcomes for each team. This means a given team has a 90% chance of finishing the year with a national ranking within its ceiling and floor outcomes.1
First, I want to briefly mention the teams with the highest and lowest preseason uncertainty in my model. The table below shows the teams with the most preseason uncertainty (high-ceiling, low-floor) inside the preseason top 50 at EvanMiya.com:
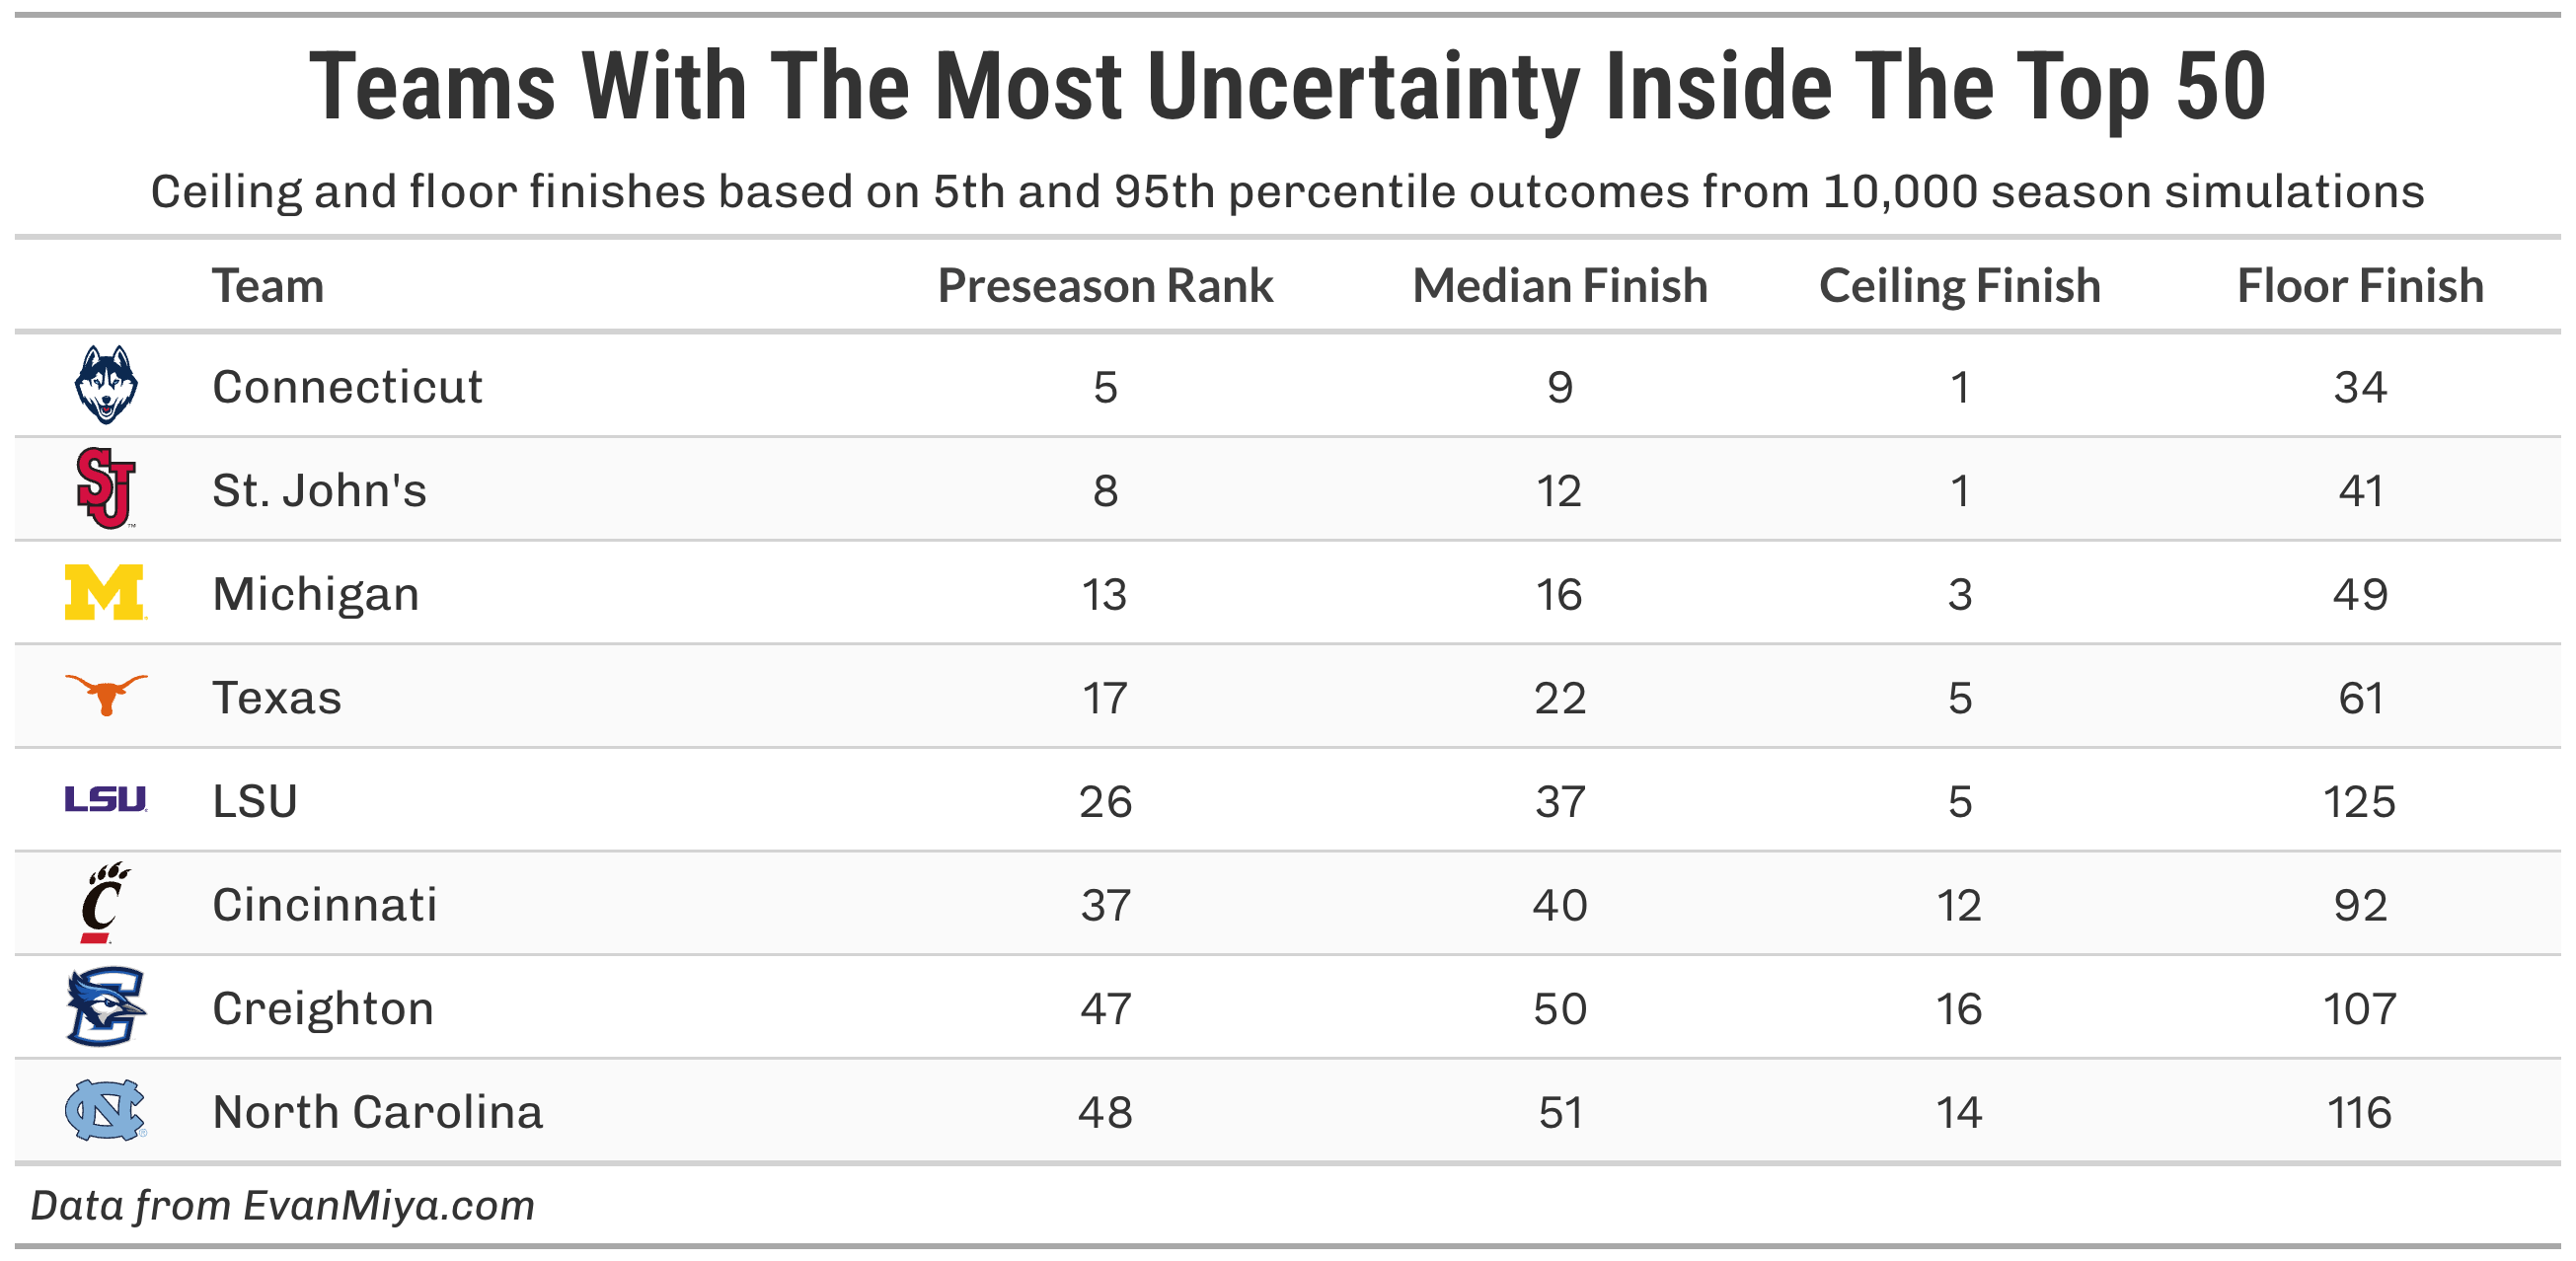
Last year’s group with the most preseason uncertainty included Duke, Kansas, Baylor, Iowa, and Washington, all of which had some wildly unexpected performances.
The table below shows the teams with the least preseason uncertainty (low-ceiling, high-floor) inside the preseason top 50 at EvanMiya.com:
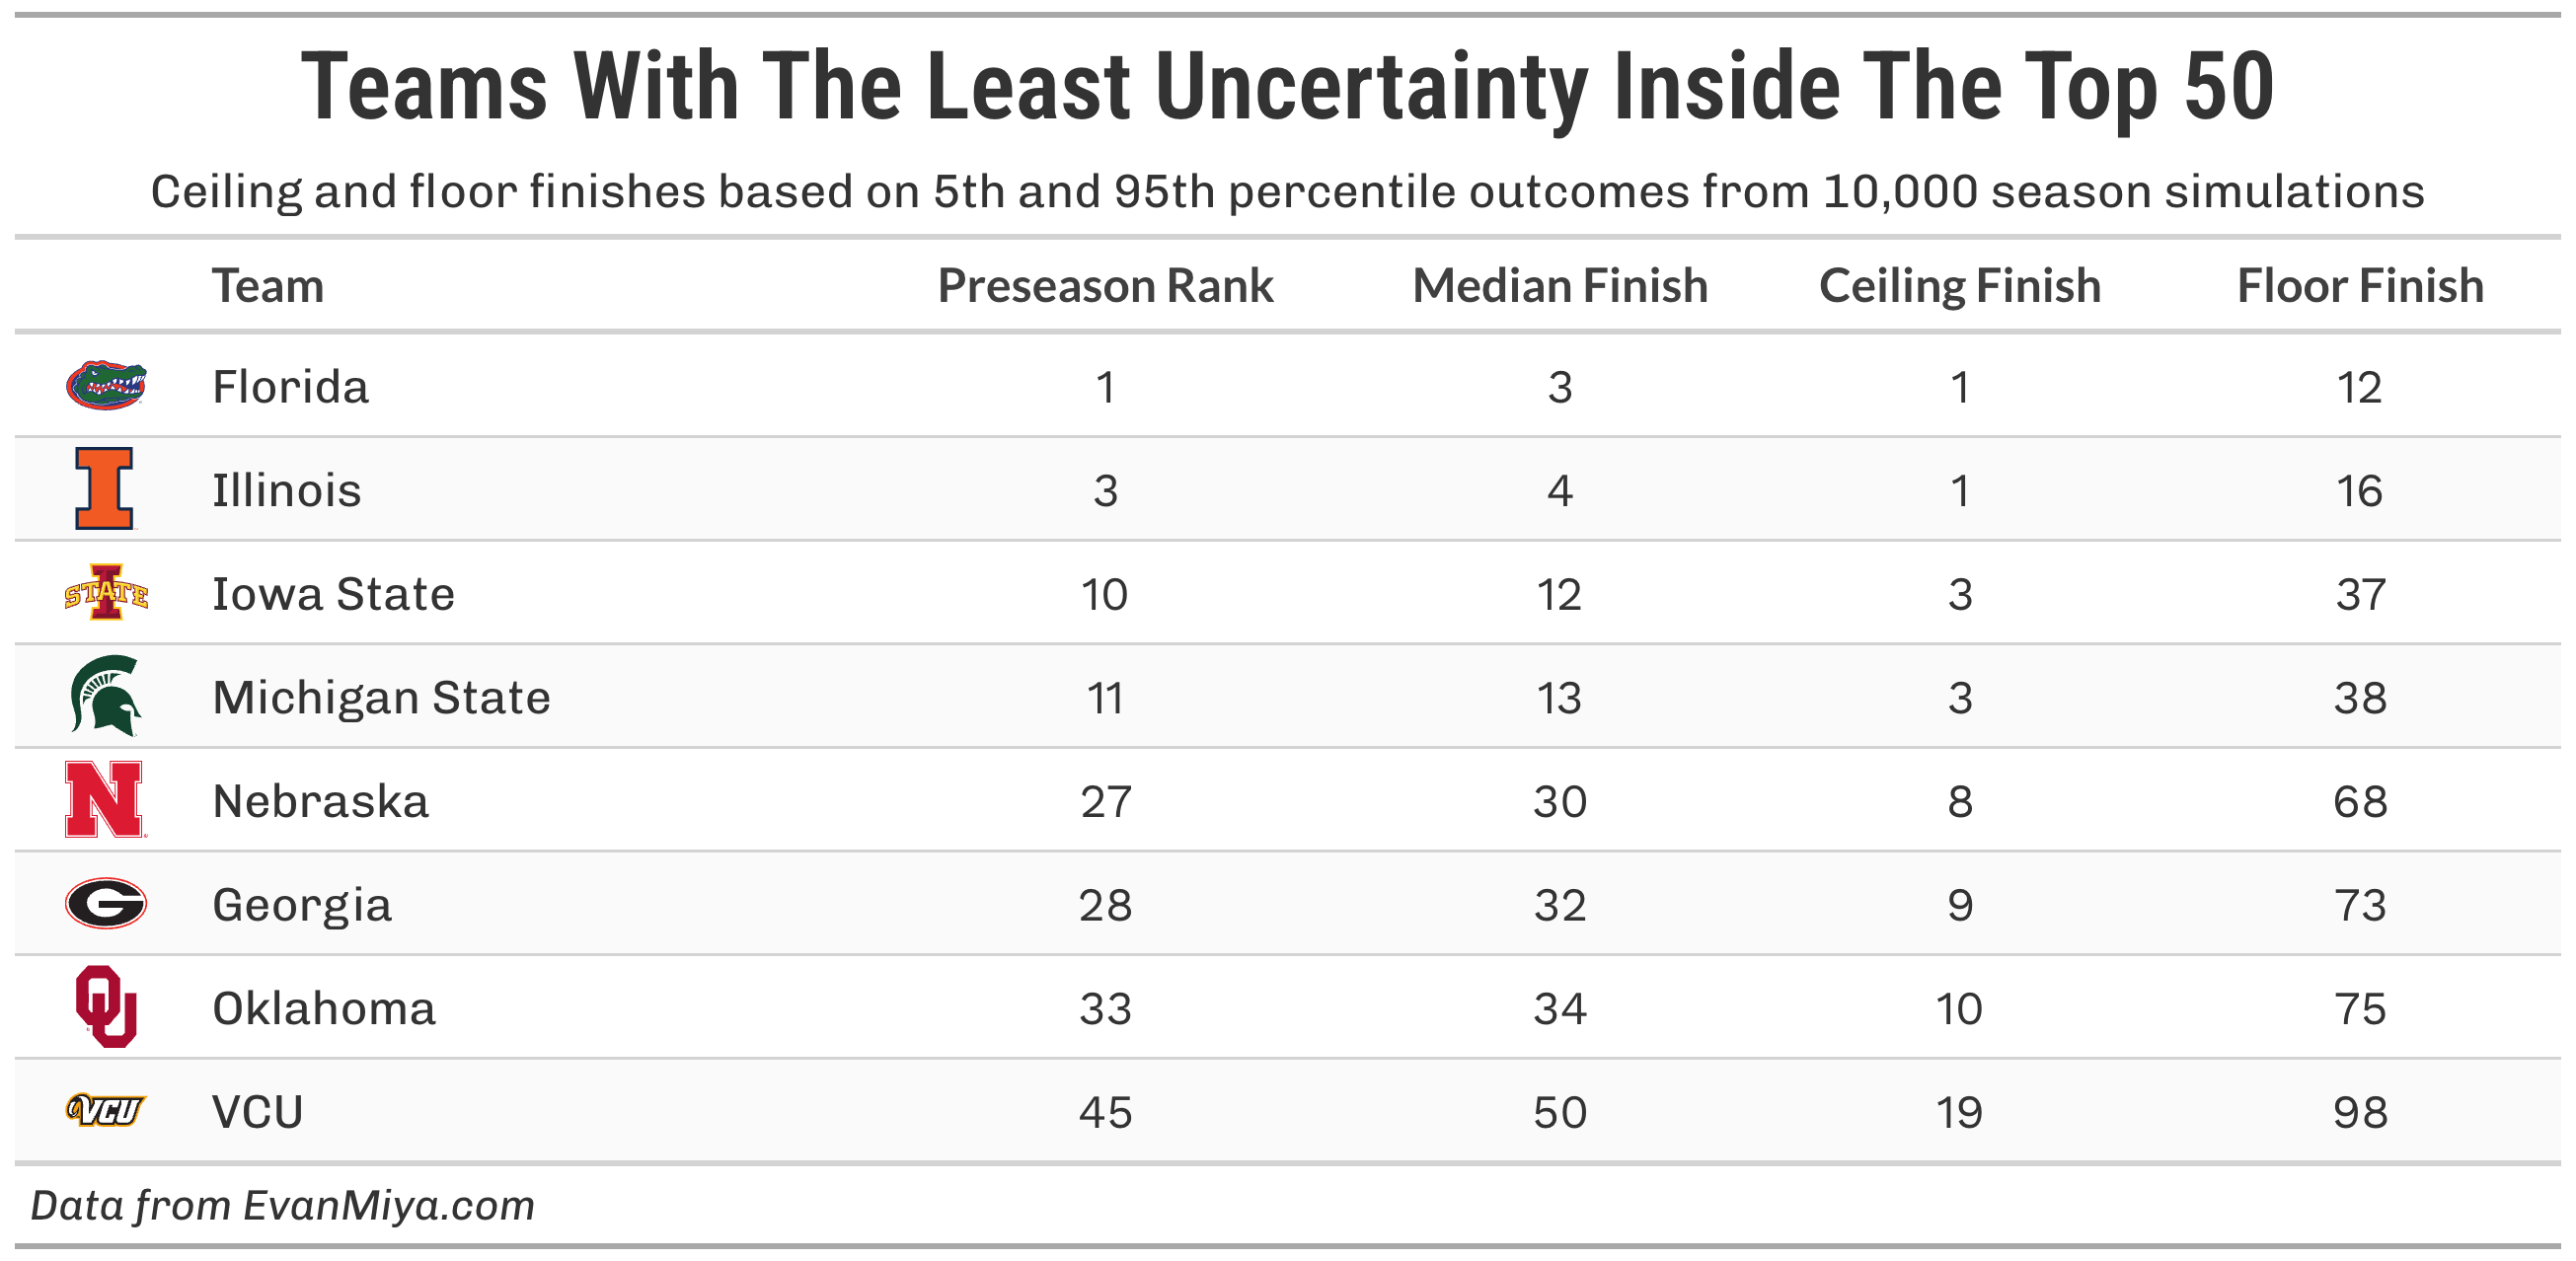
Eight teams have a ceiling finish of #1 in the country: Florida, Duke, Illinois, Arizona, UConn, Kansas, Gonzaga, and St. John’s. While another team can be the best-rated team at the end of the year according to the analytics, it’s much more unlikely than for these eight. In fact, only three times in the last 16 years has a team finished #1 at EvanMiya.com without a #1 preseason ceiling finish (UConn 2022-23, Villanova 2017-18, Gonzaga 2016-17). Let me be clear: a team’s ceiling finish does not reflect its chances of winning a national title. In college basketball, the best team often doesn't win the ultimate trophy at the end of the season.
There were 47 teams that finished #1 in at least one of the 10,000 season simulations: Florida, Duke, Illinois, Arizona, Connecticut, Kansas, Gonzaga, St. John's, Houston, Iowa State, Michigan State, Alabama, Michigan, Texas Tech, Louisville, Miami (Fla.), Texas, Tennessee, Kentucky, Virginia, Arkansas, UCLA, Purdue, Auburn, BYU, LSU, Nebraska, Georgia, Baylor, Villanova, Marquette, Vanderbilt, Oklahoma, Ohio State, Wisconsin, Texas A&M, Cincinnati, NC State, USC, West Virginia, Maryland, Indiana, North Carolina, Oregon, SMU, Oklahoma State, and Syracuse.
Here are the teams presented by conference, from best conference to worst, according to the preseason conference strength rankings at EvanMiya.com:
1. SEC
2. Big 12
3. Big Ten
4. Big East
5. ACC
6. Pac-12
7. Mountain West
8. Atlantic 10
9. American
10. WCC
11. Missouri Valley
12. MAC
13. C-USA
14. Big West
15. Ivy League
16. Big South
17. CAA
18. SoCon
19. Summit League
20. Big Sky
21. Southland
22. Sun Belt
23. Atlantic Sun
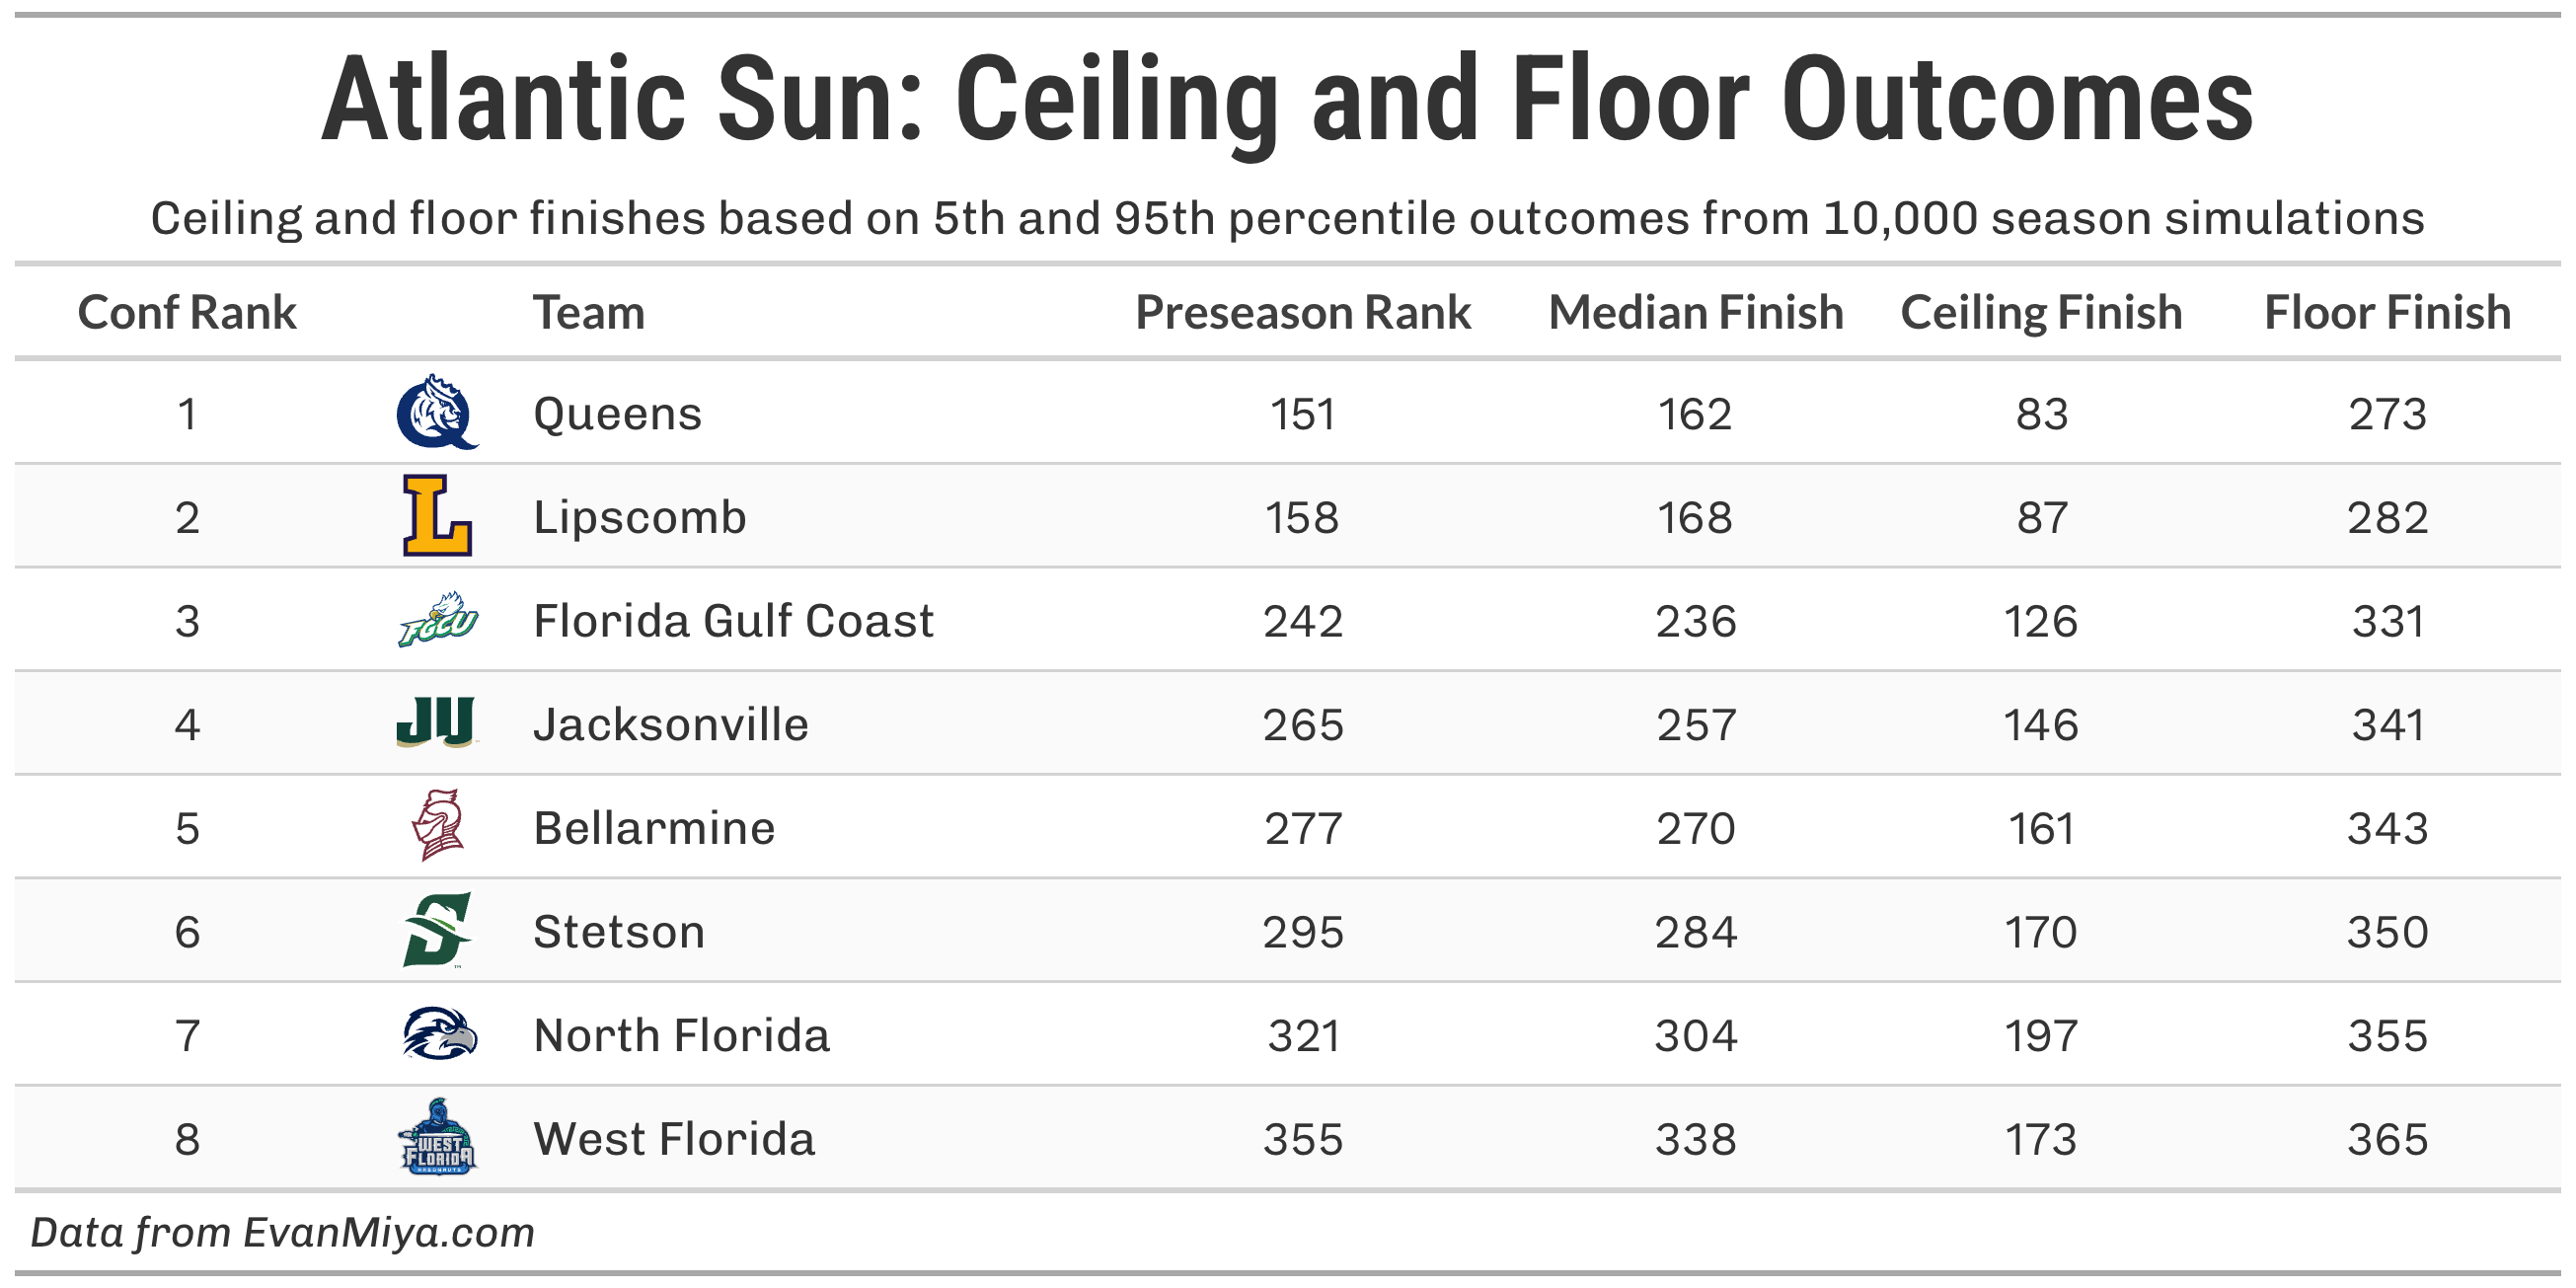
24. Horizon
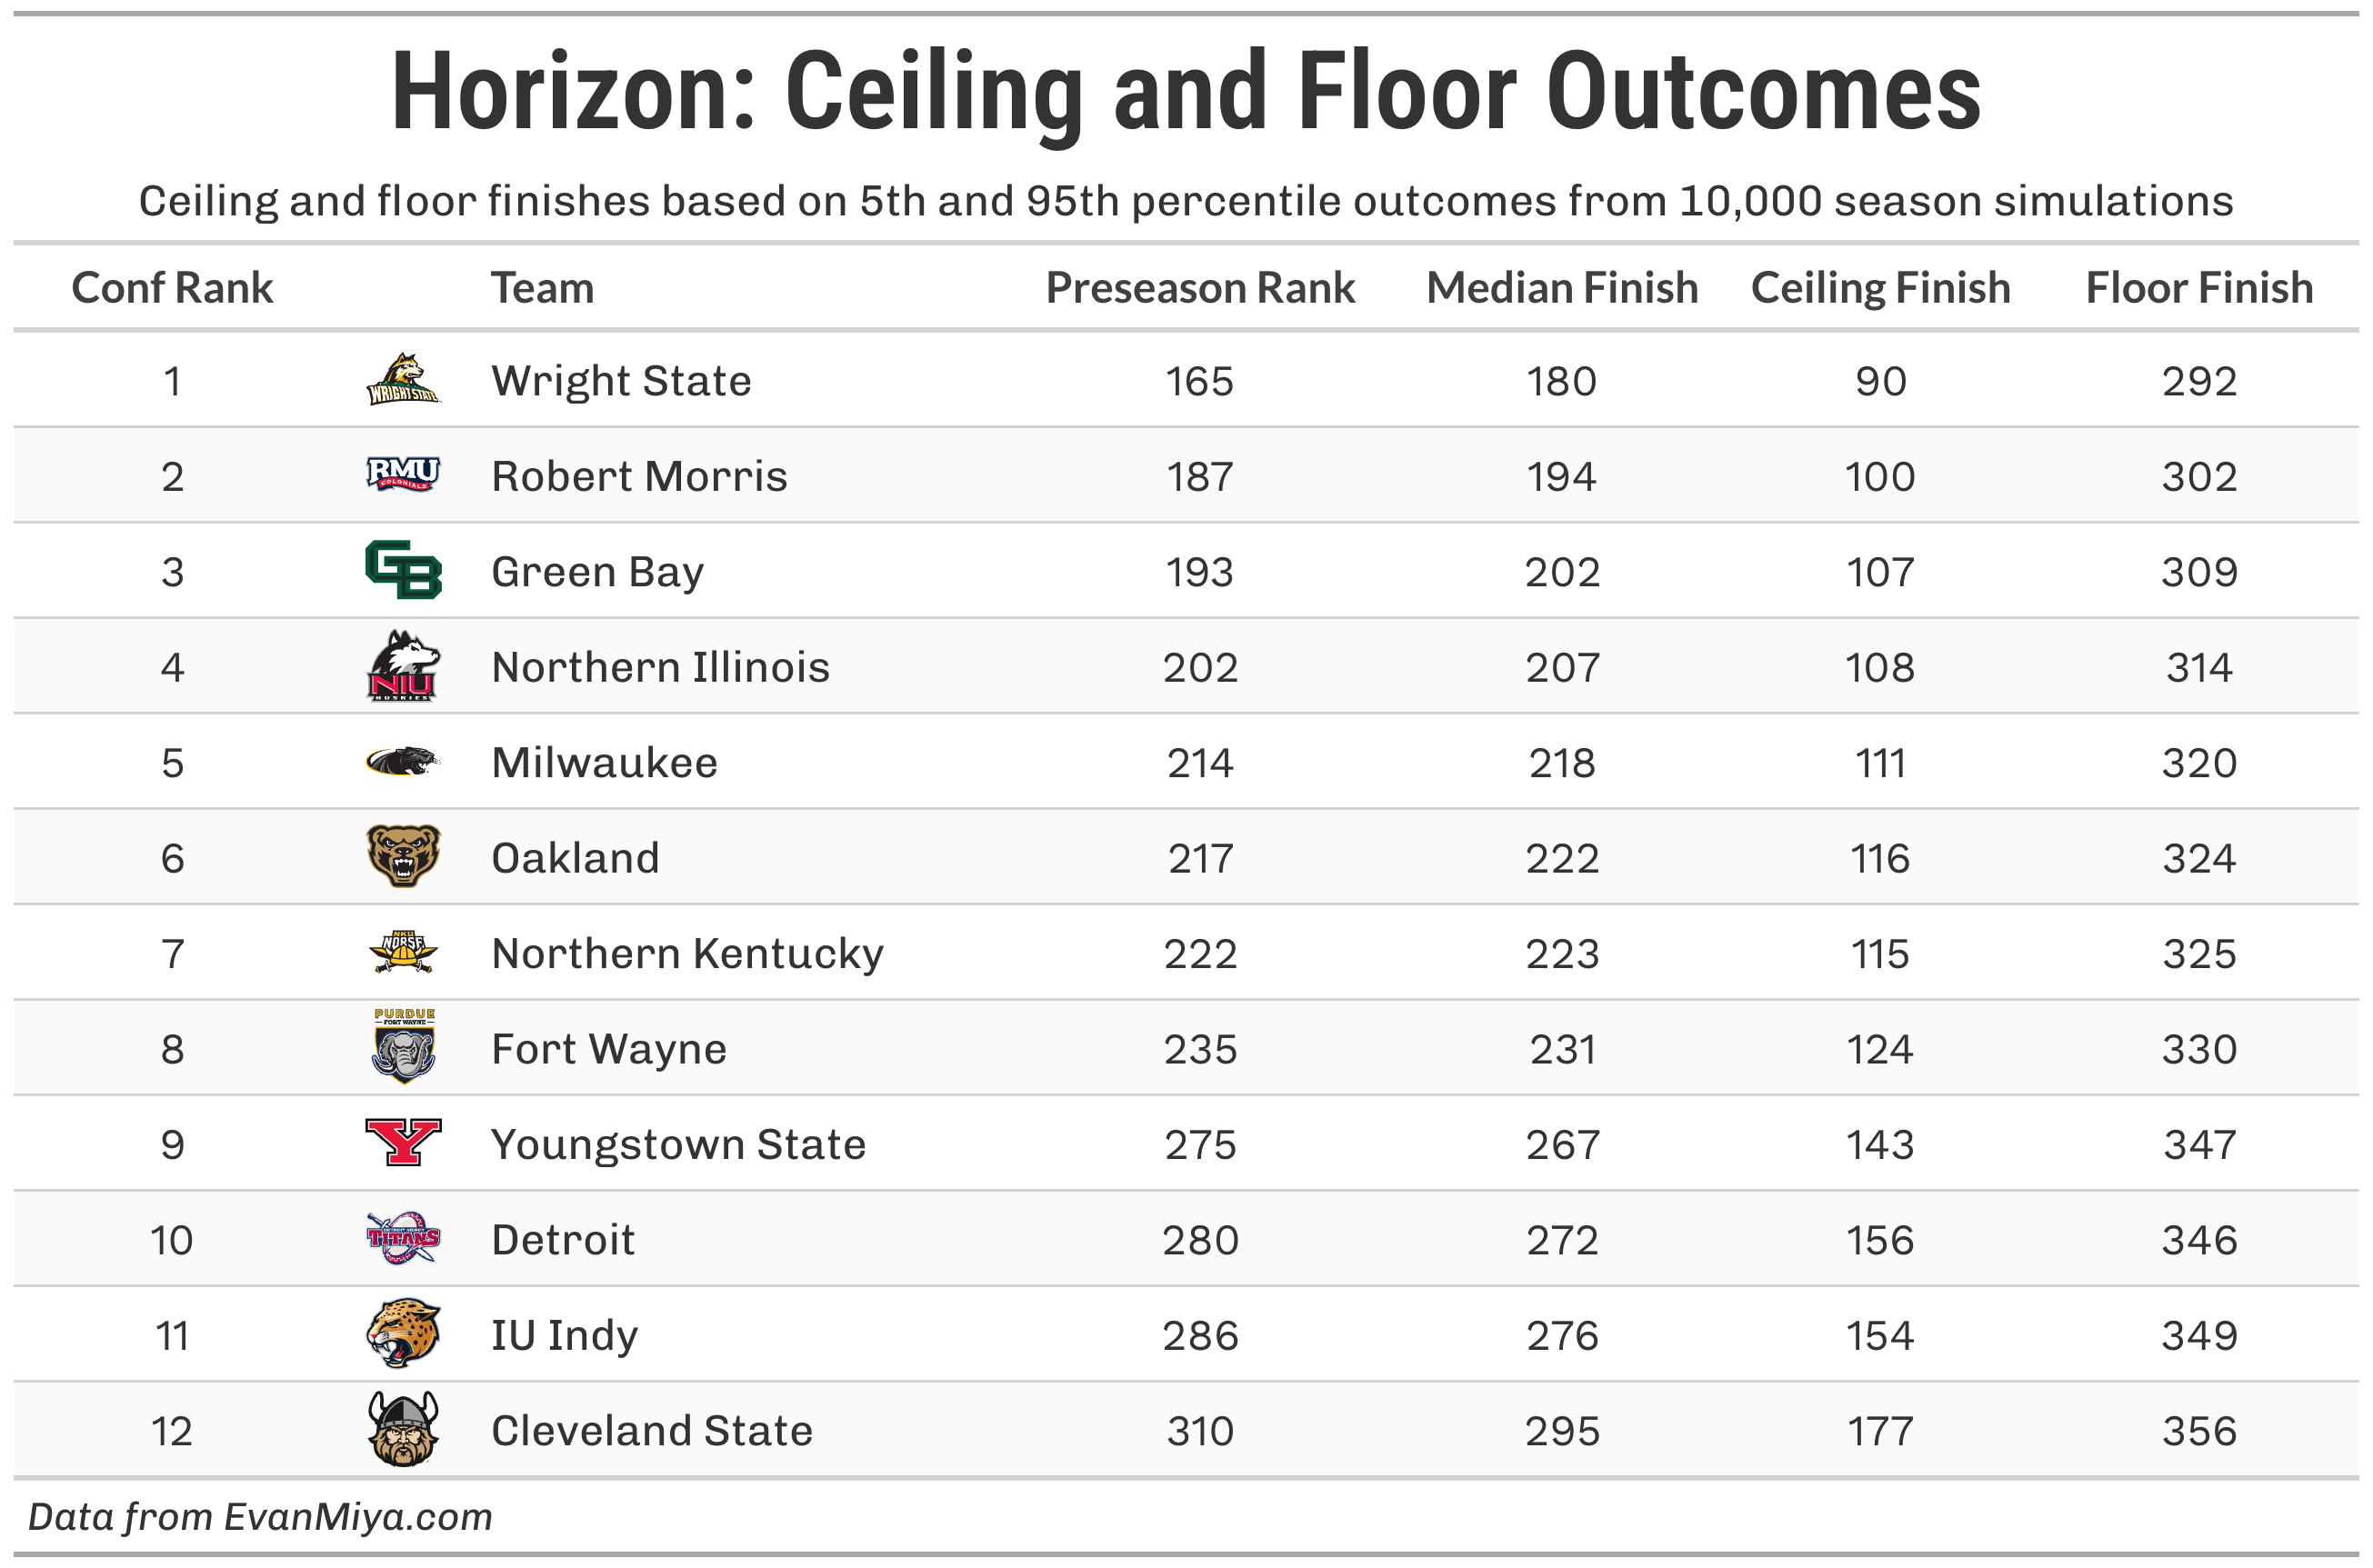
25. UAC
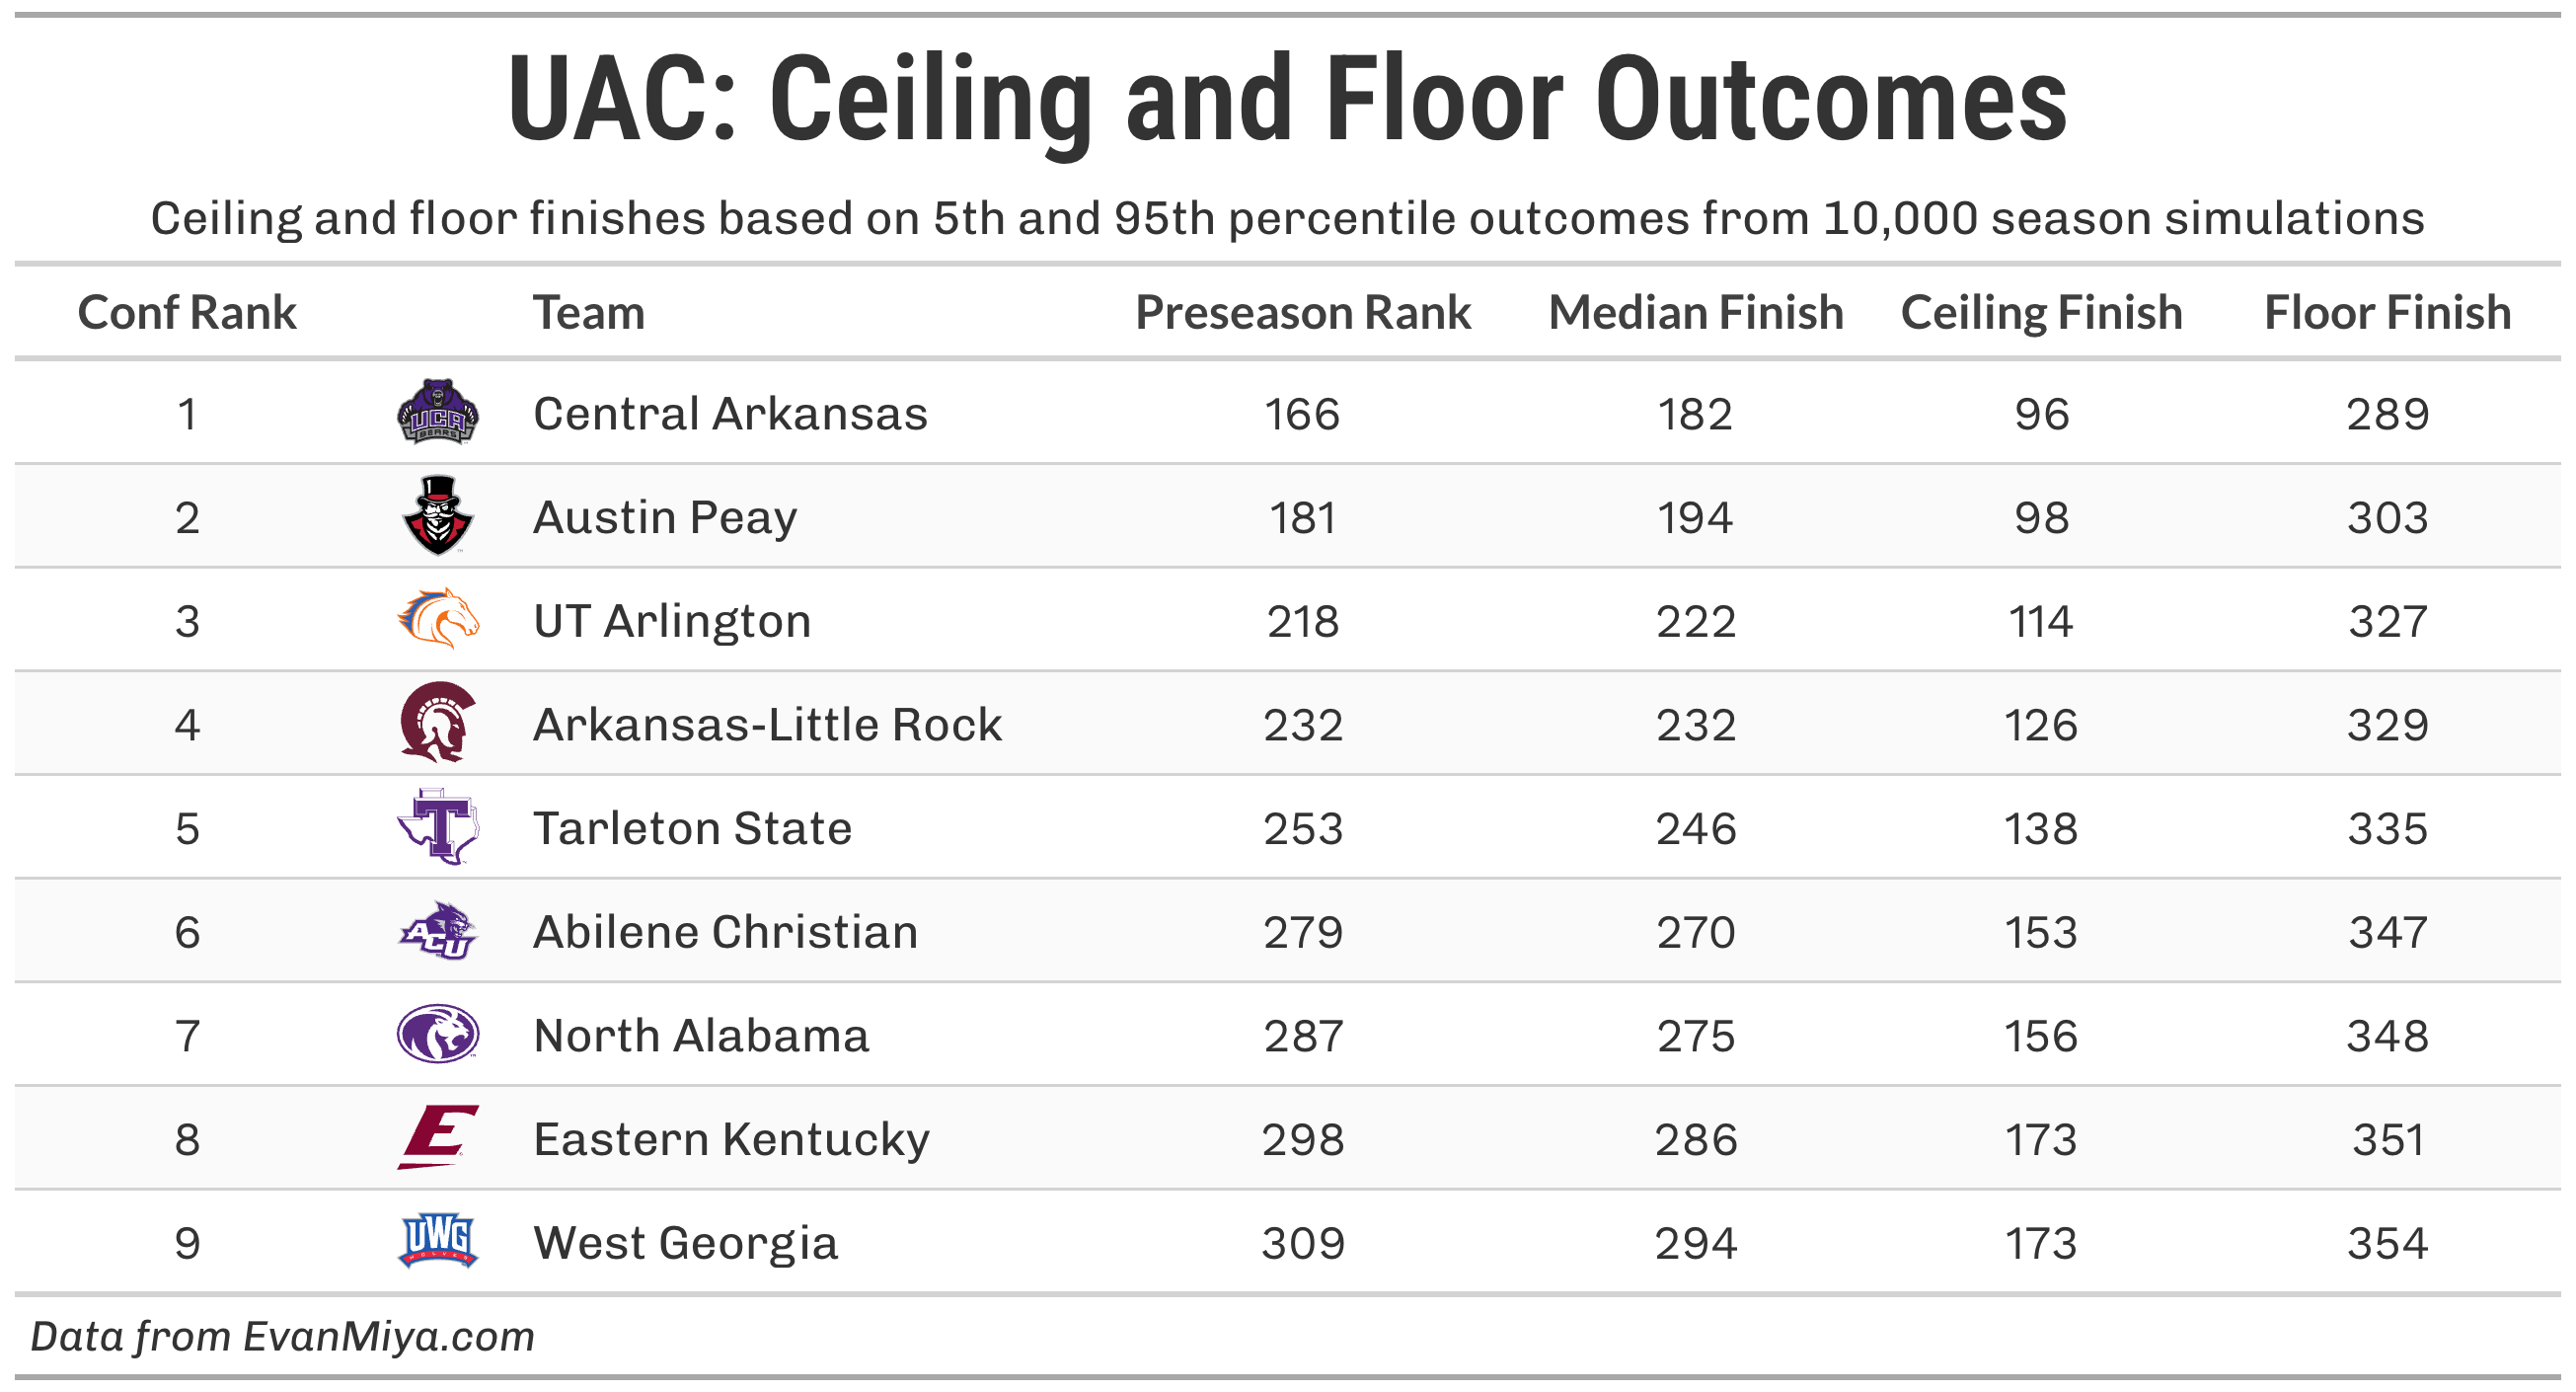
26. Metro
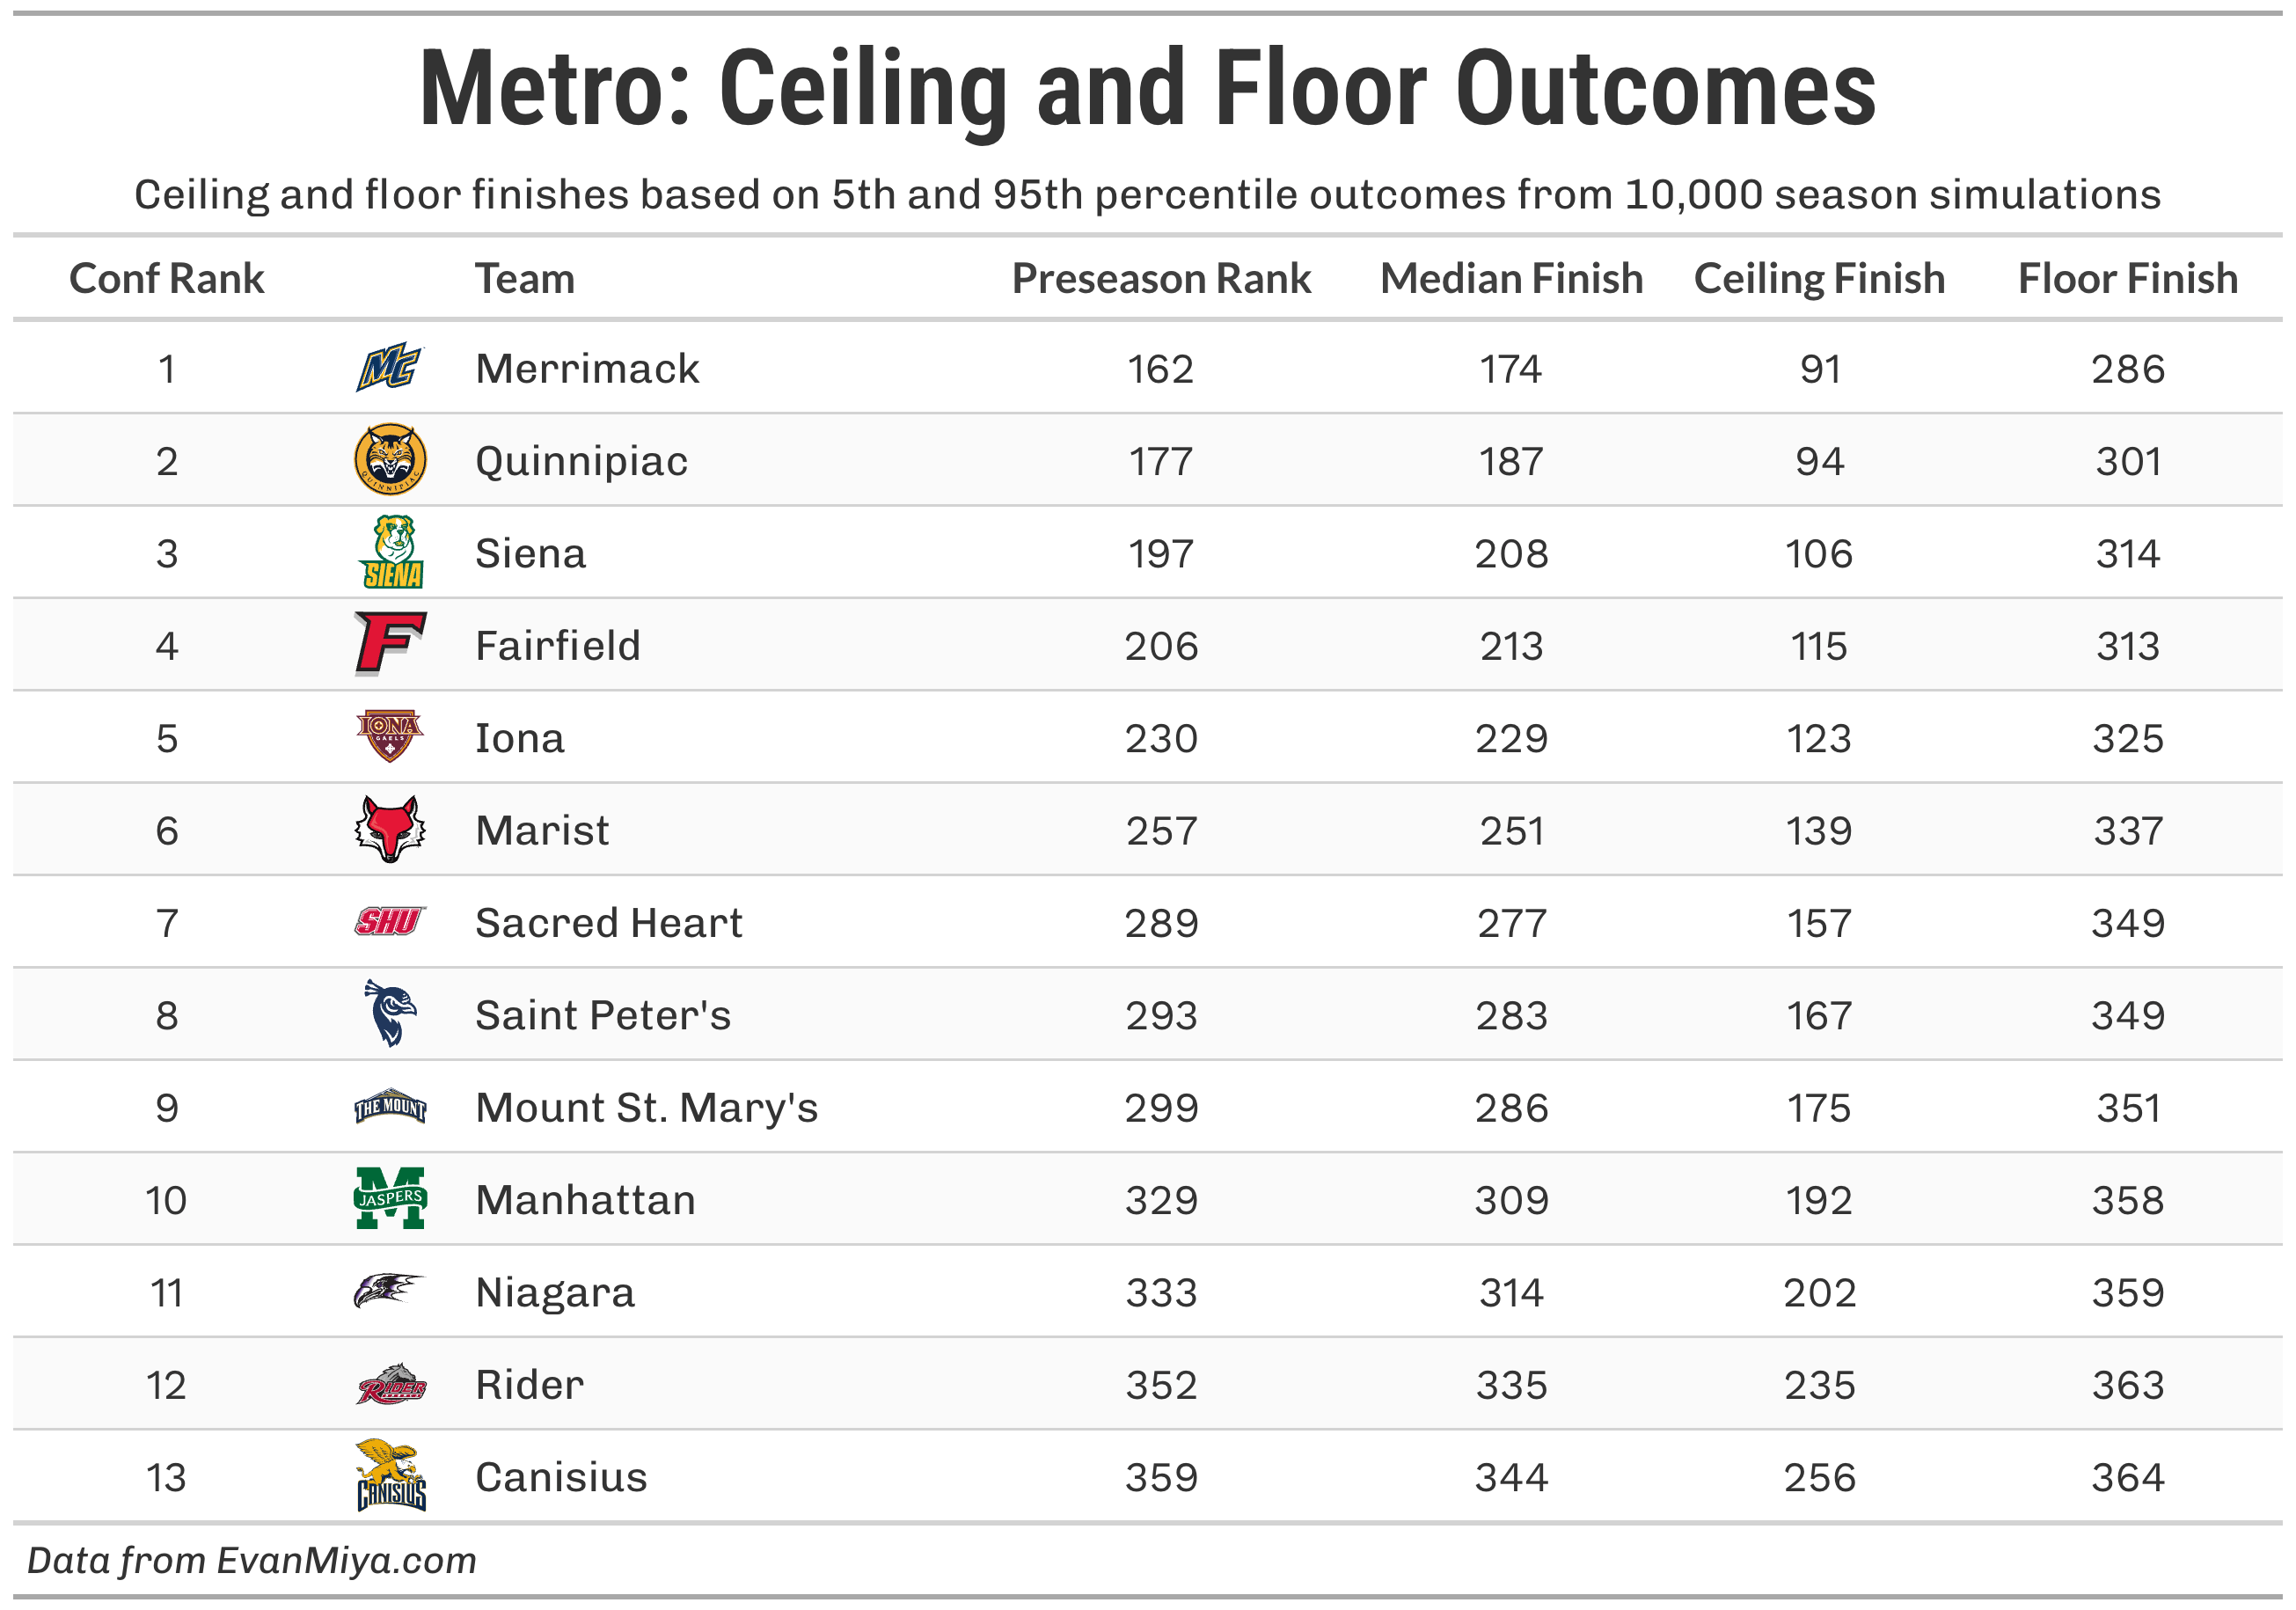
27. Patriot
28. Ohio Valley
29. America East
30. MEAC
31. SWAC
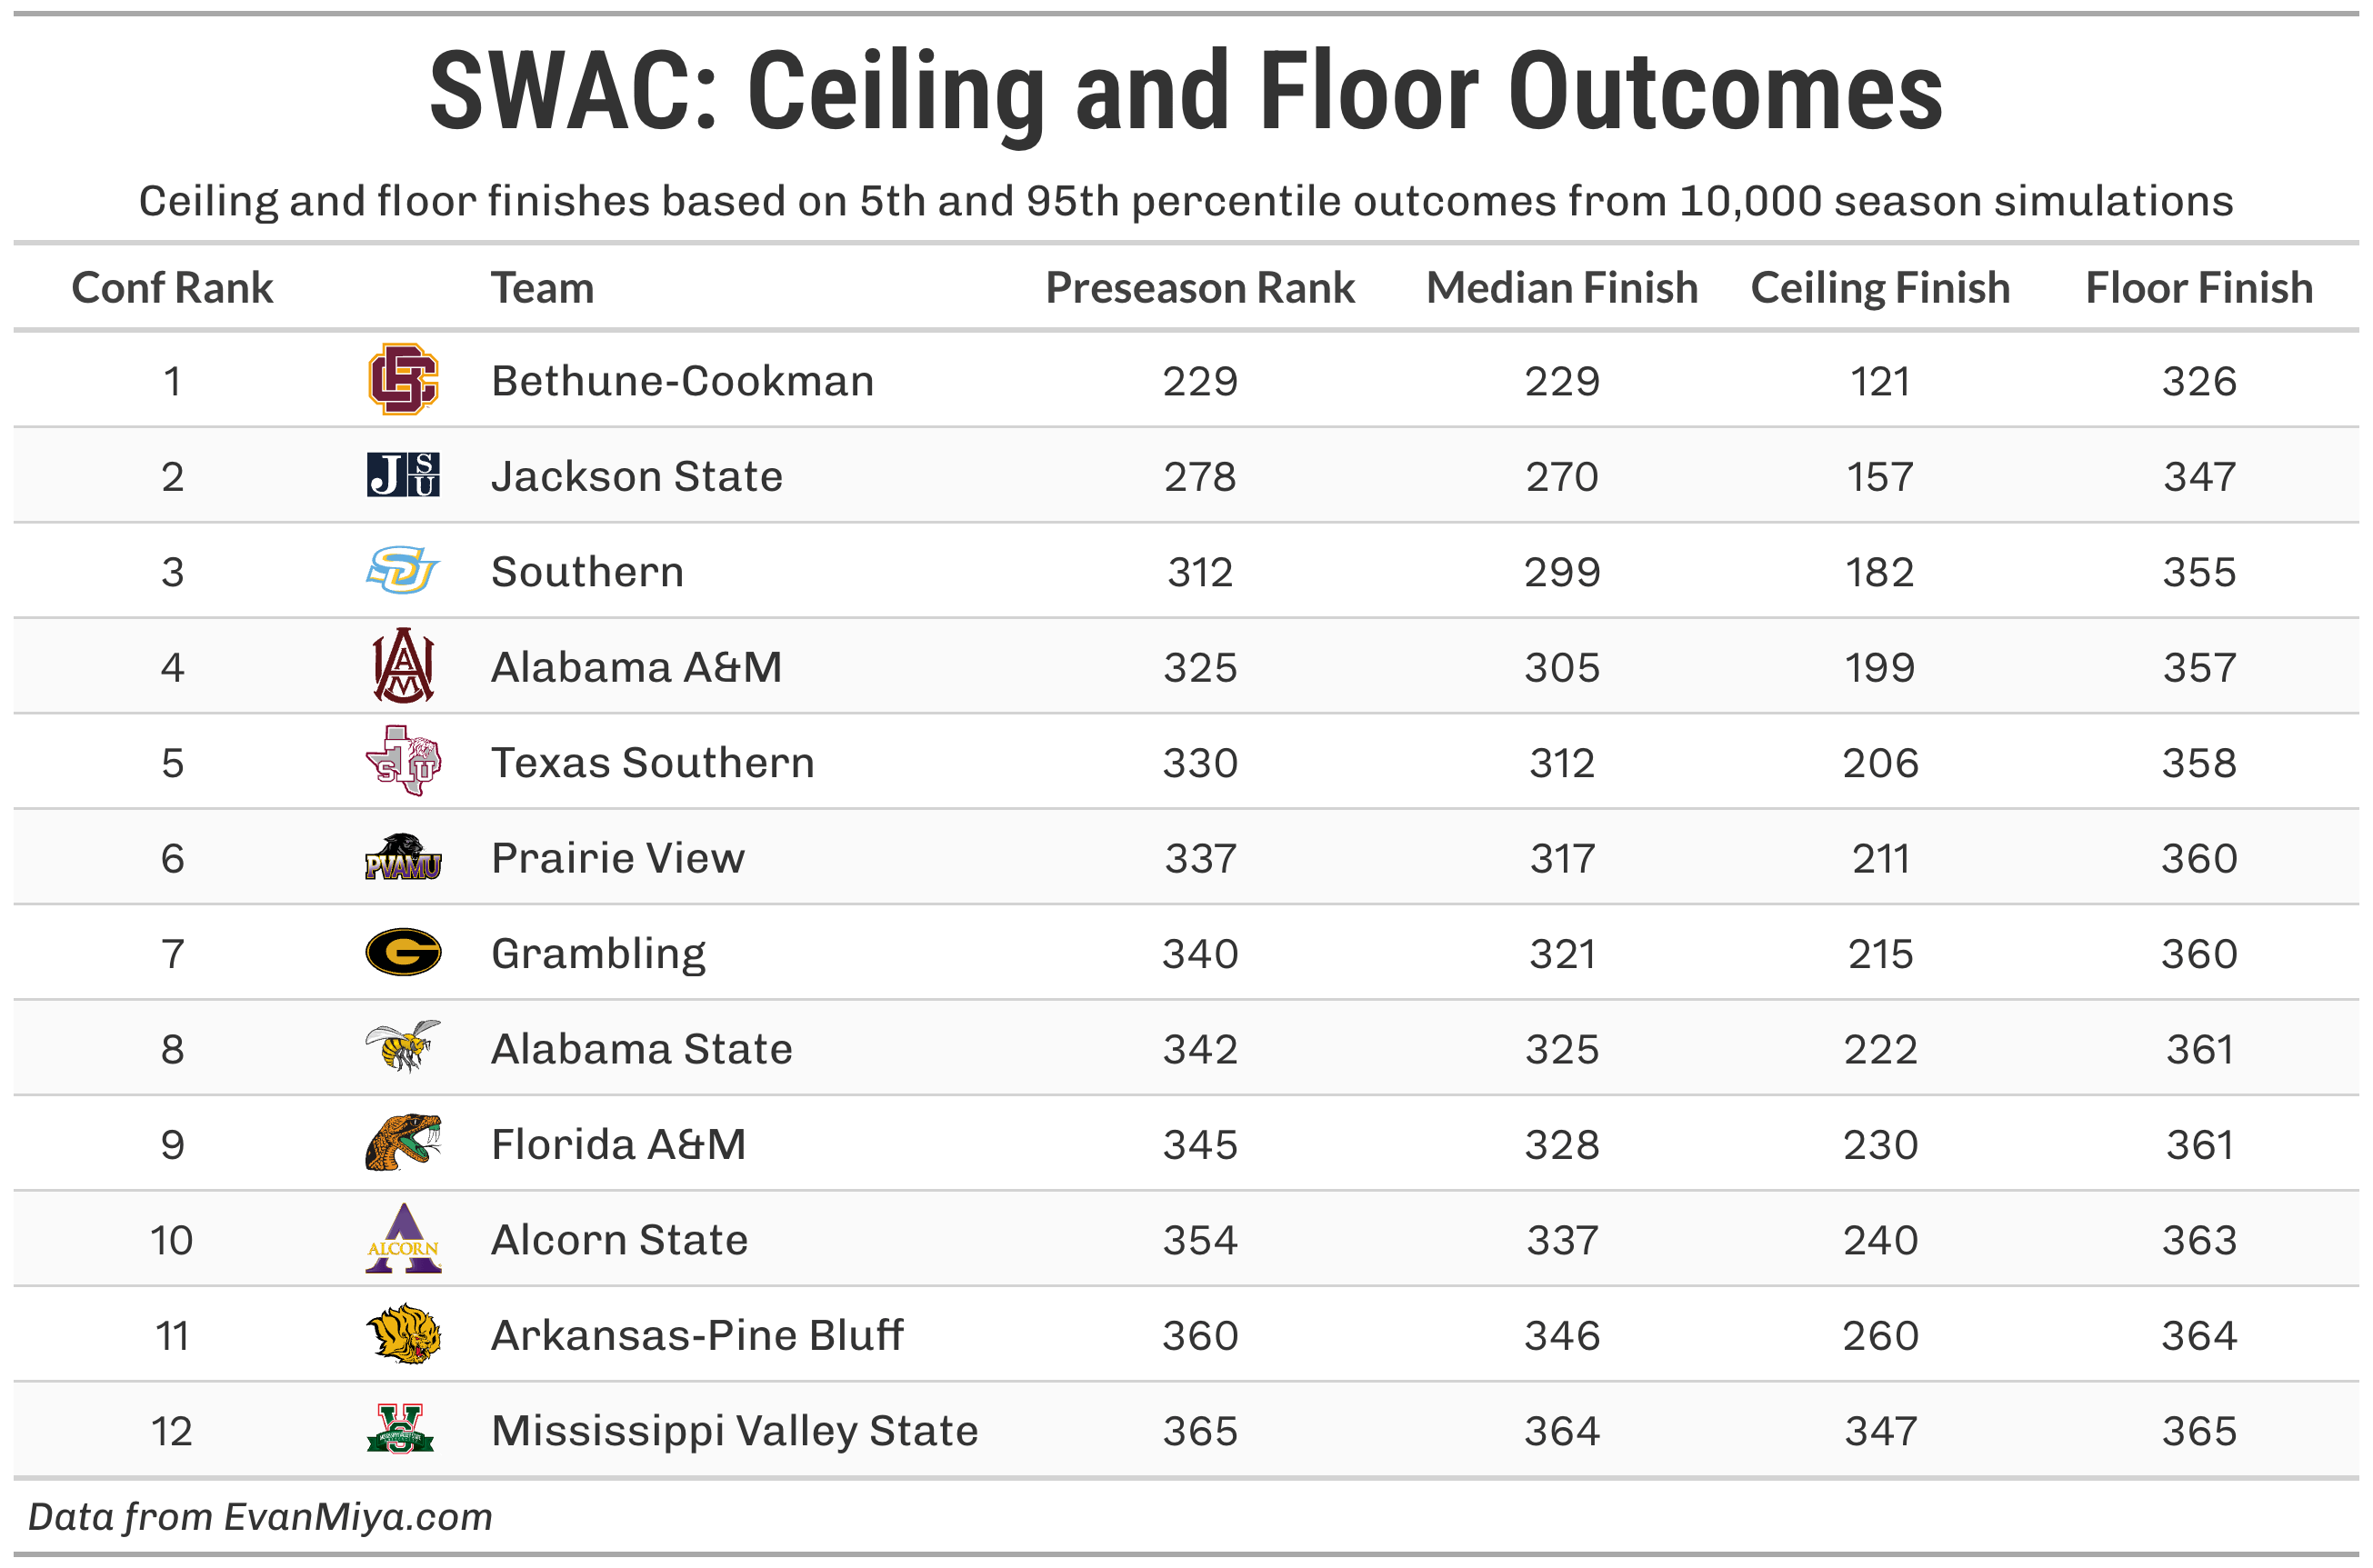
32. NEC
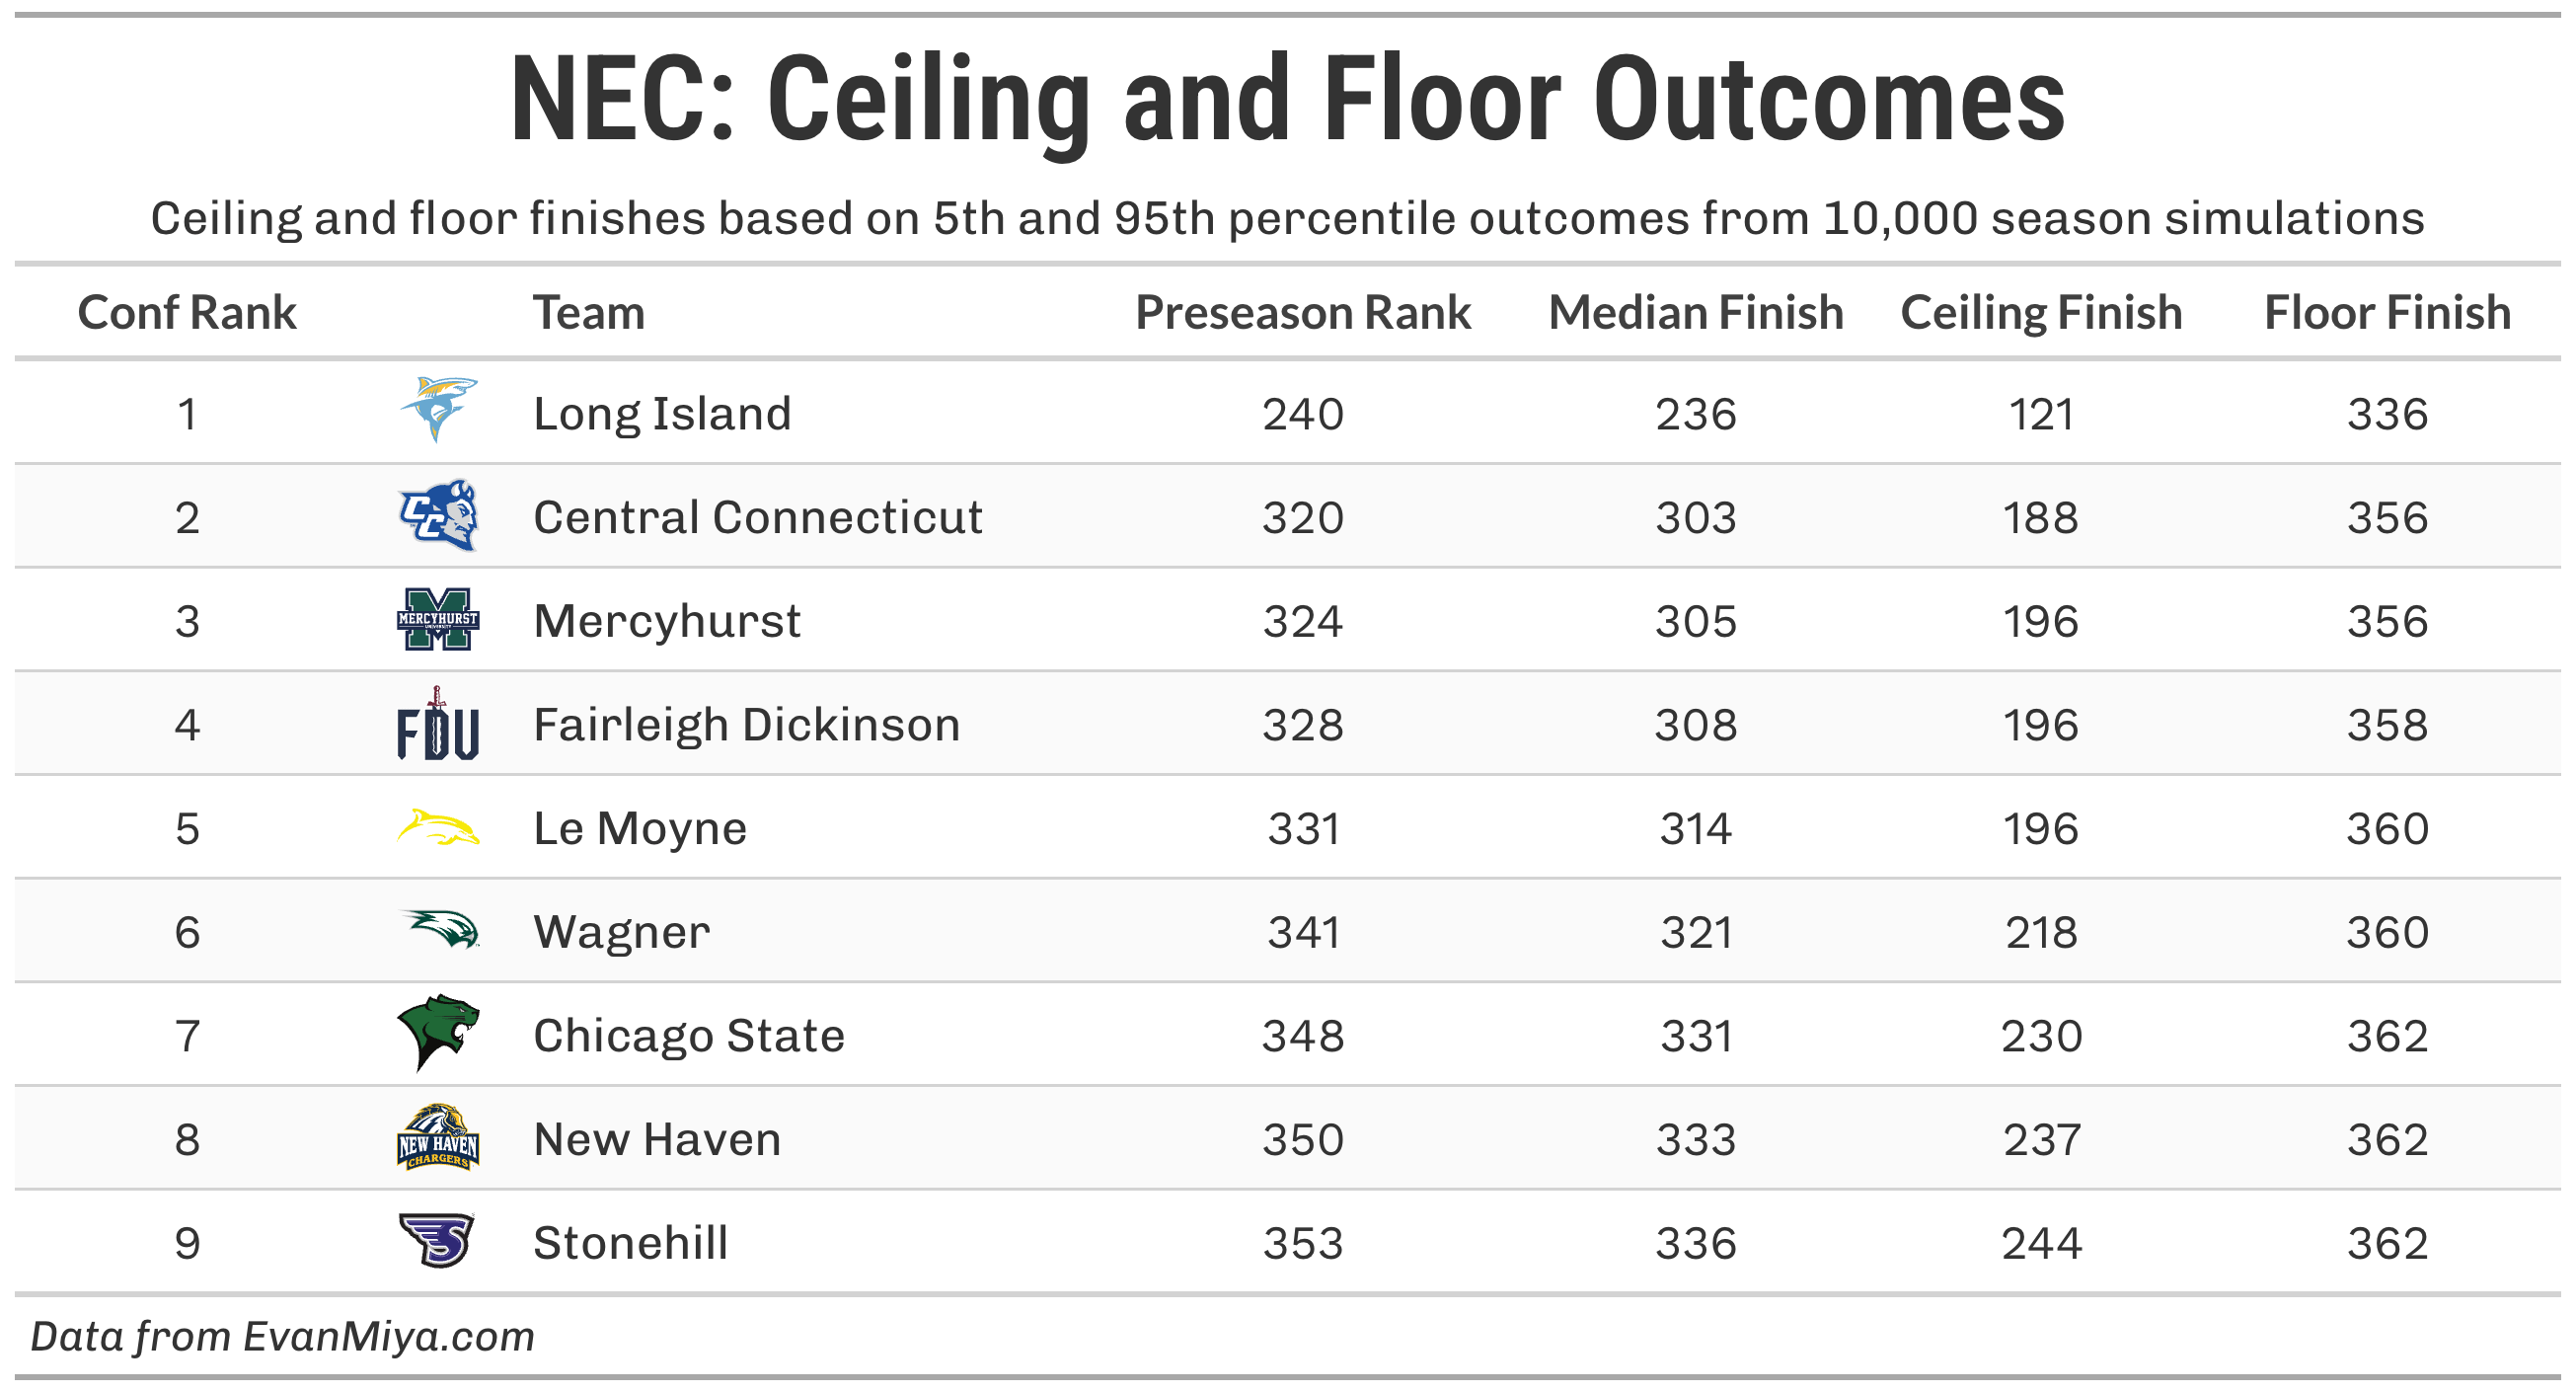
Last year, 16/365 teams (4.4%) finished outside their preseason ceiling/floor range. Teams that finished better than their range: Nebraska, Saint Louis, Tulsa, Hofstra, UTRGV, and Central Arkansas. Teams that finished worse than their range: Oregon, Mississippi State, Loyola, North Alabama, UTSA, Rider, VMI, Gardner-Webb, Missouri-KC, and Western Illinois.
I must be misunderstanding something about the methodology. How does Duke have a ceiling of 1 and a floor of 15 (the second-smallest range in the country, at quick glance) yet not make the "Teams With The Least Uncertainty" table at the top?