

How To Build A CBB Roster In 2025
A study on the roster construction strategies that lead to success for high majors

There is more roster turnover than ever in college basketball. In the 2024-25 season, only 42% of the on-court minutes in Division 1 were played by returning players on the same team from the previous season. It’s the first time in history that more than half of the minutes in D1 were allocated to newly rostered players.
It’s an even bigger deal at the high-major level, as teams with huge NIL budgets can overhaul any roster with new players through the transfer portal if they are willing to invest enough money. There were six high-major teams in 2024-25 that returned zero minutes from their previous roster, a feat never attempted in years past.
Teams are utilizing the transfer portal more than ever this offseason. Last year, there were 1653 completed transfers in Division 1, according to data at EvanMiya.com. Less than a month into the portal being open this offseason, there are already more than 2,300 student-athletes in the portal. The changing climate has sparked numerous discussions on the best approach to building rosters in the modern portal era. While the portal provides every coach with the opportunity to completely rebuild in a single summer, questions have been raised about whether transfer-reliant teams are actually effective.
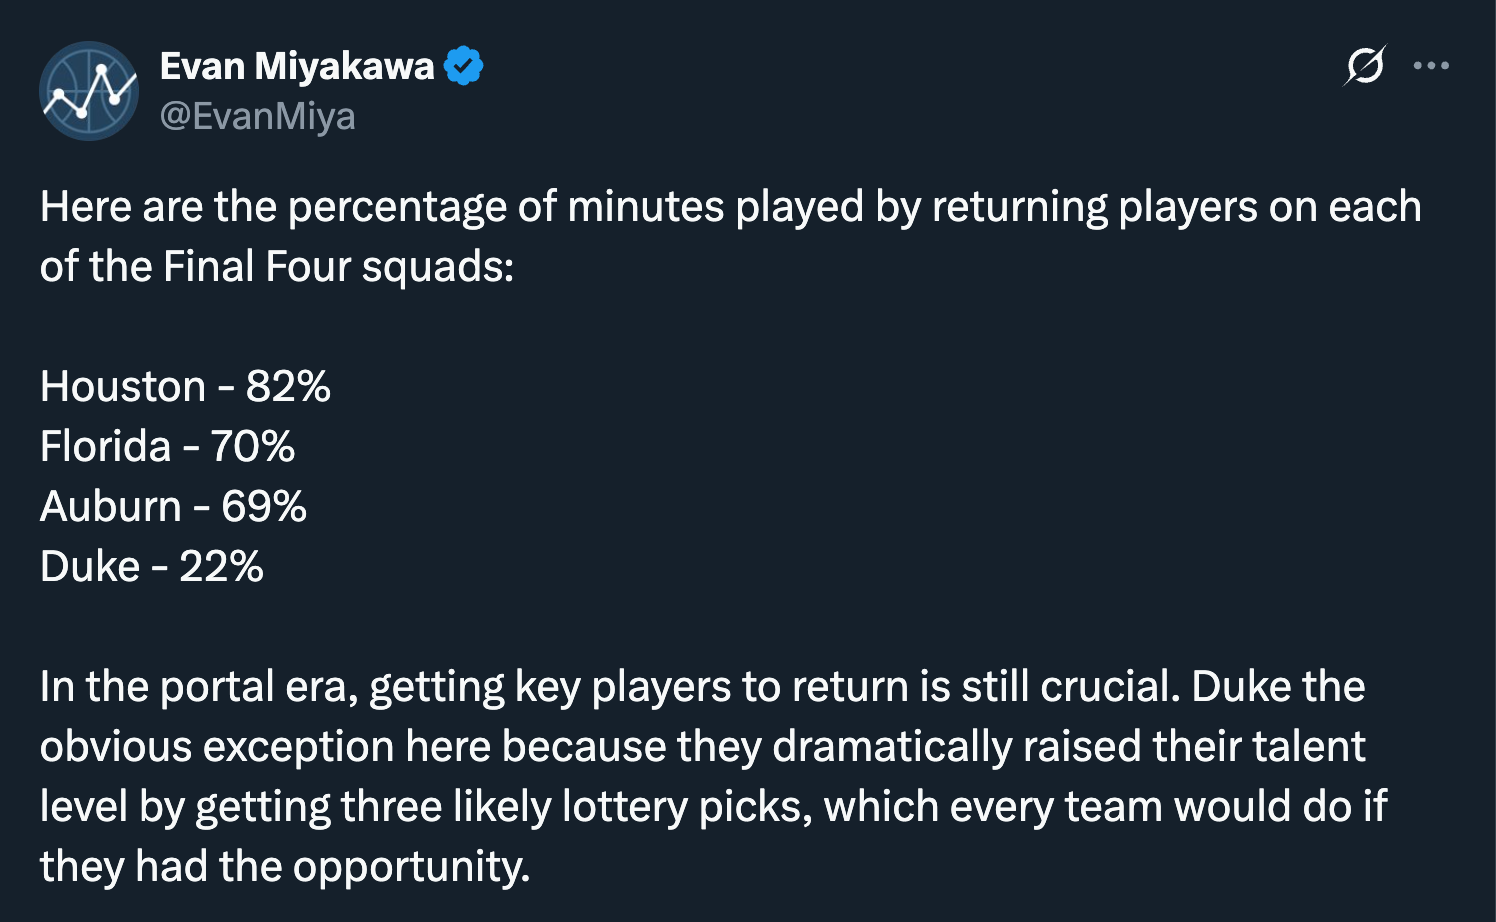
Three of this year’s Final Four teams, all 1-seeds, were comprised mostly of players returning to their team from the previous year. Houston, Florida, and Auburn all had at least 69% of their minutes being allocated to guys coming back for another year.
Last offseason, I published an article titled “How To Build A Roster In The Modern Portal Era,” which examined recent roster construction trends and outlined a strategy for success for teams seeking to build championship-level squads. Today, we will revisit that study, updated with new data from the 2025 season.
In this article, we will answer many of the roster-building questions that are being talked about in today’s climate:
Can you have too many transfers?
Is transfer recruitment more critical now than high school recruitment?
How valuable are returning players?
Do you need freshman talent to be elite?
Should you prioritize returning players over transfers?
Is there a “formula” for roster composition?
For the purposes of today’s discussion, we will only talk about high-major teams, as the resources at mid-major schools dictate that they approach roster construction in a very different manner from high majors. I will dedicate a future article in the coming weeks to applying these concepts for mid-majors.
Roster Construction Best Practices
We will start with the main conclusions of this 4-year study and then explain each one more in-depth, along with the accompanying research:

1. Fill your roster with good basketball players
2. Returning players should account for at least 50% of the playing time
3. Prioritize recruiting players who will play at least 2 seasons for you
Talent Matters
The most important (and obvious) strategy in roster construction is always to fill your roster with skilled and talented players. It doesn’t take a statistical study to convince anyone of this point, so I won’t spend much time on the topic.
The strength of a team’s squad in the preseason will always be the strongest indicator of success during the season. As part of this study, I calculated a preseason roster score for every team by taking the preseason BPR projection for each player on the roster and summing them up, weighting each player based on the number of minutes they are likely to play. These minute predictions are based on how each player ranks relative to other teammates in their BPR projection. The best players on a team typically are predicted to play around 30 MPG, and the worst players in the rotation are expected to play around 10 MPG.
The graph below shows how every team’s preseason roster scores against their end-of-season team efficiency rating at EvanMiya.com over the past four seasons.

Unsurprisingly, there’s a high correlation between roster score and team performance during the season. If a coaching staff is deciding between two players, one of whom is definitely a better player than the other, it’s always the best choice to go with the more talented player, no matter what avenue of recruiting that player comes from (returning player, transfer portal, or high school).
A Four-Year Study
With the obvious out of the way, let’s dig deeper into the roster construction of high-major teams over the last four seasons. I chose to limit the study to the 2021-22, 2022-23, 2023-24, and 2024-25 seasons because they most closely represent the current landscape of college basketball, with numerous immediately eligible transfers and NIL playing a significant role in recruitment.
The main variables that I took into consideration for this study were:
Preseason roster score ranking
The percentage of minutes played during the season by returning players
The percentage of minutes played by new transfers
The percentage of minutes played by freshmen
The following table shows how the previous three champions fared in each category. Notice that each title winner used returning players for over 50% of the available minutes.

Since it’s impossible to make sweeping conclusions on roster construction from just four teams, let’s expand our pool of “successful teams” to all of the 1 seeds from the past four seasons. Every team had a preseason roster rank within the top 30, with 13 of 16 having top-15 rosters. Almost all of the 1 seeds leaned mostly on returning players, as only three teams had returning players play less than 50% of their team’s minutes (Alabama 22-23, UNC 23-24, Duke 24-25).
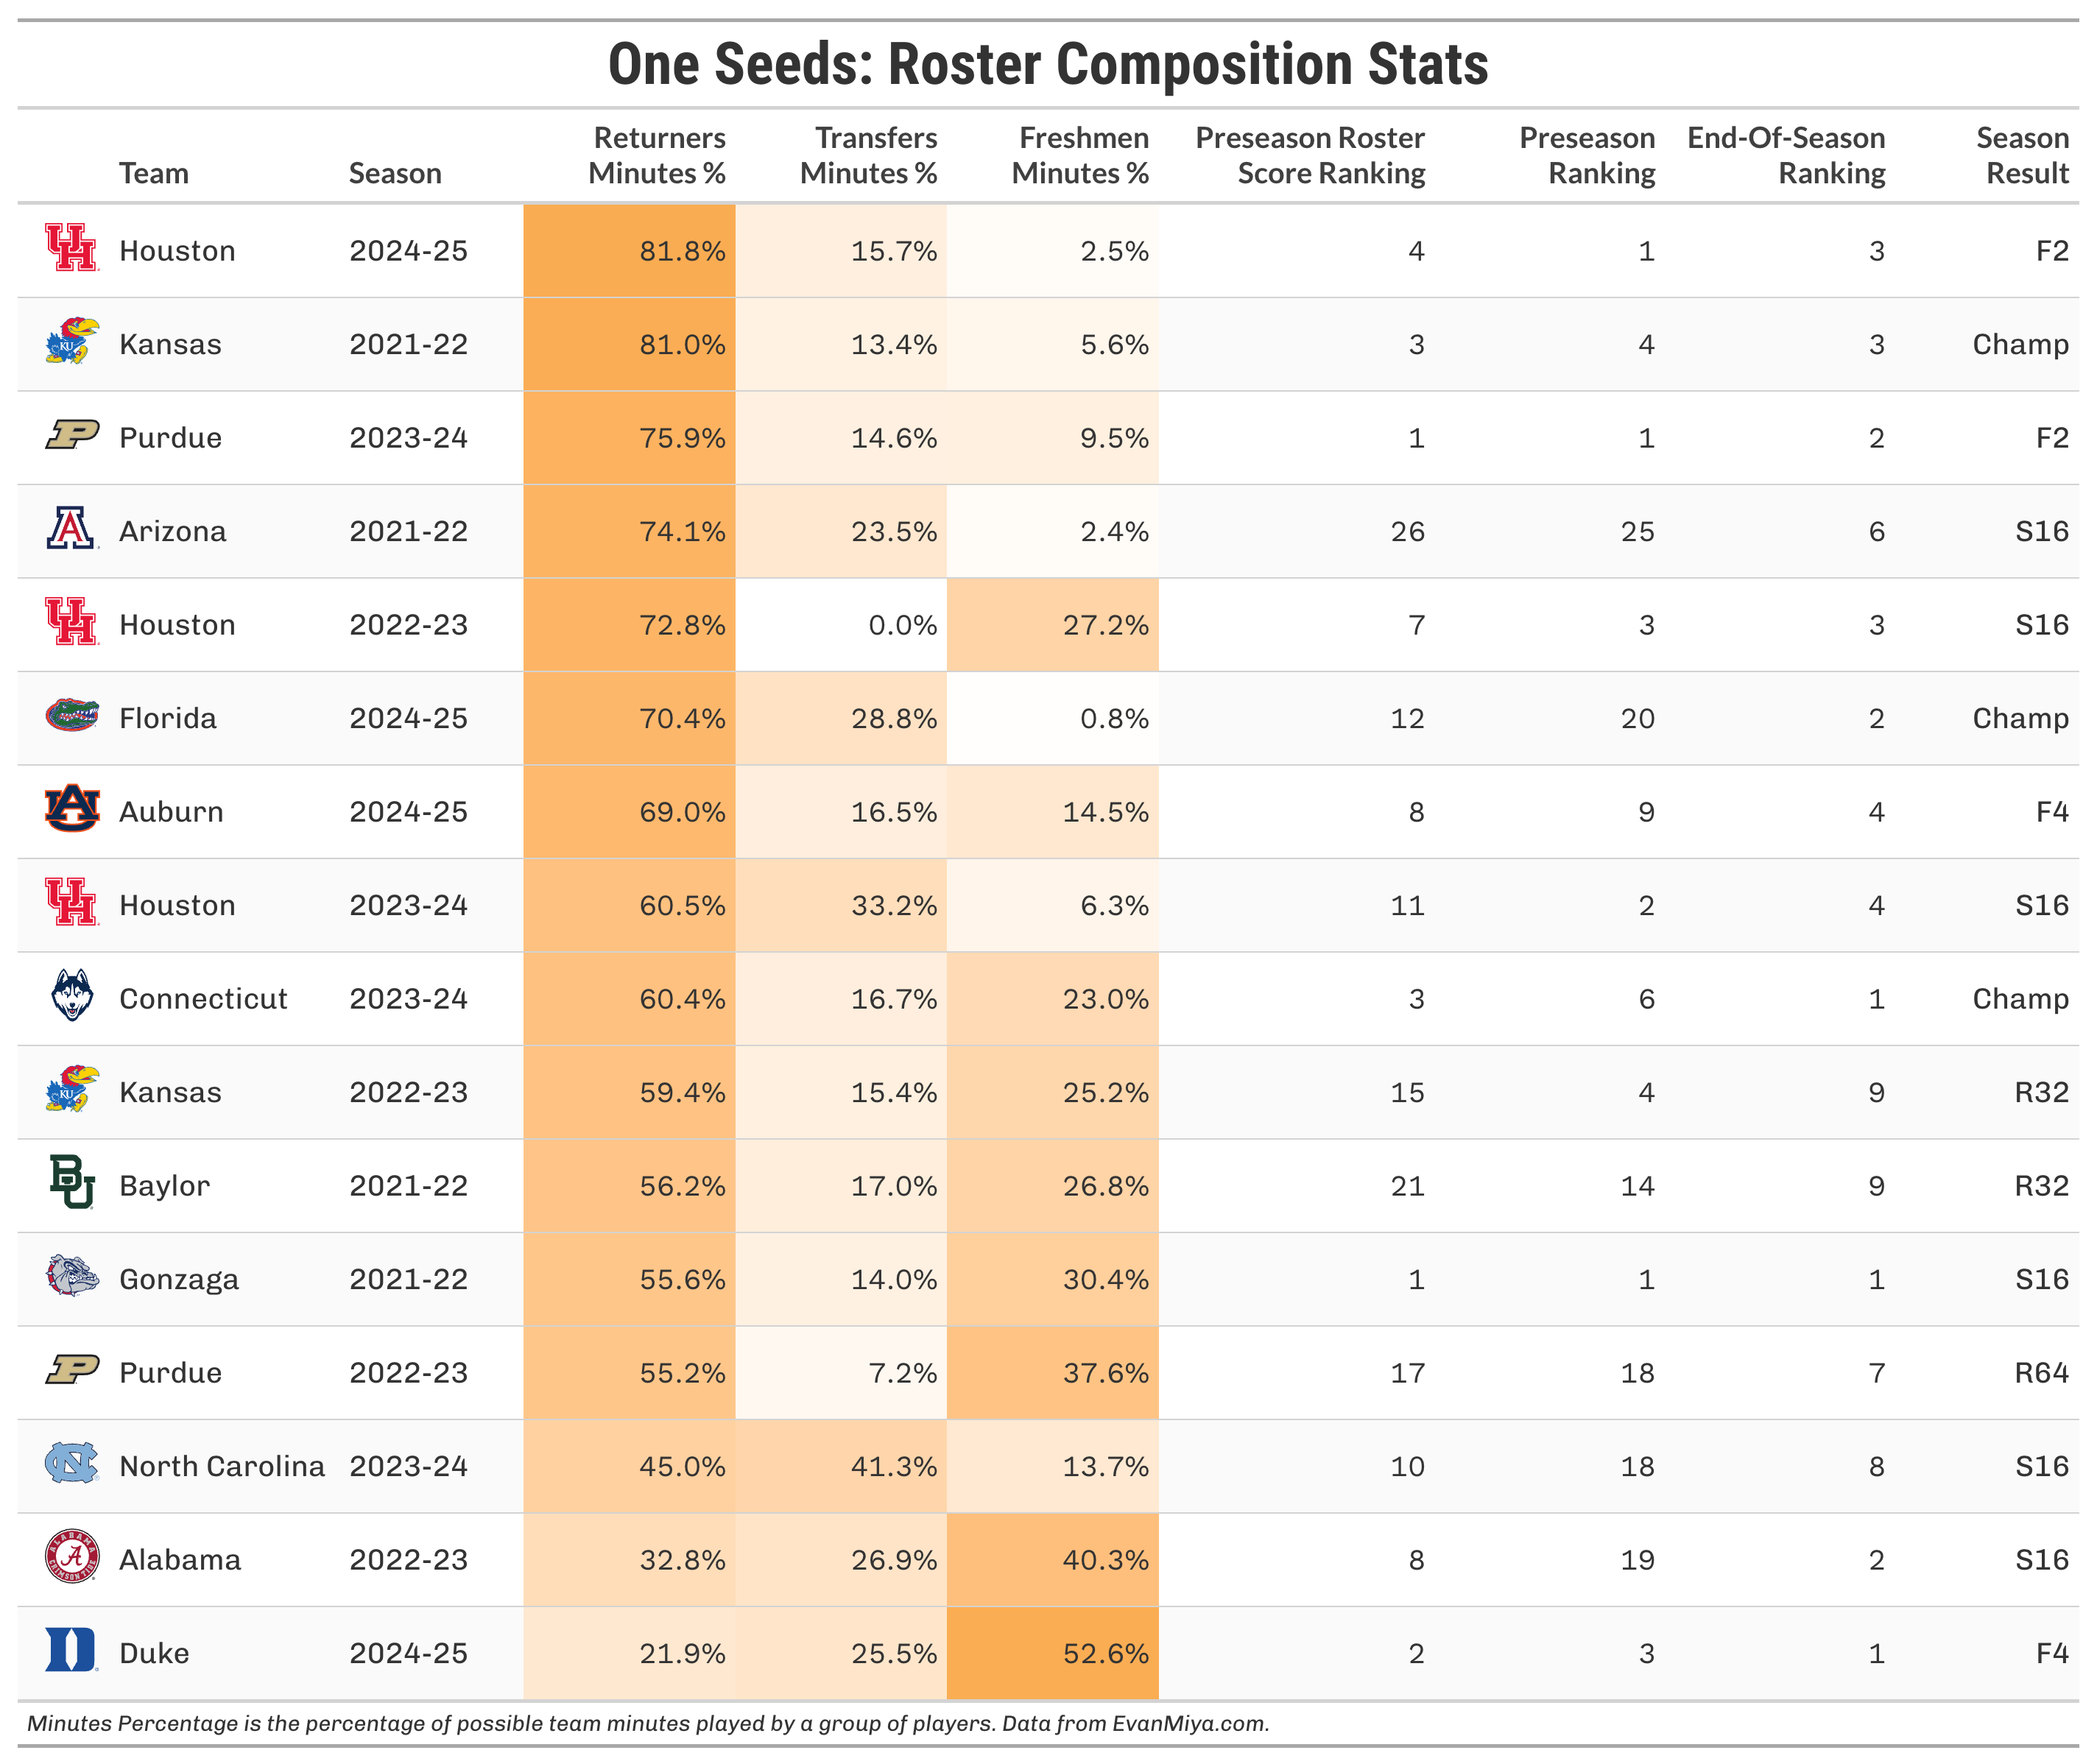
This past season, all four 1-seeds made the Final Four, with Houston (82% of minutes played by returners), Florida (70%), and Auburn (69%) all building their teams around a key group of players coming back for another year. Duke’s team was constructed very differently, but had arguably the most talented roster in the country featuring three likely lottery picks in the 2025 NBA draft.
Let’s expand our list of successful teams a bit further and compare all teams that finished in the top 10 at the end of the season (all of which made the tournament) to all high majors that missed the NCAA tournament entirely.
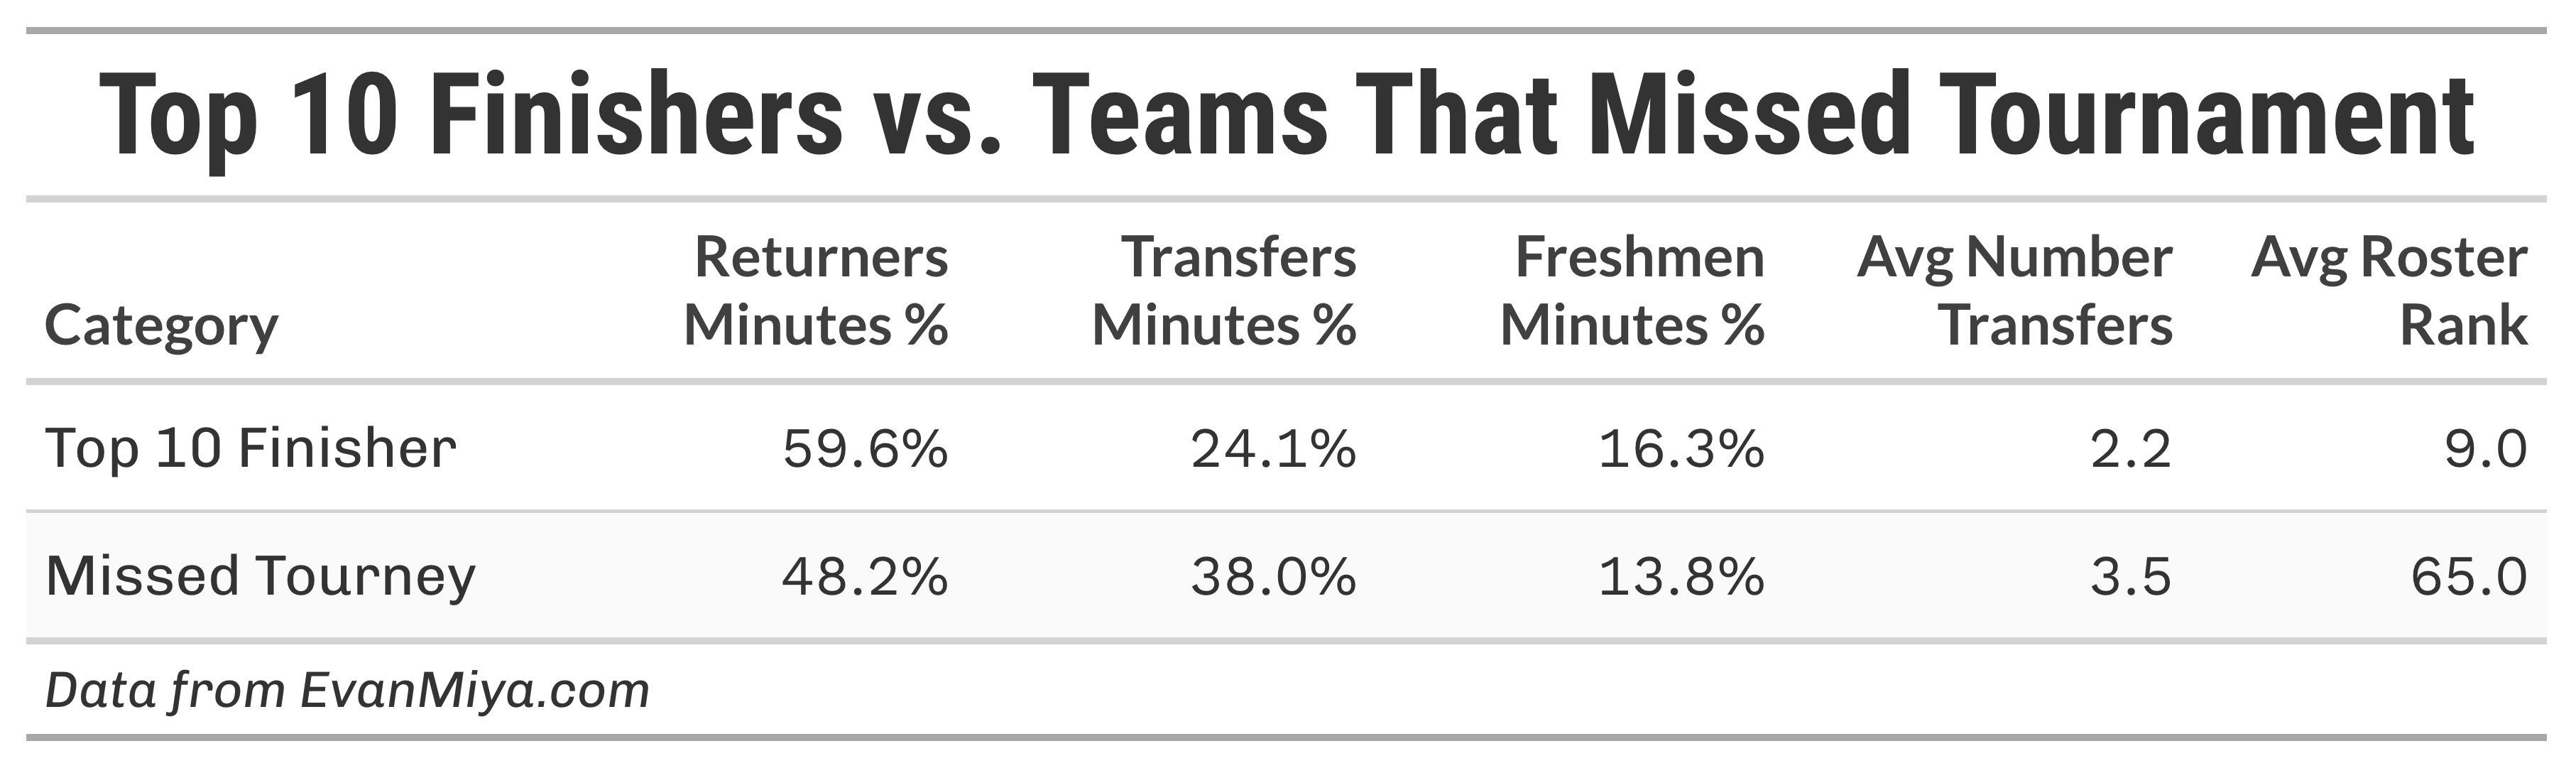
The differences are pretty stark. Top 10 teams, on average, had returners play about 60% of the available minutes during the season, while teams that missed the tournament were only at 48%. The reliance on transfers was significantly lower for top 10 teams, at just 24% of the minutes, compared to 38% for high majors that failed to secure a tournament berth. Top 10 teams also took 1.3 fewer transfers in the offseason on average than teams that missed the tournament. Looking at just this past season (2024-25), high-majors who missed the tourney only played returners for 39% of their minutes, compared to 57% for top 10 teams.
Hitting At Least 50% Minutes From Returning Players
If you compare two rosters that are of similar talent in the preseason, the team that is structured around returning players typically performs better than the team that is structured around mostly new transfers and freshmen.
To illustrate this, the graph below categorizes every D1 team from the last four seasons into groups based on their preseason roster score ranking. For example, all teams ranked between 110th and 70th are grouped together, while those ranked in the top 35 are in another group. When you look at the average end-of-season ranking at EvanMiya.com for teams within each group, the teams that gave returning players at least 50% of the team’s minutes during the season always finish better on average than the teams that gave a majority of their minutes to new players.
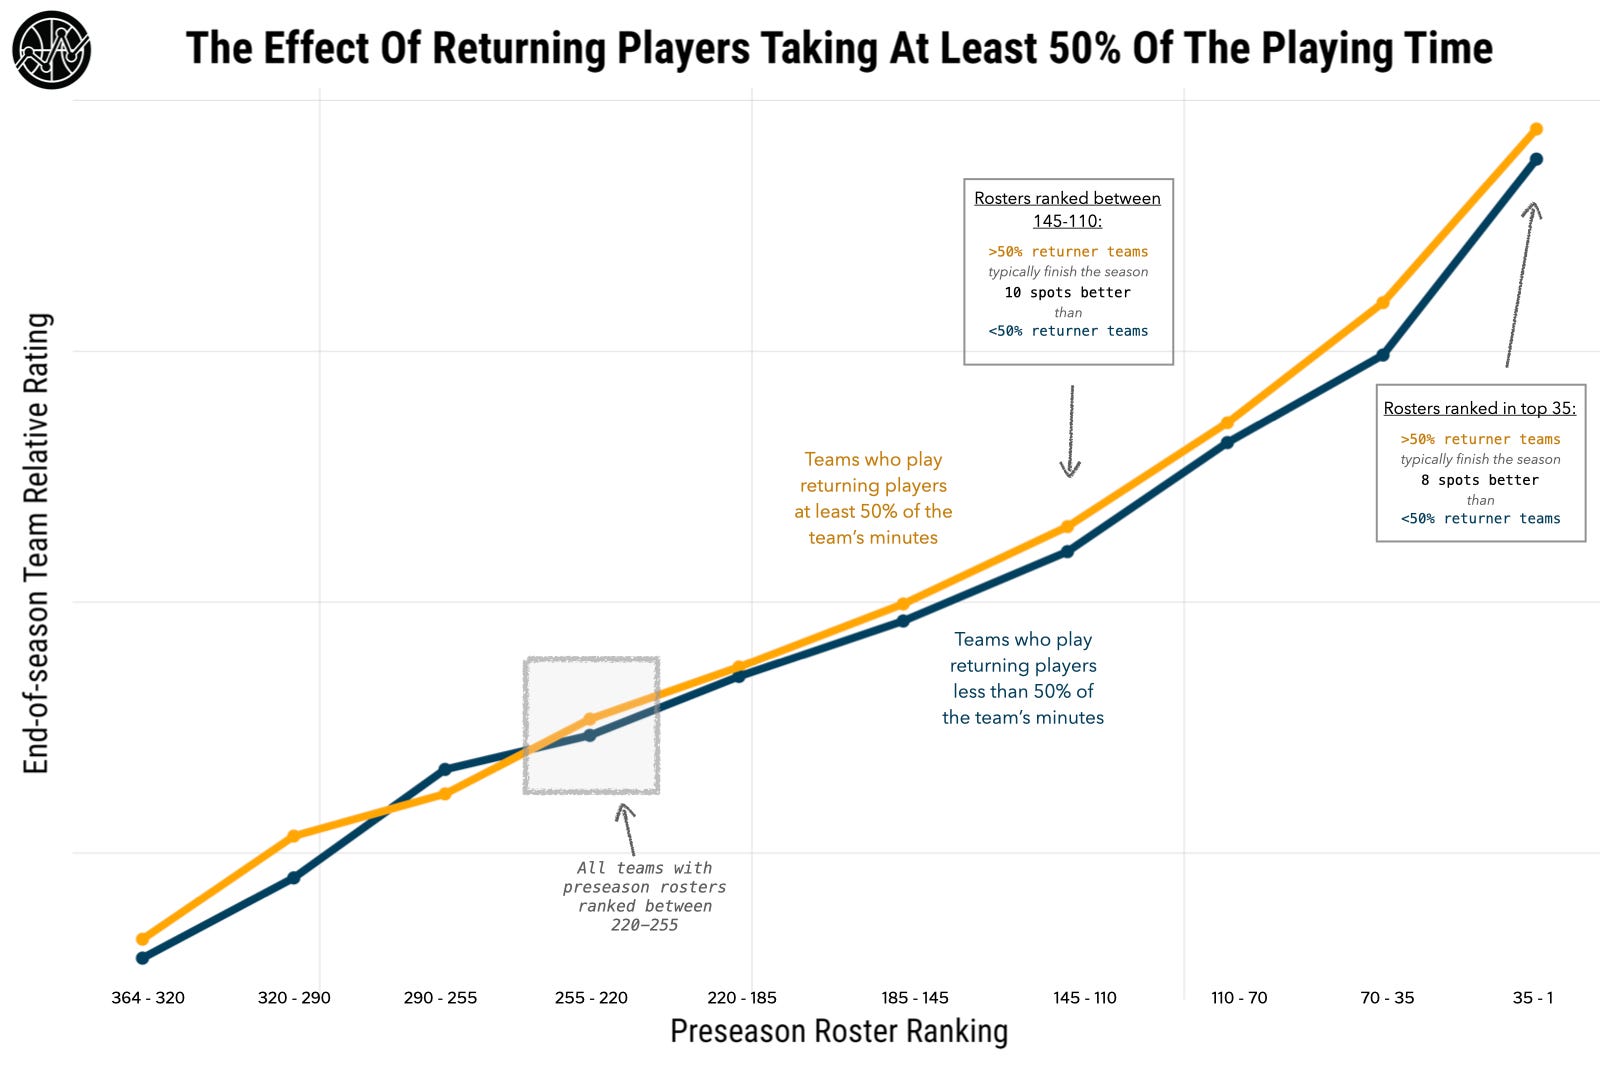
For example, among teams that had top 35 preseason roster scores, those that played returning players at least 50% of the time typically finished around 18th in the country at the end of the year. However, teams that played returners less than 50% of the time finished around 26th on average, 8 spots worse. This difference is evident in almost every grouping of teams, regardless of their preseason roster talent.
Interestingly, the percentage of minutes played by freshmen doesn’t seem to impact whether a team performs well or not. In my opinion, teams built around transfers struggle more often because transfers often fill a void for a potential returning player who was not retained. Teams with many transfers will likely have very few returning players, and vice versa.
The same is not the case for rosters studded with freshmen. These teams are more likely to still have a good number of returning players, unlike teams composed entirely of transfers.
Broad Conclusions
Based on the results of this study, the most crucial factor for team success, beyond prioritizing good players, is maximizing the role that returning players will play. Having returners account for at least 50% of the minutes played is a safe benchmark, but teams with a higher percentage are more likely to perform well. As Trilly Donovan often says, “Sometimes the best gets are the ones you already have.”
Having talented freshmen and transfers on the roster is not a bad thing, but recruiting these players should not come at the expense of losing similarly valuable players already on the roster.
A secondary takeaway is this: Teams that prioritize recruiting (or retaining) players who will play for them for multiple years will reap the benefits down the road. The actual value of a freshman or transfer can often come in the 2nd or 3rd year that he plays for the same team. Final Four standouts like Johni Broome, Walter Clayton, and LJ Cryer this past season were in their 2nd or 3rd year with their team after transferring. Given how much more success teams with returning players have, it is wiser to recruit a player who is more likely to play multiple years at your school than a similarly skilled player who will just play one season and graduate or transfer away.
Case Studies
One of the most interesting parts of this research is analyzing teams that take some of these roster-building strategies to the extreme. Here, we will examine outlier teams from several categories and provide insight into whether these approaches to roster construction work.
Running It Back: Teams Who Return Maximum Players
The table below shows the high majors from the last two seasons with the highest percentage of minutes played by returning players. All of these teams had returners make up at least 75% of the possible minutes on the court:
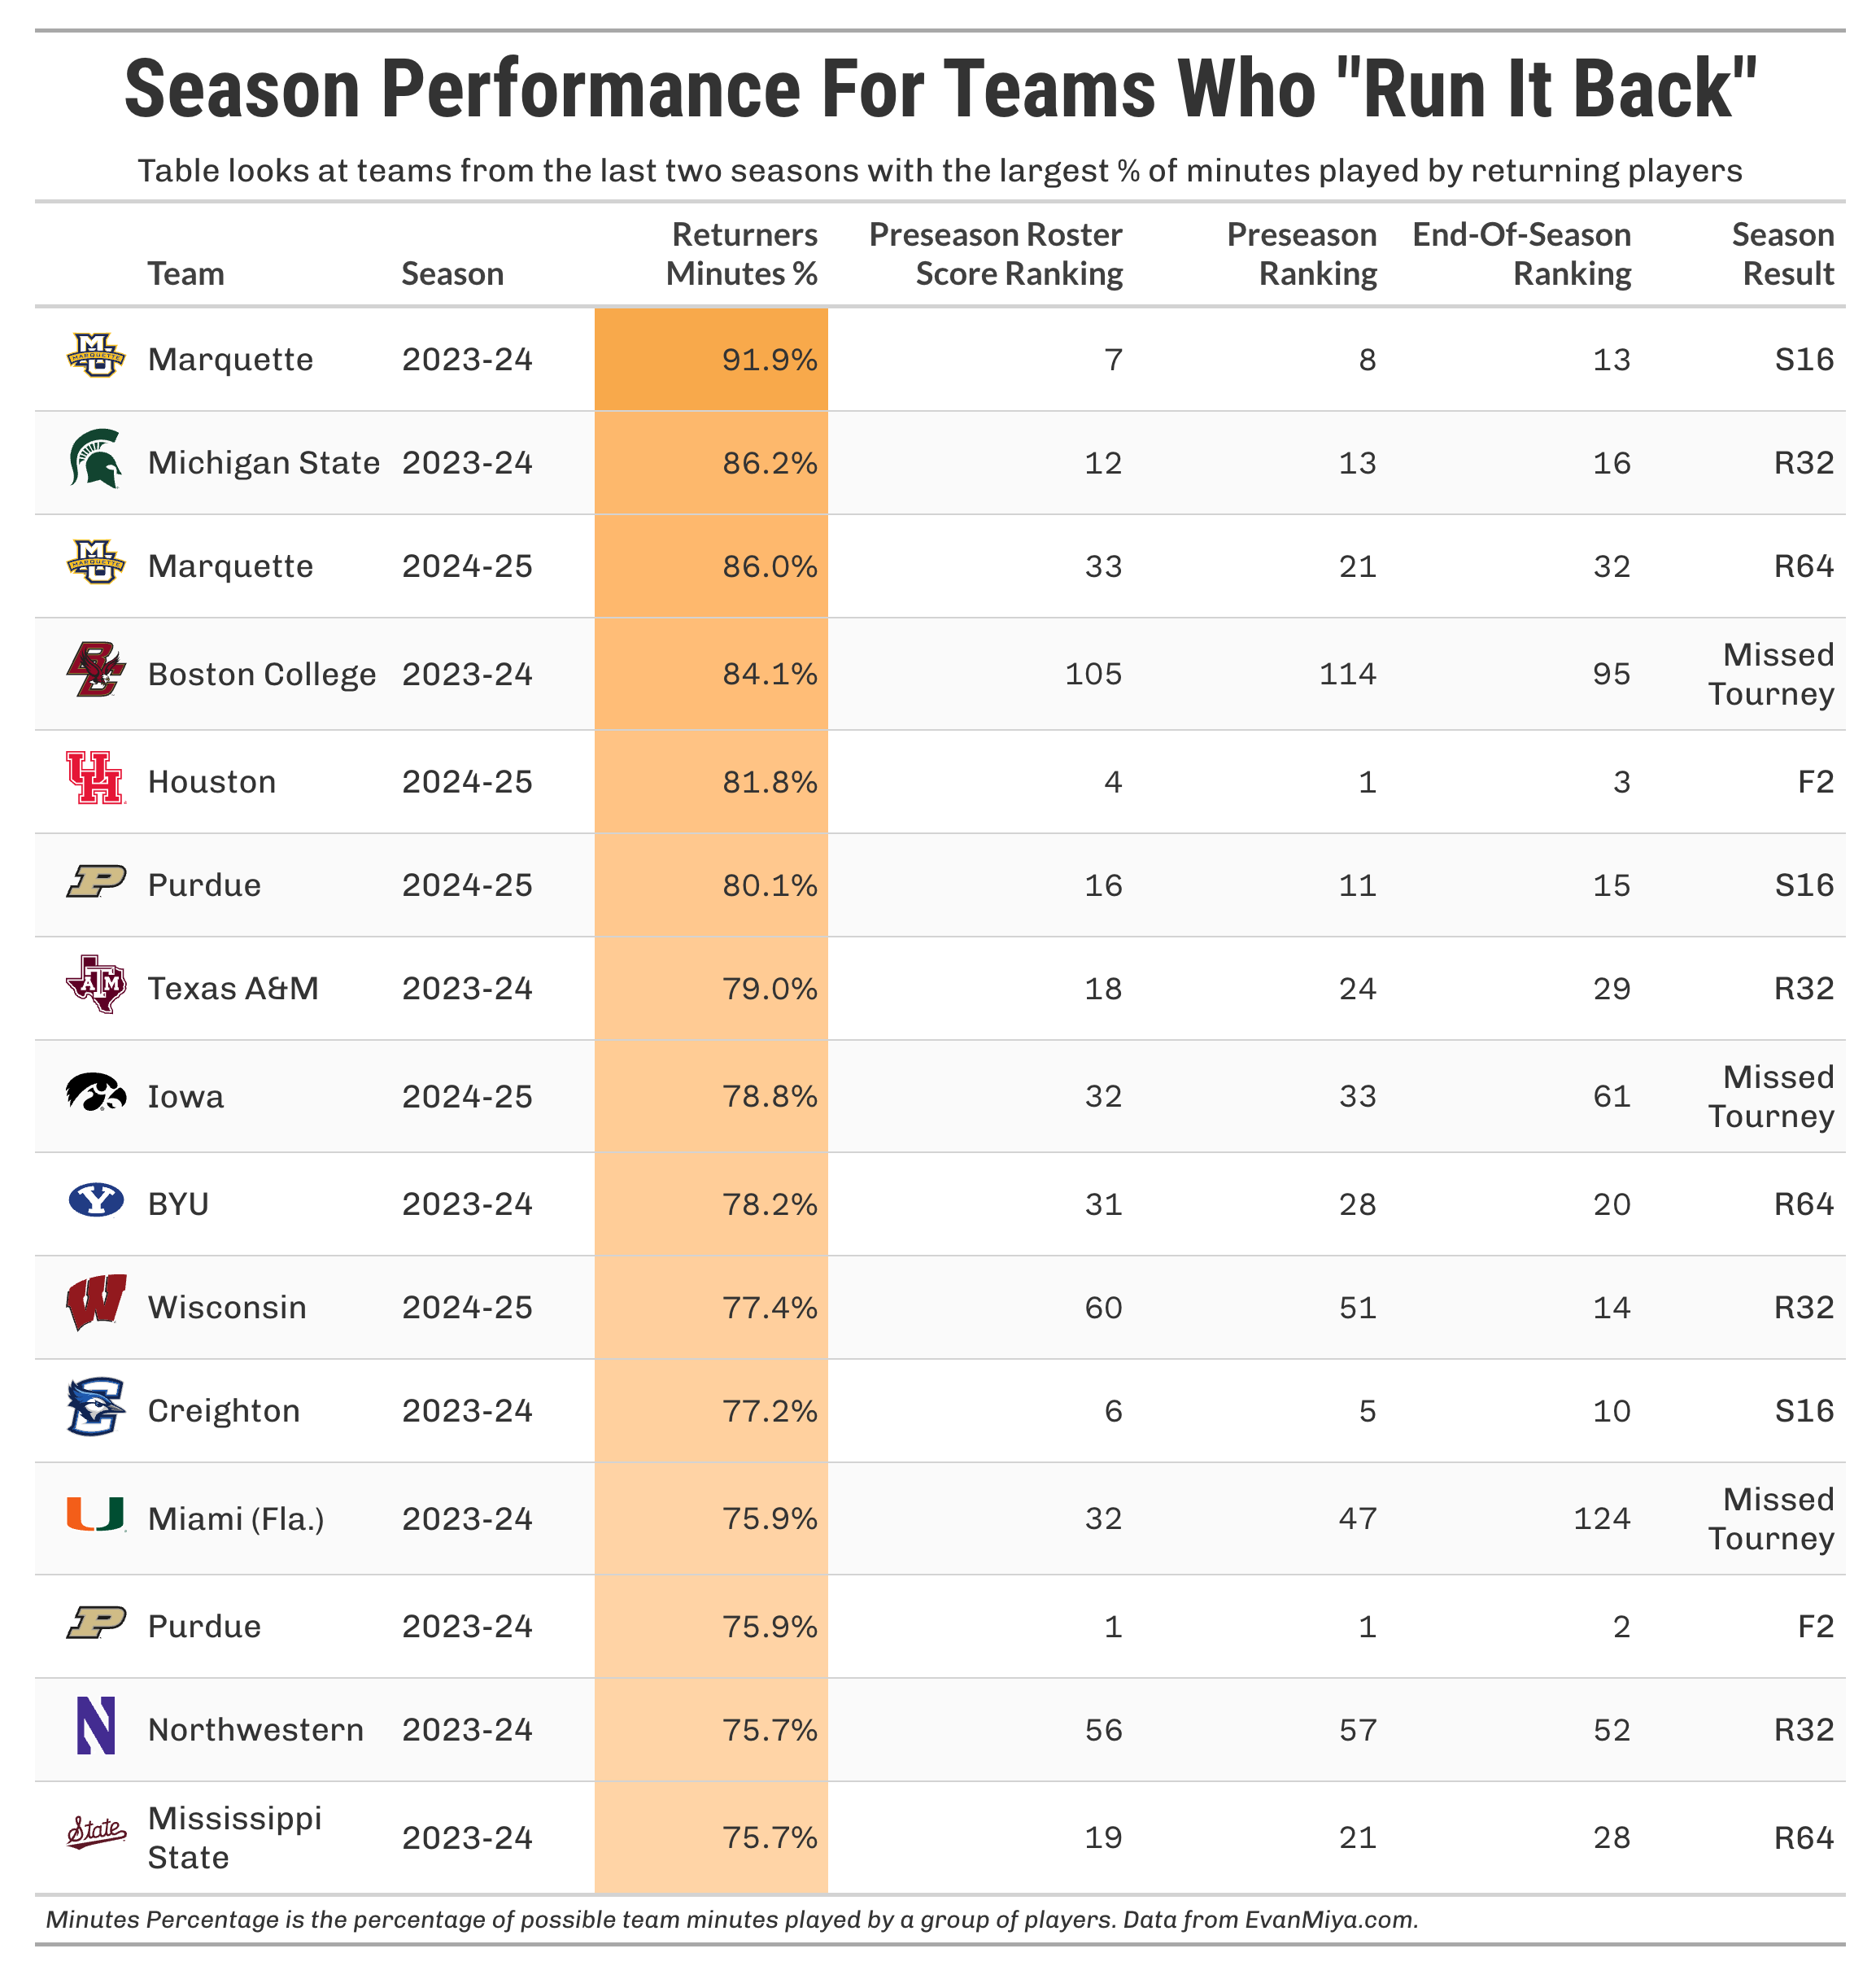
Twelve of the fifteen teams made the tournament, 10/15 finished in the Top 30 at EvanMiya.com, and two made the national title game (Purdue 23-24 and Houston 24-25). Teams that “run it back” typically have high, safe floors. They don’t usually underperform and are likely to have pretty good seasons, if not better.
Start From Scratch: Teams Who Return Minimum Players
The table below shows the high majors from the last four seasons with the lowest percentage of minutes played by returning players. Every team had returning players play less than 16% of their team’s minutes:

The results are pretty disappointing for this group. Only 6 teams out of the 20 made the tournament, and only three advanced past the first round. Almost half of the group finished outside the Top 100 at EvanMiya.com. Of the six high-majors this past season who had entirely new rosters, only Kentucky and Louisville made the tournament. It takes an excellent coaching staff to get the most out of a roster comprised entirely of new faces.
Young And Talented(?): Teams Who Maximize Freshmen Minutes
To analyze teams that rely heavily on freshmen, I will break them into two categories.
First, we will look at the teams with top 30 preseason roster scores with the highest percentage of minutes played by freshmen. These teams typically featured elite five-star freshmen and were likely to qualify for the tournament. Every school on this list had freshmen account for 30% of the minutes or more, with Duke (22-23), Kentucky (23-24), and Duke (24-25) exceeding 50%.
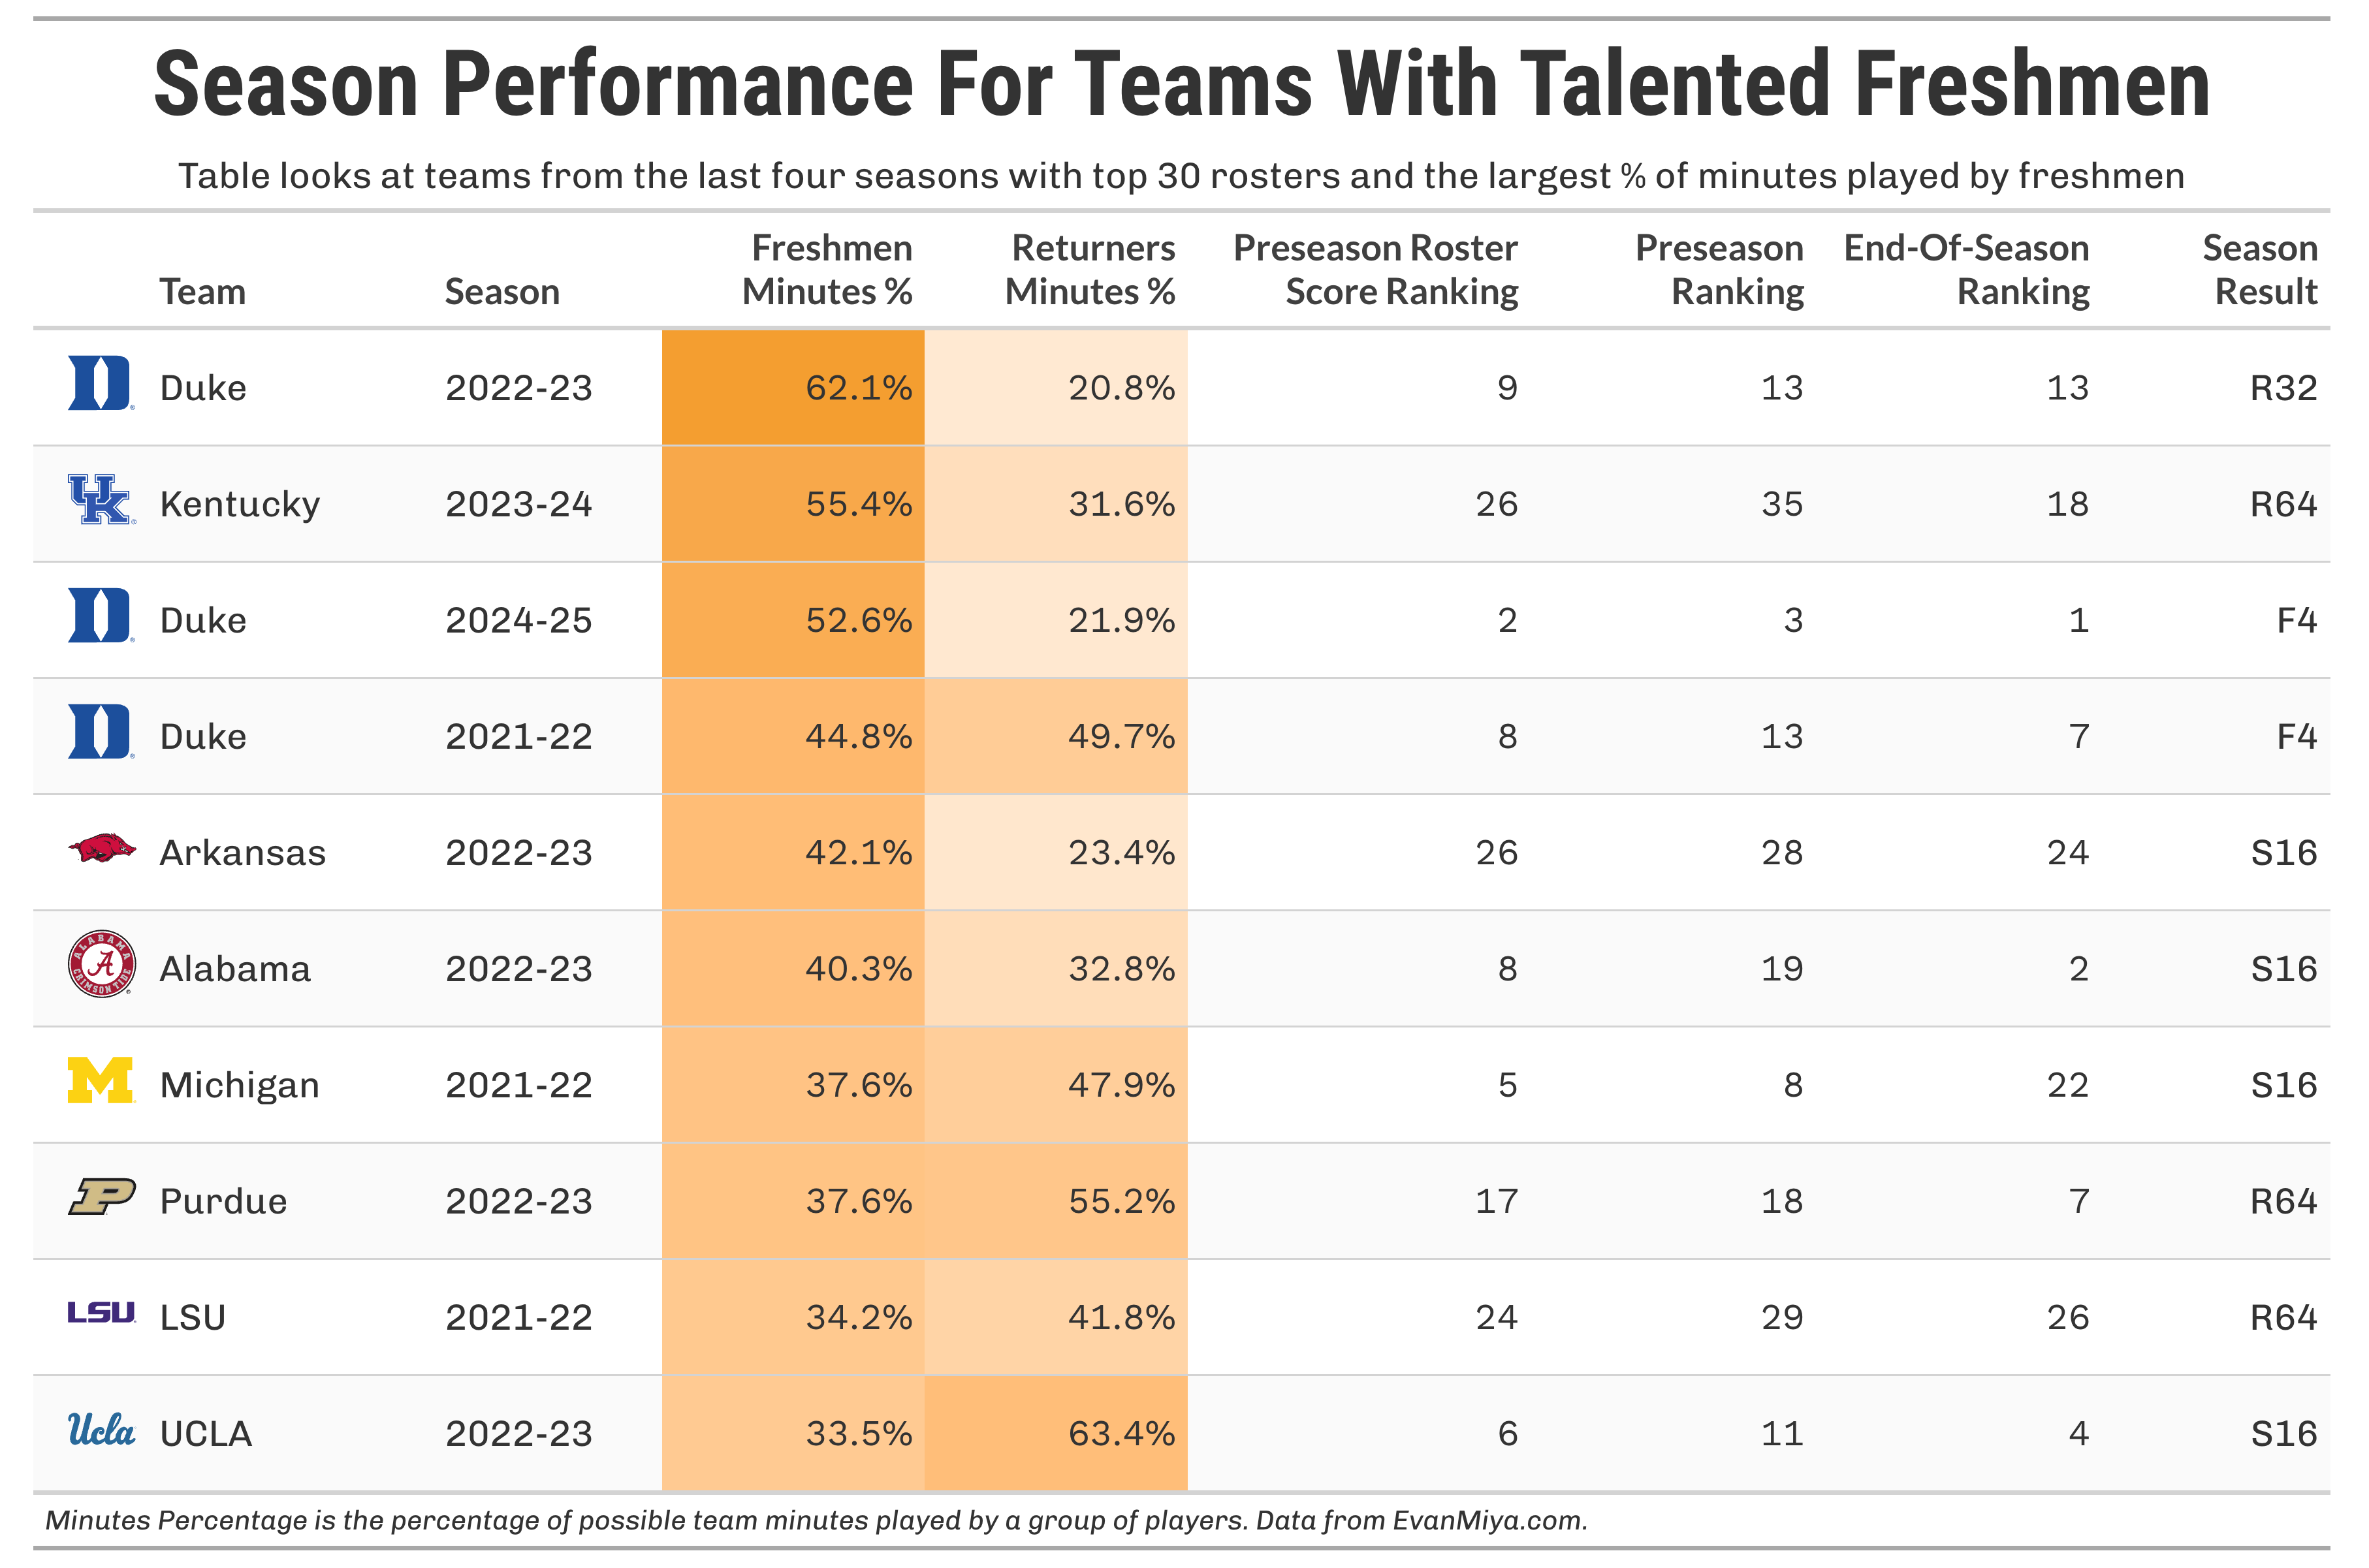
These teams, boasting highly touted freshmen classes, have fared quite well, with all ten teams making the tournament. What’s interesting, though, is that while the freshman talent was sky-high, these teams also had some key returning players to pair with freshmen to make it work. Among this group, 39% of the minutes played were by returning players and 44% by freshmen. Generally, it’s hard for teams with big-time high school prospects to fail, especially if there are equally skilled returning players to match with them.
Next, we will examine schools ranked outside the top 30 in preseason roster scores and look at the 10 teams with the highest burden on freshmen from that group. Every team in this category played freshmen for at least 37% of the team’s minutes:

The results aren’t pretty for teams that rely heavily on freshmen but aren’t among the nation’s elite rosters. Just 30% of this group made the tournament, and 5 out of the 10 teams finished the year outside the top 75 in the country. While the average percentage of freshmen minutes from this group was 46%, just 30% of the possible minutes were played by returning players.
The 2025 Rutgers team, featuring Dylan Harper and Ace Bailey, is an interesting data point here because the Scarlet Knights were widely regarded as a top 25 team in the preseason. While Harper and Bailey were ultra-talented, the other rotation pieces around the freshman duo left a lot to be desired, which is why they were ranked 70th in the preseason at EvanMiya.com. Ultimately, they performed at pretty much that exact level, finishing the year 76th in the country.
What About Mid-Majors?
Stay tuned for a future blog article in the coming weeks on optimizing roster construction for teams outside of the high-major ranks.
This is excellent Evan, great work as always! Do you have anything in the works to assign value metrics to euroleague or international NCAA new comers? They aren't necessarily freshman, but they also aren't an NCAA transfer. As this becomes more common, it seems like their "fit" will have enough unique factors to make up their own category.
Very interesting piece of writing, thank you.
I know you teased this at the end, but one statistical category I'd be curious about would be to see how coaching changes affect this data. For example, VCU has a new coach that will have put together a roster for 2025-26 comprised of a handful of returning VCU players, two players coming with him from Bryant, and a mix of high school and other transfer for the rest. Specifically, how would your data of returning players factor into returning to the coaching and its system versus that school and overall program. I guess that will be a topic for a different day though...