


The appetite for data analytics in college basketball continues to grow every year, and with it comes more attention on publicly available computer metrics. Arguably, the three most popular “supercomputers” are KenPom.com (the original college basketball analytics site, founded in 2001 by Ken Pomeroy), BartTorvik.com (created in the mid 2010s by Bart Torvik), and EvanMiya.com (created in 2020 by Dr. Evan Miyakawa, who happens to be writing this article). Each site provides massive value for college basketball fans, coaches, and everyone in between.
But when it comes to their proprietary algorithms for ranking 365 Division 1 basketball teams, which computer model comes out on top?
Quick Methodology
The goal of today’s study is to compare the predictive accuracy of the EvanMiya, KenPom, and Torvik algorithms on two things: preseason team rankings and game predictions.
For the rest of this article, I will take off my EvanMiya hat and present this analysis as impartially as possible. If any reader finds some lingering bias in these results, please reach out or drop a comment below. This is a project I’ve wanted to do for a long time, and I want to execute it as fairly as I can.
To compare the predictive accuracy of the models, I gathered data from the last three seasons (2023-24, 2024-25, and 2025-26), including each site’s preseason team rankings the morning of the first day of each season, and each model’s logged historical game predictions on the day of each game played. The predicted game outcomes used for this analysis had to be equally available across all three models to ensure identical datasets.
I'll outline the more statistically technical bits in blue, which you can skip if you want to blindly trust my interpretations.
Game Predictions Comparison
Analyzing the accuracy of each model’s game predictions is the more straightforward piece of this study given that we have a shared dataset of over 17,000 games, with predicted scores, spreads, and totals available for all of them. Today we will focus entirely on the accuracy of predicted game spreads. All score predictions were rounded to whole numbers to match KenPom, which doesn’t display decimals for predicted game scores.
The table below compares the accuracy of the game predictions across the models, averaged over the past three seasons. Here’s how to interpret each of the metrics used:
Root Mean Squared Error: The typical size of a predicted spread miss in points, with big misses penalized more heavily. Lower is better.
Mean Absolute Error: The average number of points the predicted spreads are off by, which is less affected by big misses. Lower is better.
Home Bias: The average amount the model is biased towards home teams. A zero means there is no systematic bias.
Variance Explained: The amount of uncertainty in games that is explained by the model’s predictions. Higher is better.
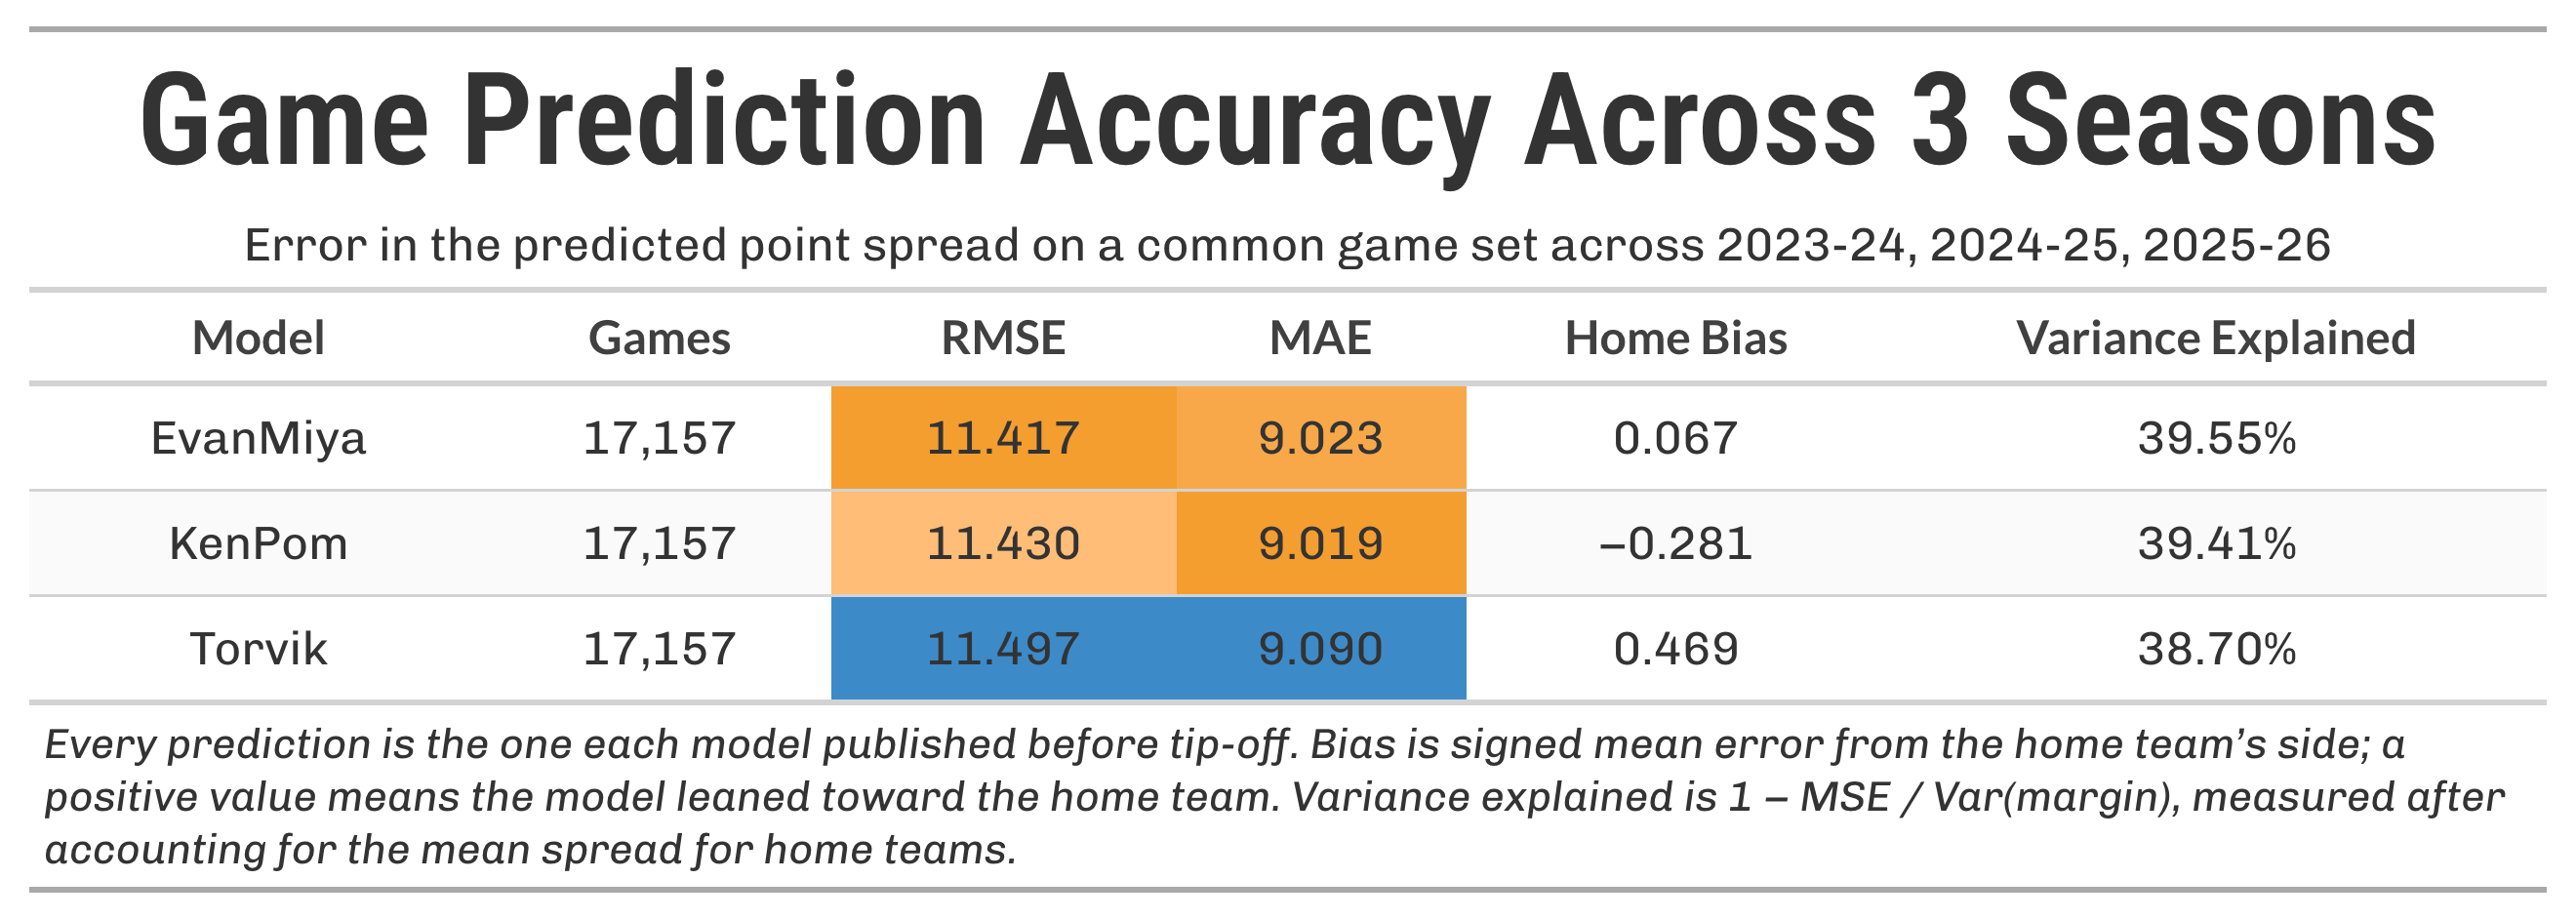
EvanMiya and KenPom are almost identical in game-prediction accuracy, with Torvik comfortably in third. EvanMiya has a slight edge on RMSE, while KenPom is narrowly ahead on MAE. The margins between the top two models are razor thin. The EvanMiya model also has the least bias towards either home or away teams, though this has varied by season.
What does an RMSE of ~11.4 actually mean? If you had no information about which teams were good and assumed every game was even, that naive “model” would have an RMSE of 15.6. If you accounted for home-court advantage, the RMSE would drop to around 14.7. Anything below that indicates the model is conveying useful information about team strength. A 0.004 difference in MAE between EvanMiya and KenPom equates to 23 points over a season. In other words, if you summed the raw amount each model missed its spread prediction by over a full year, the KenPom model would be just 23 points more accurate than EvanMiya according to MAE. The gap between KenPom and Torvik is larger: about 400 points per season.
“Home bias” is the average amount per game by which a model overestimates home teams’ win margins. For example, the EvanMiya model has predicted home teams to win by 0.067 more points on average than they actually have.
The graphs below show each model's accuracy by year (lower is better). The EvanMiya model had the biggest lead in 2024-25, while KenPom had the edge according to MAE last season.
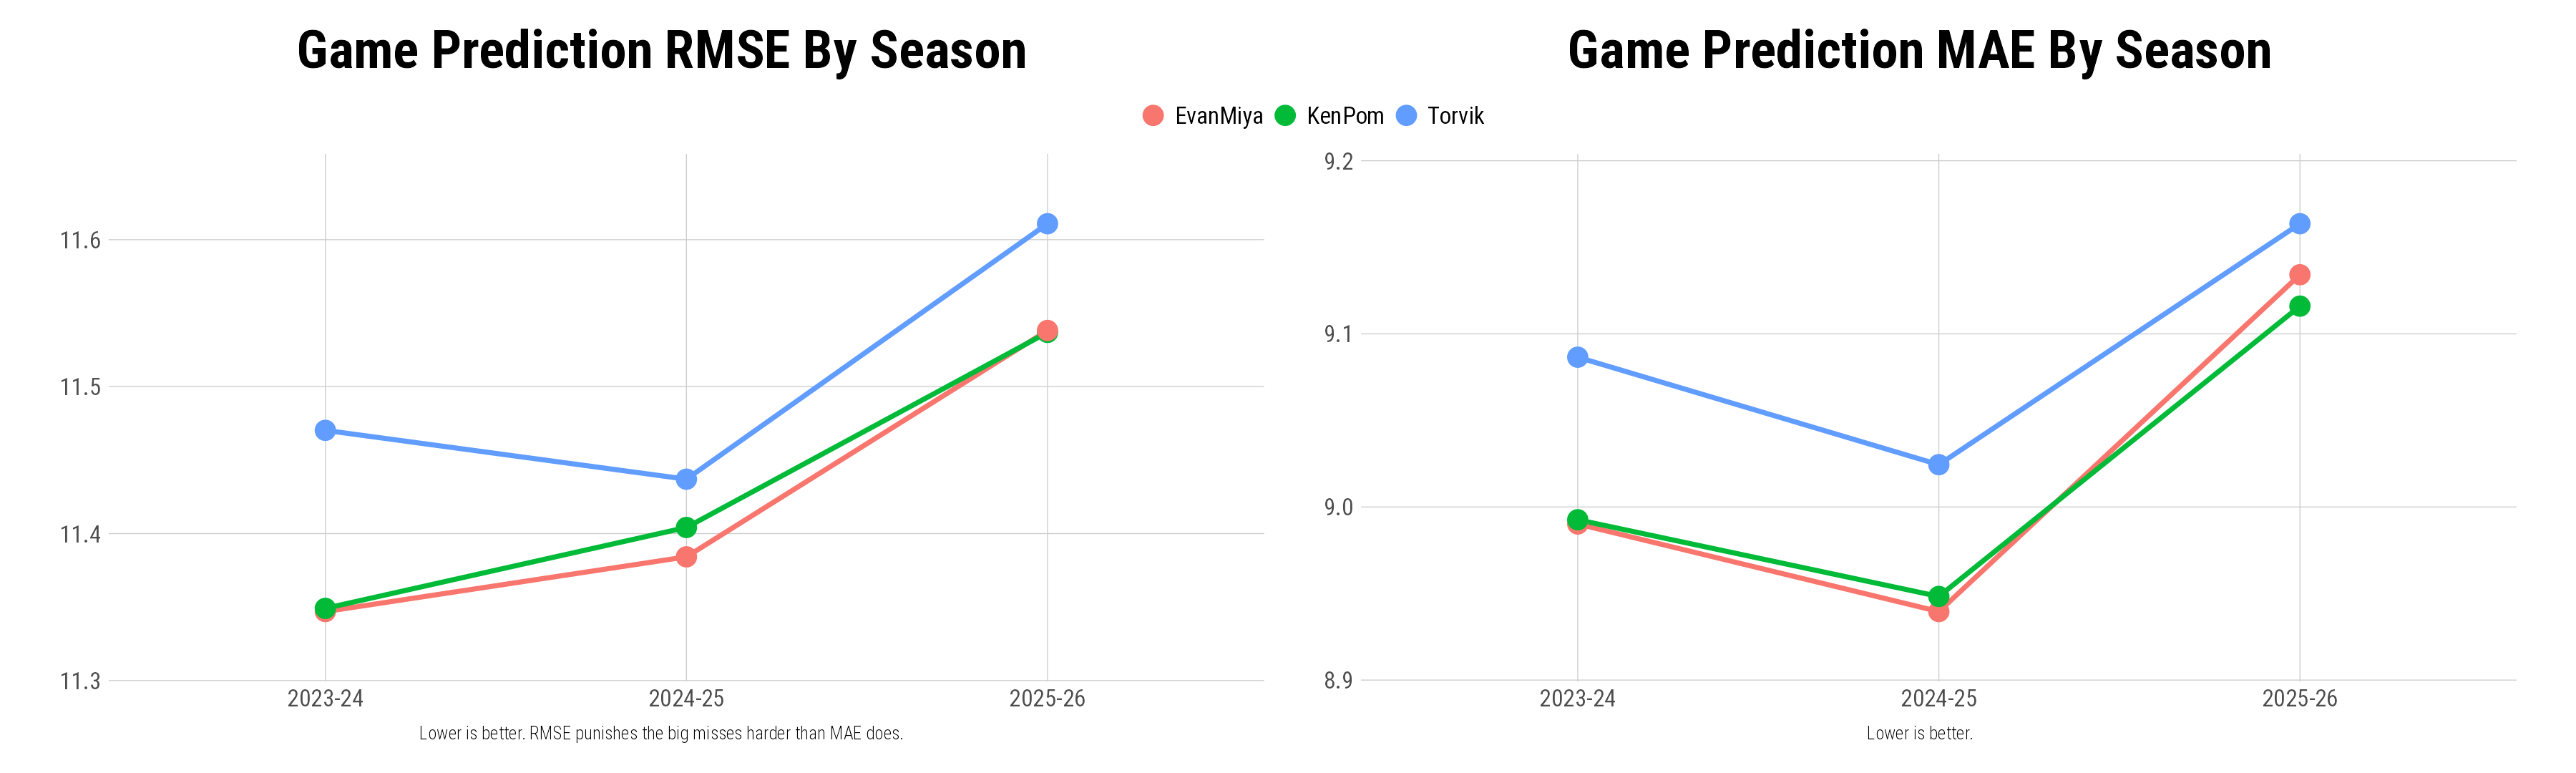
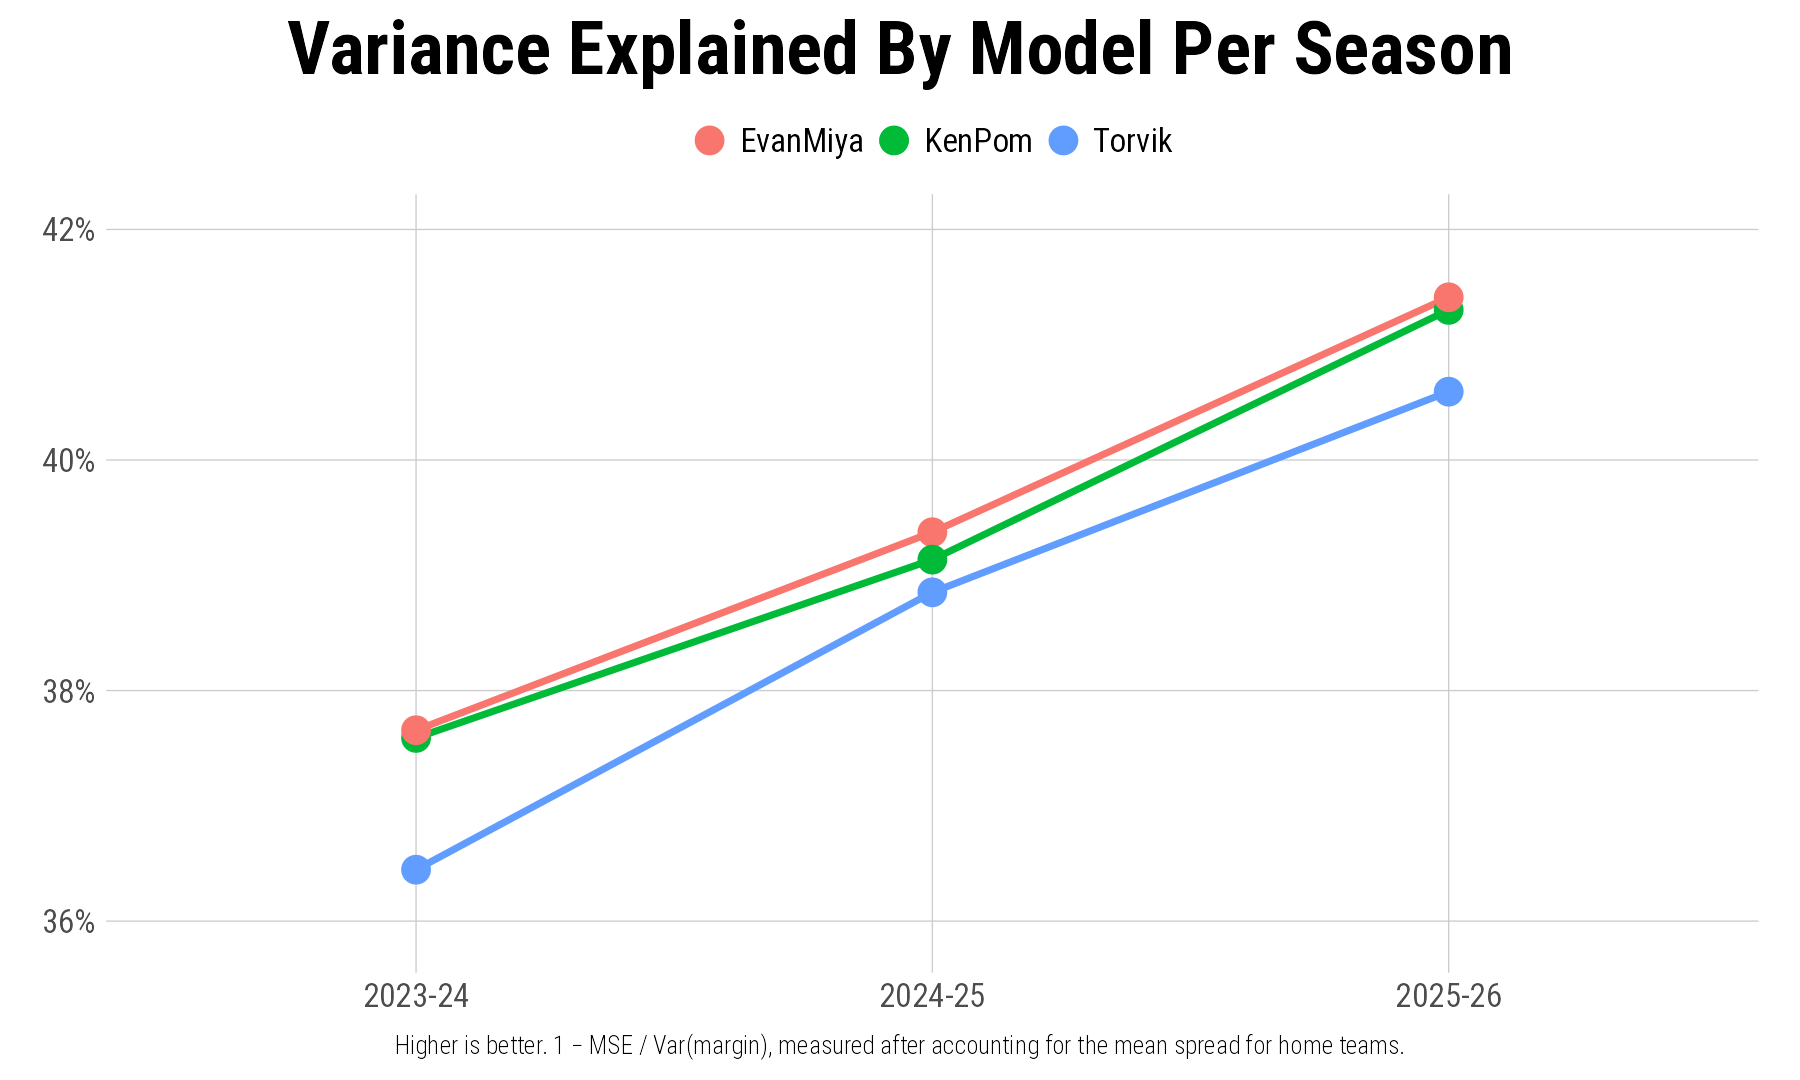
While the previous graphs imply that all three models got worse last season, this is misleading because they don’t account for the changing variance in the sport overall. In fact, the number of lopsided games across college basketball in 2025-26 was higher than the previous two years, leading to inflated game margins.
This next graph contextualizes this by showing how much variance in game spreads the models explained by year, with all of them improving over time. Around 41% of the variance in college basketball game spreads last year was explained by the game prediction models:
Combining The Models
Perhaps the ultimate test of whether a predictive model adds value is if it provides useful signal that other models don’t. In this case, while we can rank the algorithms against each other, the best model is actually a weighted average of all three.
The table below shows the best weighted combination of each prediction algorithm by season and combined across all years. In all cases, a weighted average comfortably outperforms any single model.
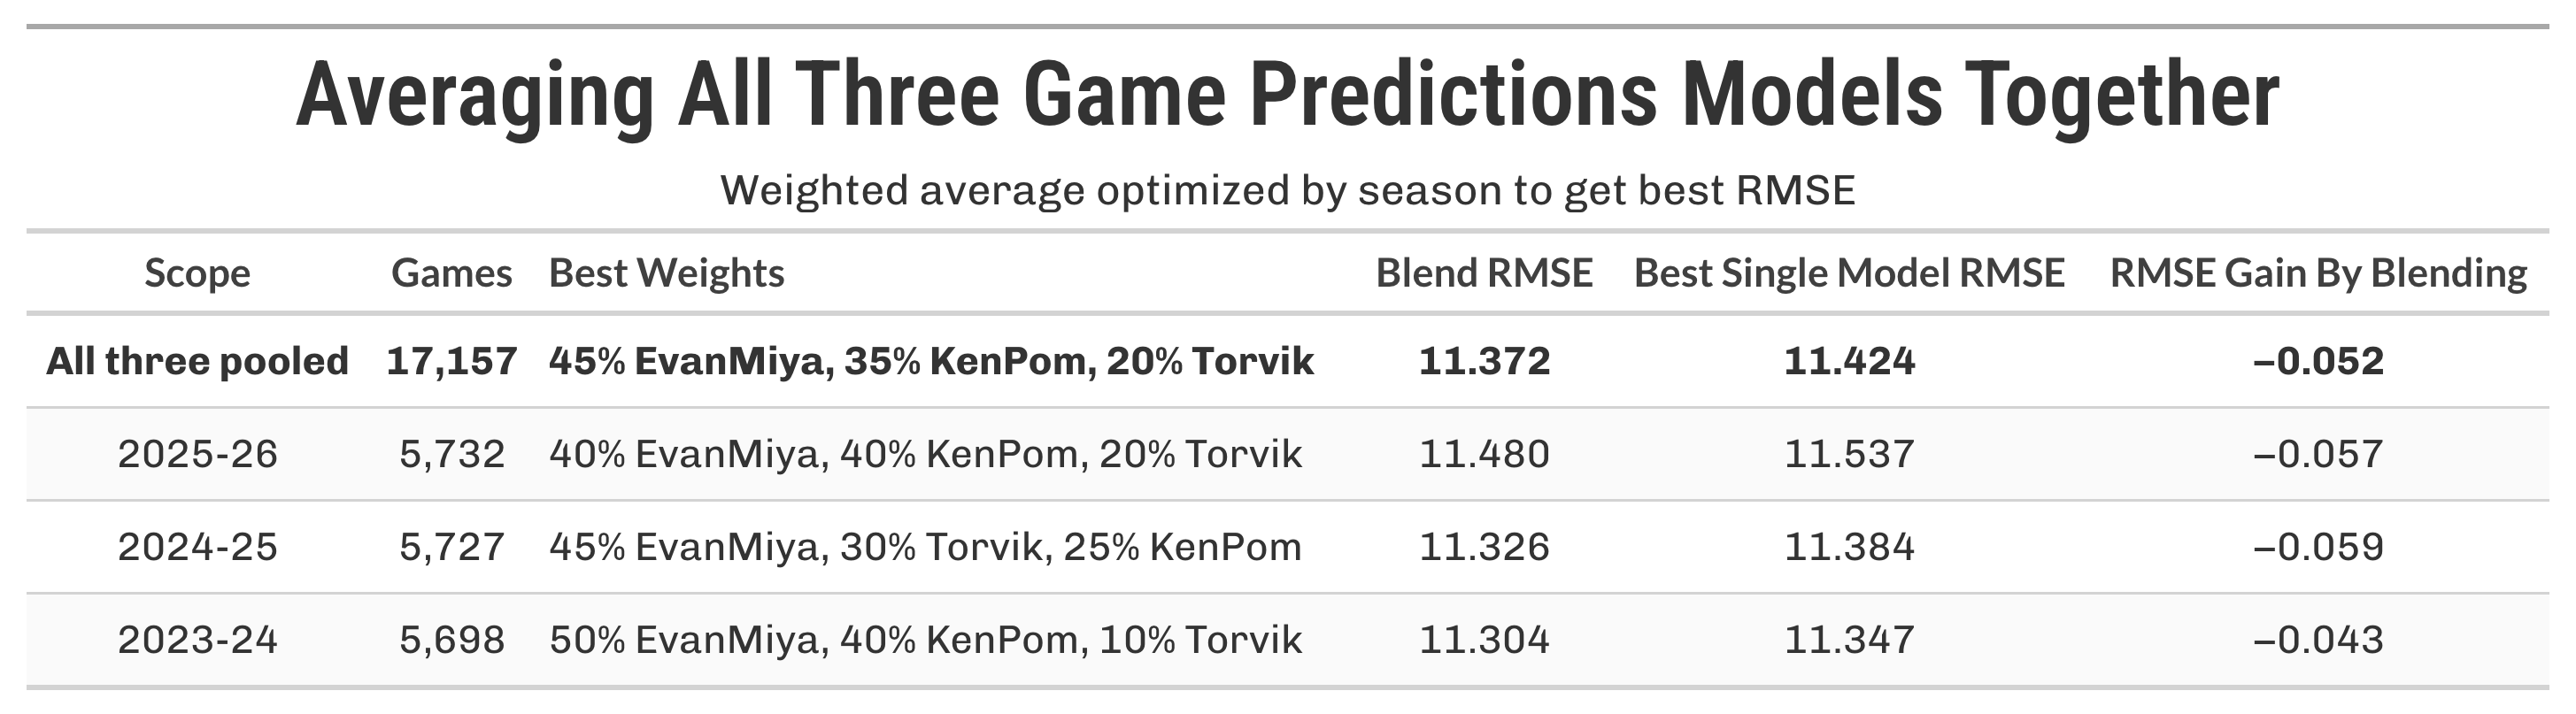
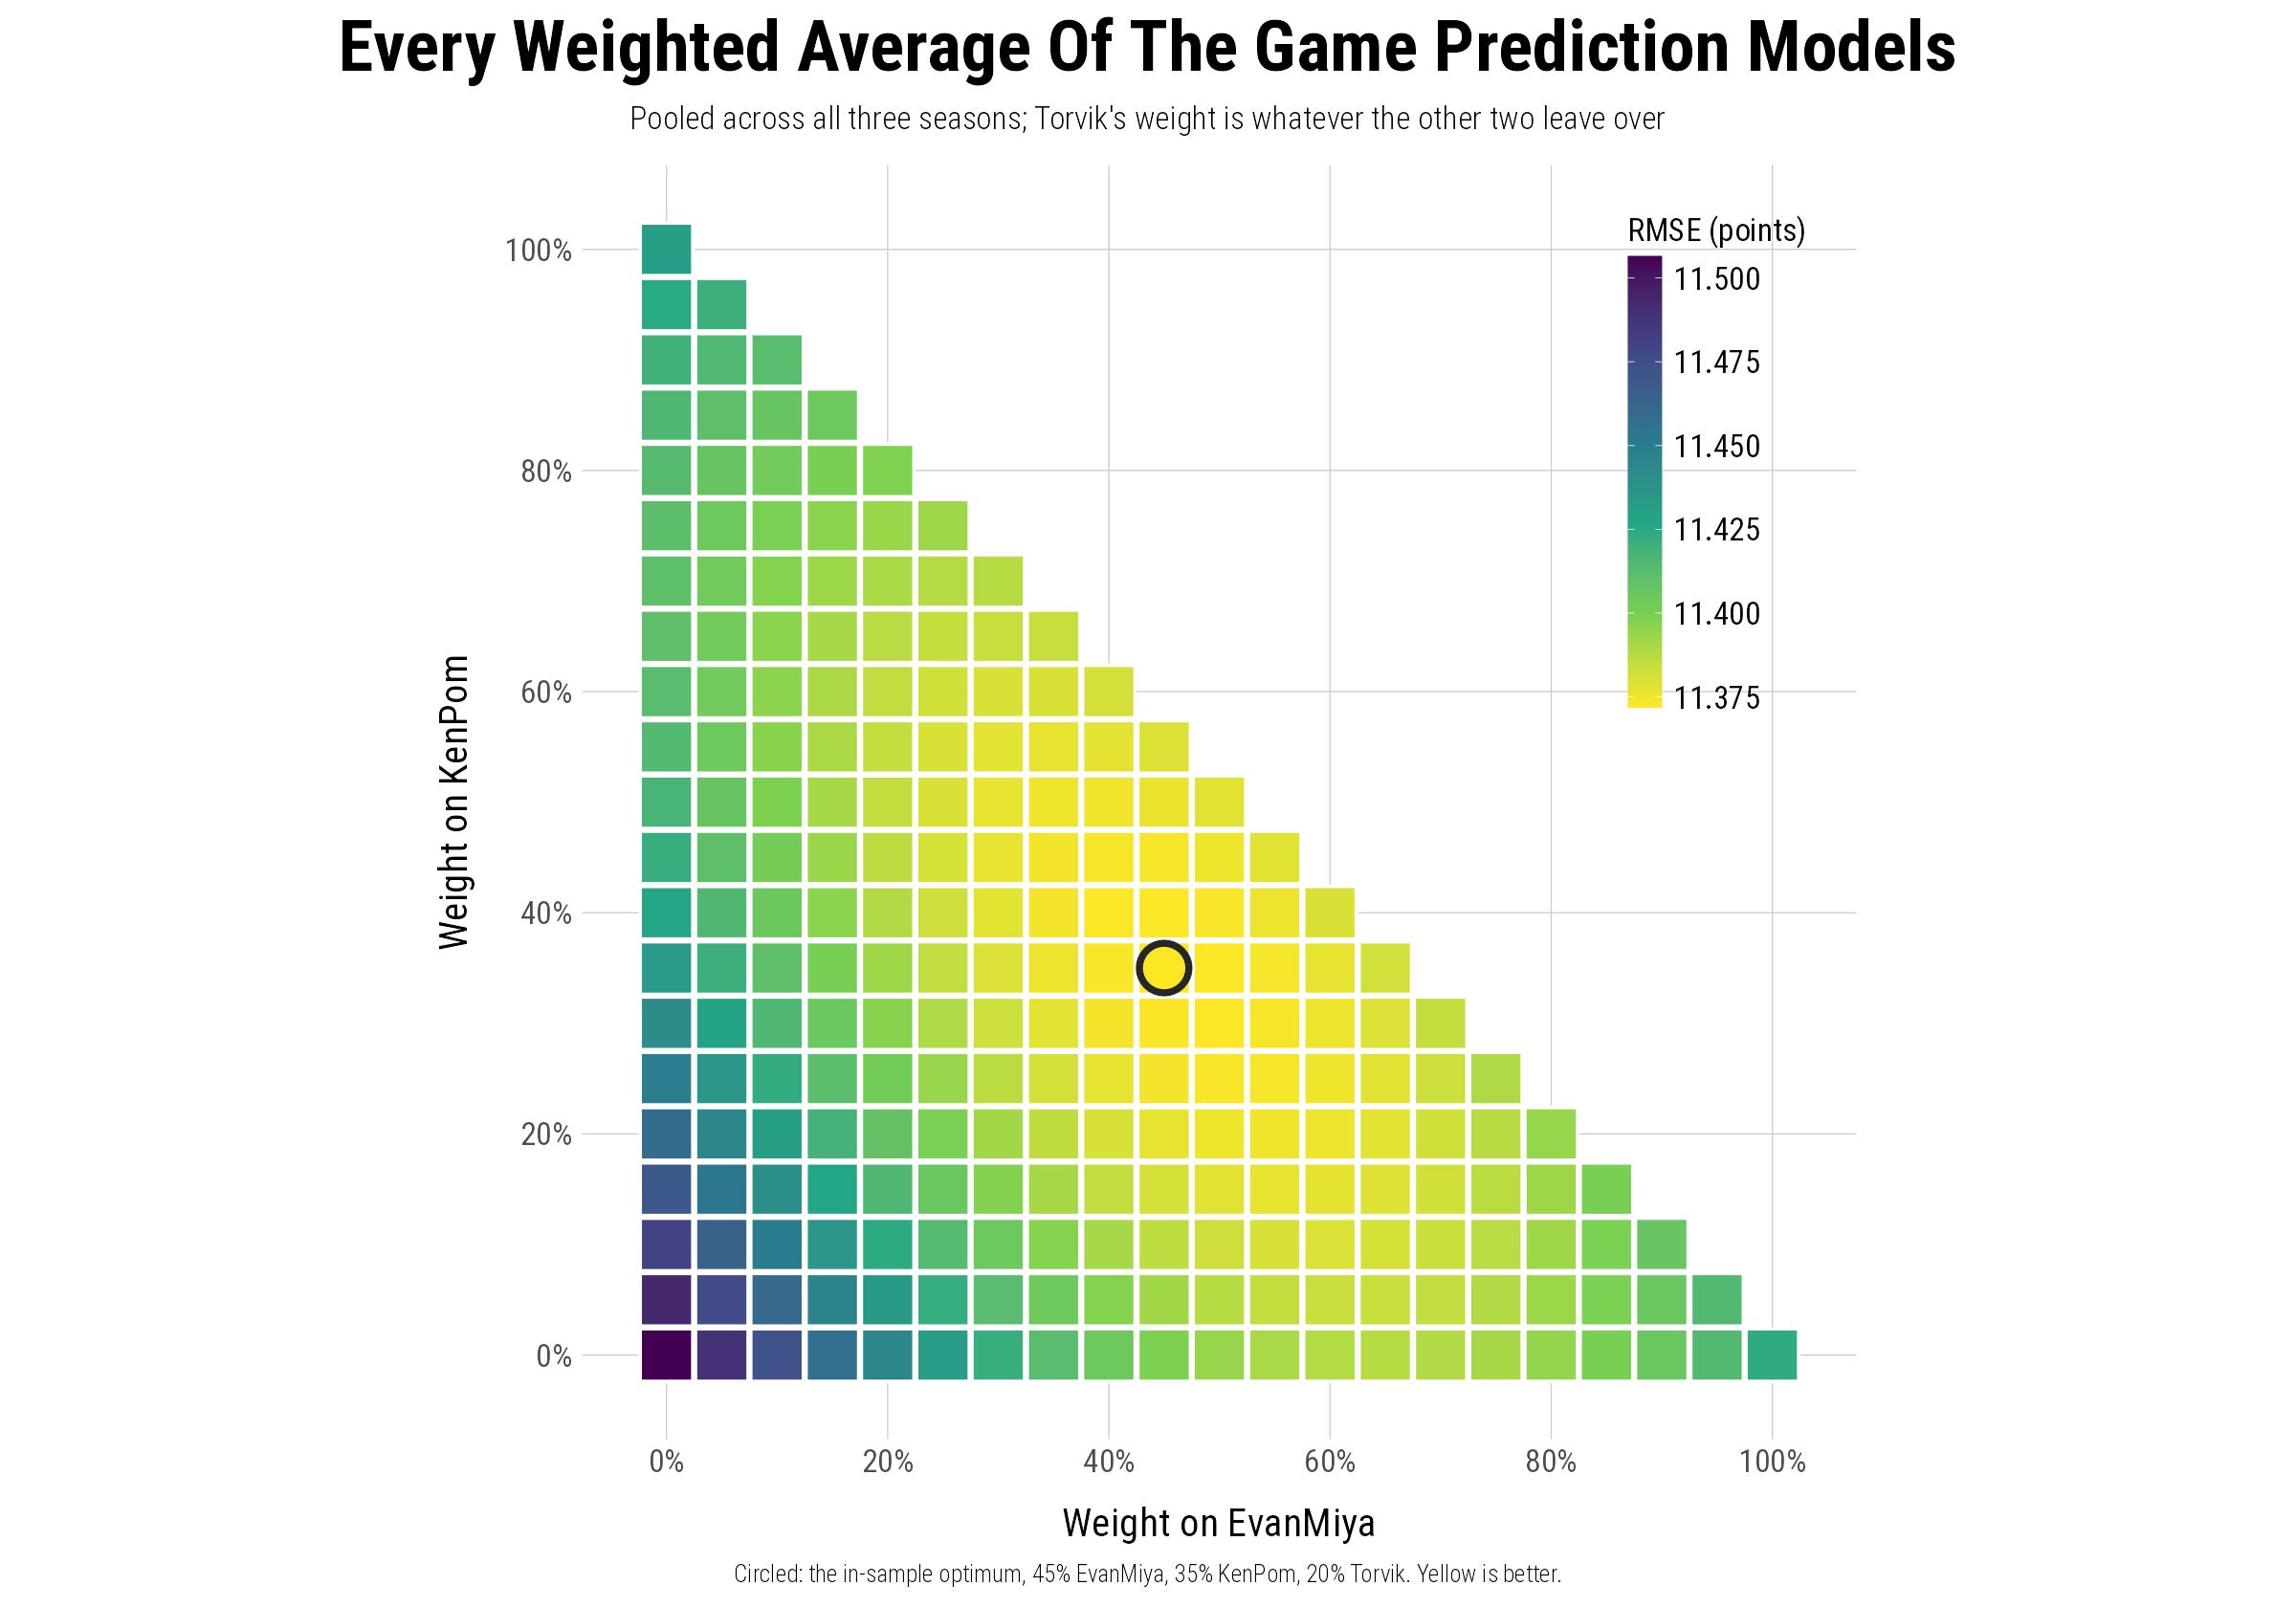
When combining the last three seasons, the best game spread predictions came from giving 45% weight to the EvanMiya prediction, 35% weight to KenPom, and 20% weight to Torvik. This combination has varied slightly by season but has generally been pretty consistent.1
The graph below shows the accuracy of all possible combinations of these model weights:
Preseason Team Rankings Comparison
This part is a bit harder, since we don’t have an obvious objective truth to grade the preseason team rankings on. We want to measure how closely the preseason team rankings mirror full-season performance, but there isn’t an easy outcome variable to use. Here are some candidates I considered that don’t make sense:
End-of-season adjusted team efficiency margin: There isn’t one ground truth for this, as all three supercomputers use slightly different formulas to calculate it.
Tournament seeding: The selection committee uses the KenPom and Torvik models as part of the seeding process. Additionally, judging accuracy only based on teams that make the field severely reduced the number of data points we can use, and teams that miss the tournament drop out entirely.
We also can’t fairly compare the preseason efficiency rating values of the three models since they are on slightly different scales. The only reasonable thing we can do is compare the order of the team rankings to an outcome that doesn’t really involve a computer algorithm.
Predicting Conference Standings
The most effective way I could think of to standardize all algorithms is to compare each model’s preseason conference team rankings with the final conference standings based on win percentage. While this has some flaws (not all teams play equal conference schedules, and it doesn’t account for all the games played in a season), it gives us a large dataset and lets us analyze all D1 teams, not just those who make the tournament.
Here’s how this works for a particular conference such as the ACC:
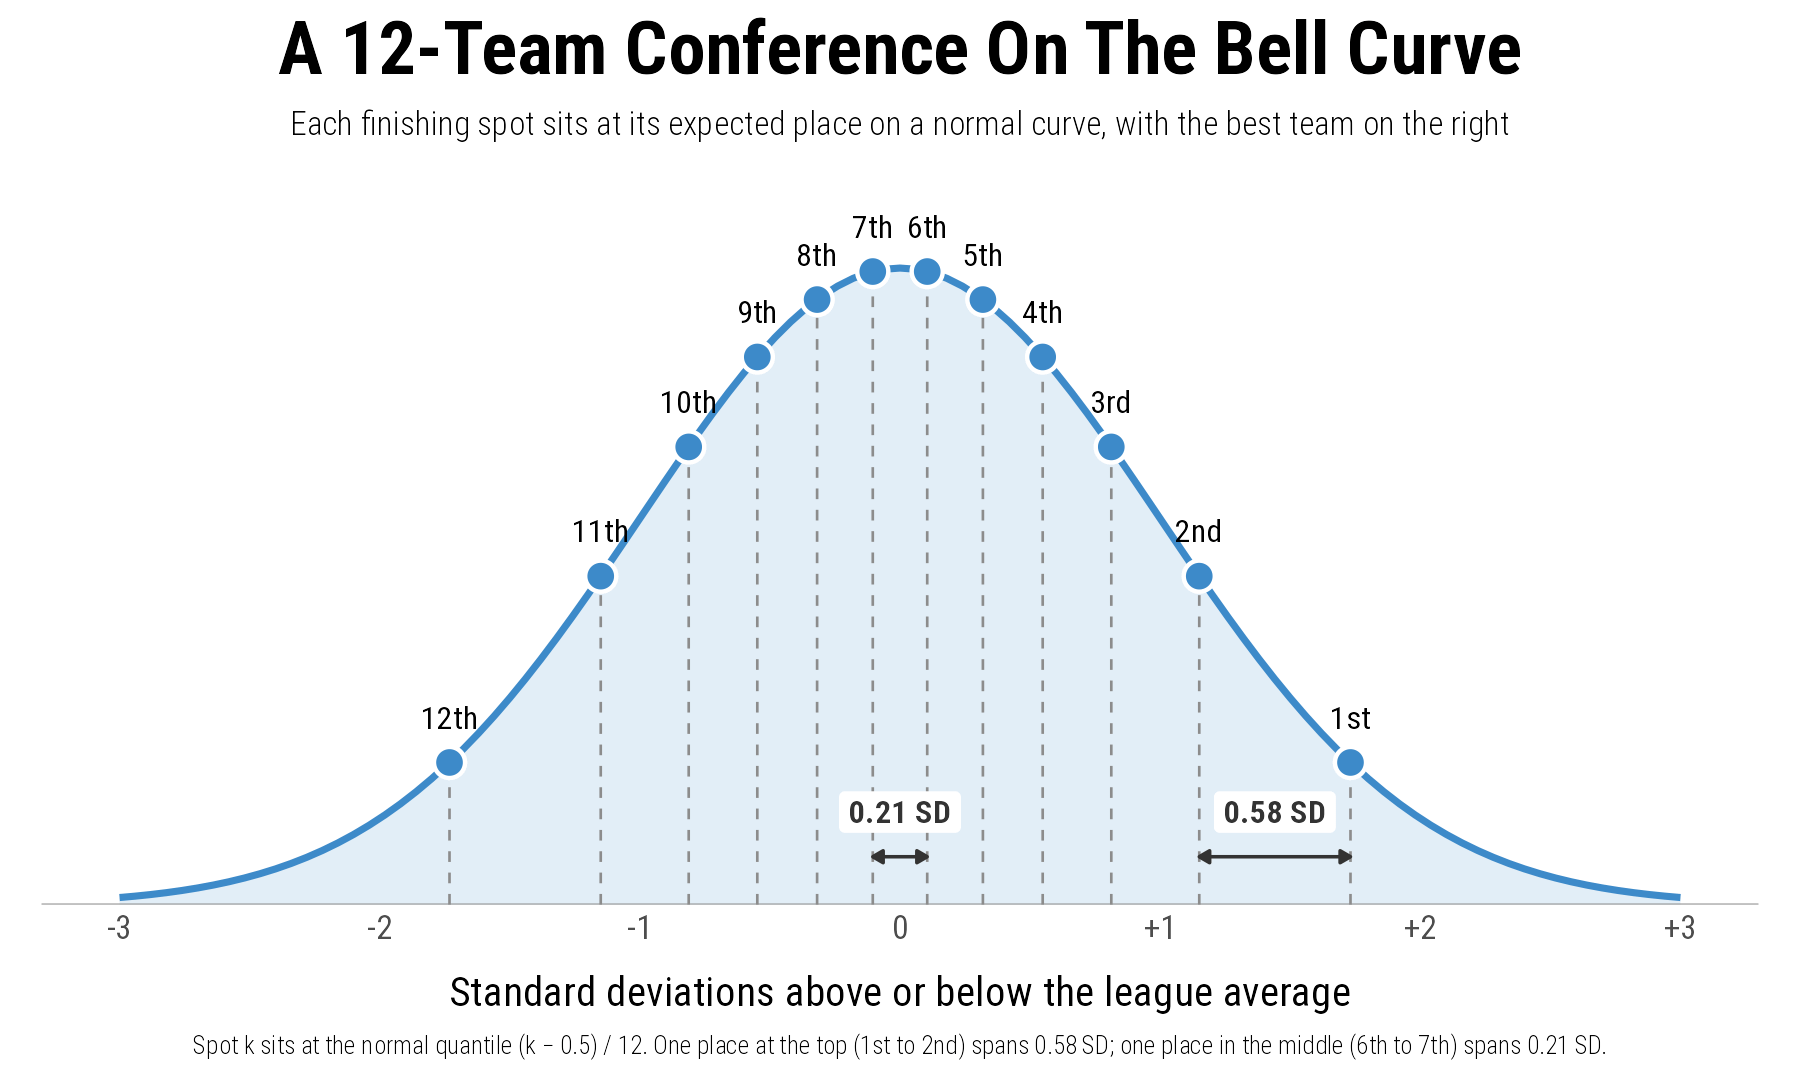
Take the EvanMiya (or other model) preseason rankings for the ACC and convert each rank into the position it would occupy on a bell curve (normal distribution).2
Take the final conference standings rankings based on win percentage and convert them into bell-curve values.
Measure the difference between the predicted bell-curve value and the final bell-curve value.
Teams in a given conference are not typically evenly spaced in team quality. More often, they are “normally distributed,” meaning most teams are clustered in the middle, with the best and worst teams more spread out at the top and bottom. We statistically tested this assumption and found it reasonable. With this conversion, we can penalize an algorithm more for misses at the extremes of the conference, since those are usually easier to rank because the teams there are further apart in quality. For example, in a conference of 16 teams, a model would receive a harsher penalty if it predicted the 1st-place team to finish 5th, rather than if it predicted the 6th-place team to finish 10th.
The table below shows the accuracy of the models in predicting conference standings across the last three seasons:
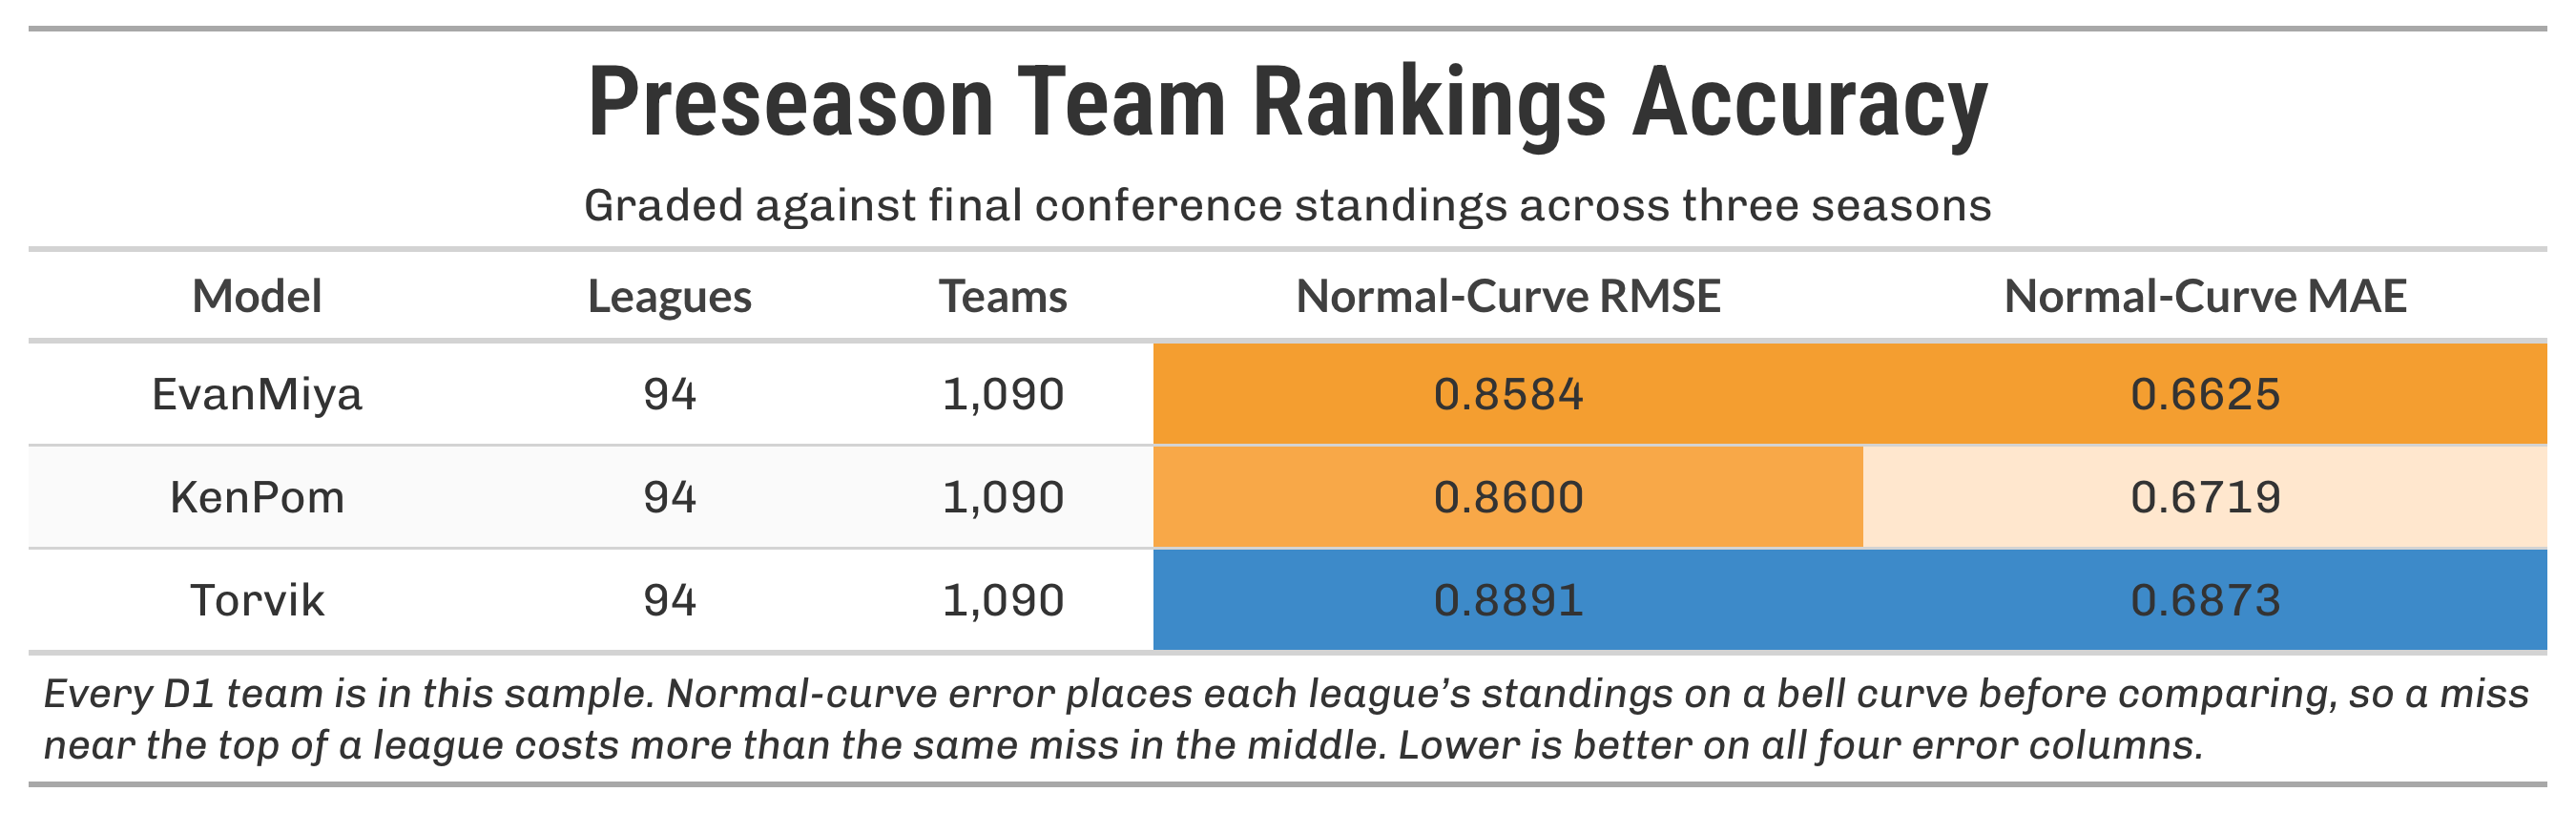
Using this grading system, the EvanMiya preseason model is the most accurate by RMSE and MAE, with KenPom fairly close in second and Torvik further back in third.
The graph below shows how each algorithm has performed by season. Notably, KenPom was clearly the best in 2023-24, was virtually tied with EvanMiya the next year, and then fell off a little in 2025-26 with EvanMiya ahead of the others.
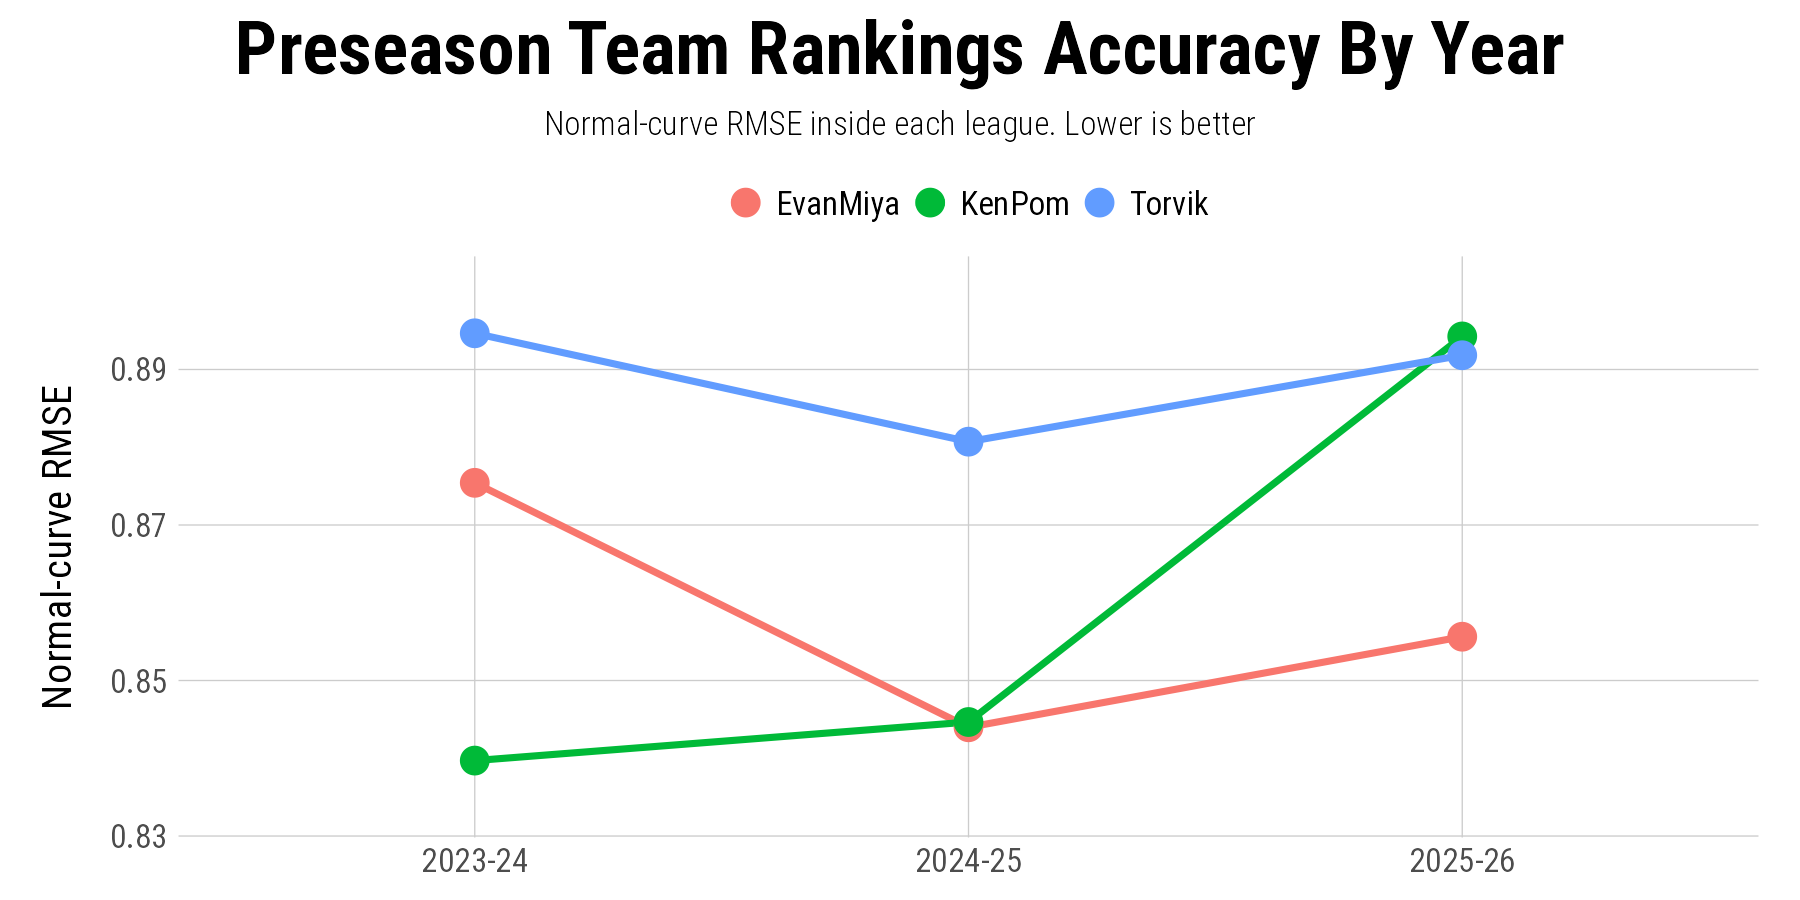
I will caveat here that, compared to the game predictions analysis we did earlier. These results can shift around a lot more based on small changes in the rankings. I wouldn't be as confident that these model rankings will stay consistent in future years.
Unlike the game predictions study, the conference standings predictions were too unstable to find the best weighted average of all three algorithms. The best blend of the three models varied wildly from season to season.
Summary
Broadly, the EvanMiya and KenPom models were more accurate than Torvik in both game predictions and preseason team rankings across the three seasons.
For predicted game spreads, the EvanMiya and KenPom algorithms virtually tied in accuracy. All three models still add value: a combination of 45% EvanMiya, 35% KenPom, and 20% Torvik outperformed any single model.
Preseason team-ranking accuracy is harder to judge, but EvanMiya came out on top based on predicting conference regular-season standings across all three years.
Want To Learn More?
Please check out all three sites, as they provide fantastic tools that the other platforms don’t. KenPom.com is the most widely referenced computer model in college basketball; BartTorvik.com is completely free and offers tools like predicted tournament odds and filterable player stats tables that are extremely popular; and EvanMiya.com does a ton of unique work on the player modeling and evaluation side.
I’m not writing today’s article to go more in-depth on the EvanMiya CBB Analytics platform, so if you want to learn more, subscribe to this blog and check out the site!
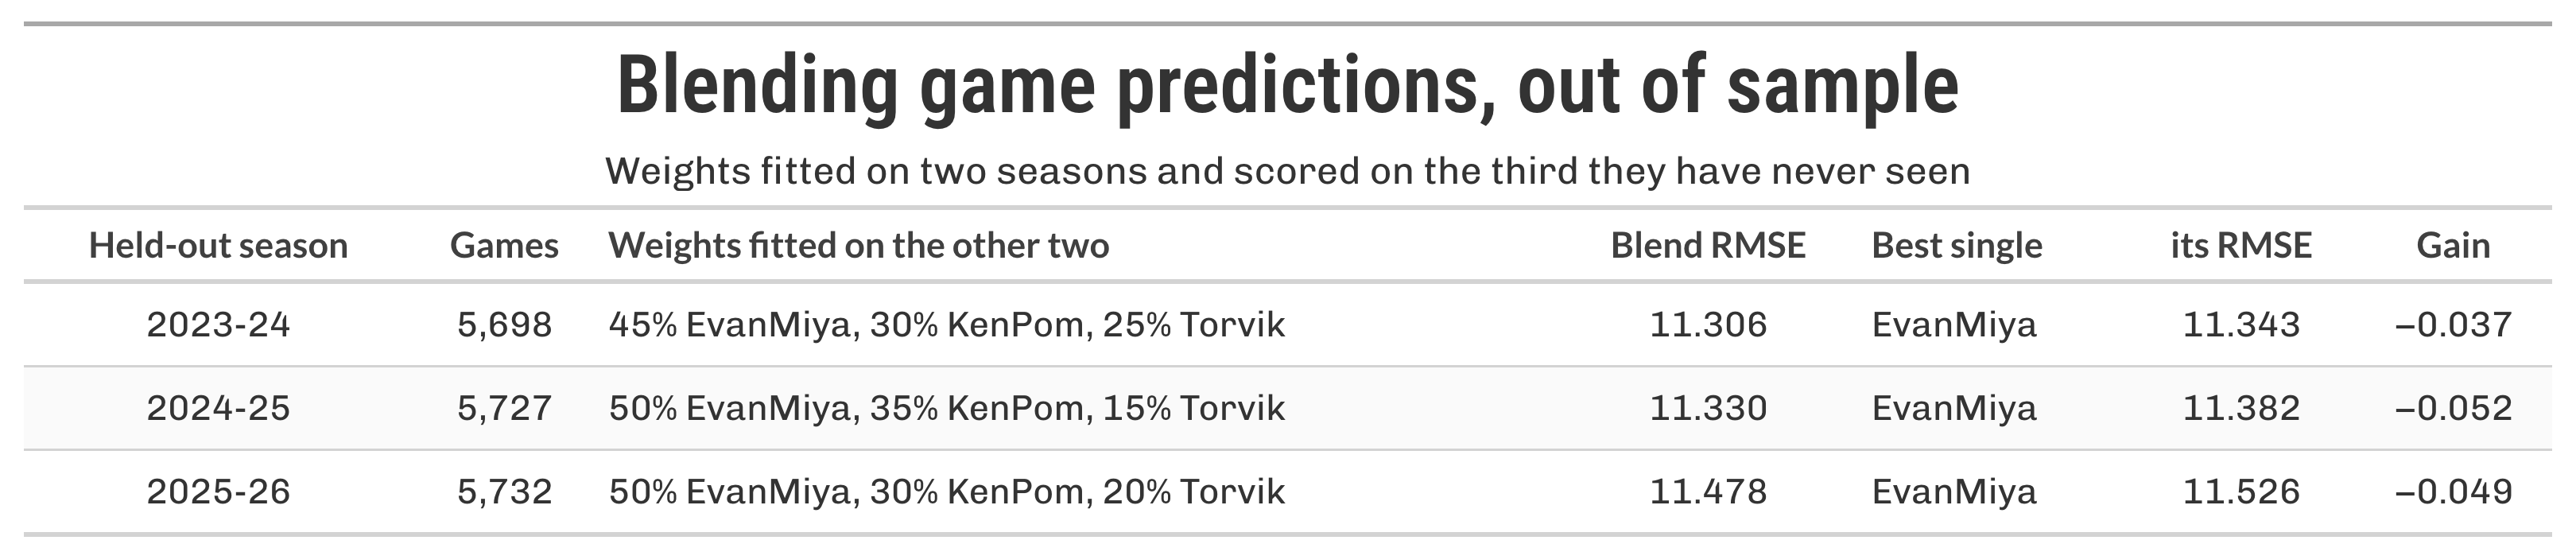
These weightings are in-sample. Doing out-sample weighting (fitting on two seasons, predicting on a third) produced similar results:
An example of how a conference of 12 teams would have their rankings placed on the bell curve:
always thought EvanMiya was just a cool name but it was actually a person woah
Hi Evan, I really enjoyed this article and love the concept.
I do something similar on the CFB side, with a process that tracks ~ 60 different projection models with a lot of the same KPIs. Congrats on such a solid MAE in your model, that's not easy to do.
https://public.tableau.com/app/profile/andrew.percival/viz/CFBPicker/Standings
I agree on the ensemble approach, that's what I do in college football, and the results are similar in that it outperforms most of the single inputs.
https://public.tableau.com/app/profile/andrew.percival/viz/CFBMetricsConsensus/All