The Power of The 10-0 Run
The scoring metric that measures "spurtability" and what it means for all 68 tournament teams
There are several phrases in the basketball lexicon that refer to a team’s ability to score a bunch of points in a hurry, such as “spurtability”, “scoring spree”, and “going on a run”. There is nothing that gets a crowd more fired up than seeing a team score basket after basket without the opponent scoring in reply. Even Charles Barkley is aware of the concept:
Basketball fans typically have a notion of whether their favorite team has the ability to “flip a switch” within a game or not, but this is typically not measured in an objective, quantifiable way… until now.
At EvanMiya.com, we have a metric that measures a team’s ability to go on scoring runs called the “Kill Shot”. Each scoring run is defined as any time that team scores 10 or more unanswered points against their opponent. Teams that go on many of these 10-0 scoring runs are more able to erase a deficit quickly and can also easily close the door on an opponent in a tight contest. Similarly, teams that limit opponents from having “Kill Shots” are more likely to hold on to a lead instead of allowing another team back into the game.
This metric was first introduced in January 2022 when I shared a graphic on Twitter showing each team’s scoring runs per game and runs conceded per game. Ever since then, I have been tracking it daily at EvanMiya.com and people cannot get enough of it.
Before we jump into analyzing individual tournament teams, here are the stats about scoring runs that you need to know:
A team with at least one 10-0 run wins 71% of the time
A team with more Kill Shots than the opponent wins 81% of the time
A team with 2 Kill Shots in a game wins 88% of the time
A 15-0 run leads to a win 86% of the time
A 20-0 run leads to a win 91% of the time
Now that we have the official March Madness bracket for 2023, let’s get straight to how tournament teams have fared according to the “Kill Shot” metric this season. One quick note: In the past, I have shared graphs that show each team’s average 10-0 runs per game, which is pretty useful but does not account for strength of opposition. There could be two teams who both average 0.8 scoring runs per game, but one plays in the Big 12 and the other plays in the… well pretty much any other conference. To improve on this, I have developed a statistical model that adjusts for opponent quality and calculates each team’s “expected scoring runs per game” against an average D1 opponent.
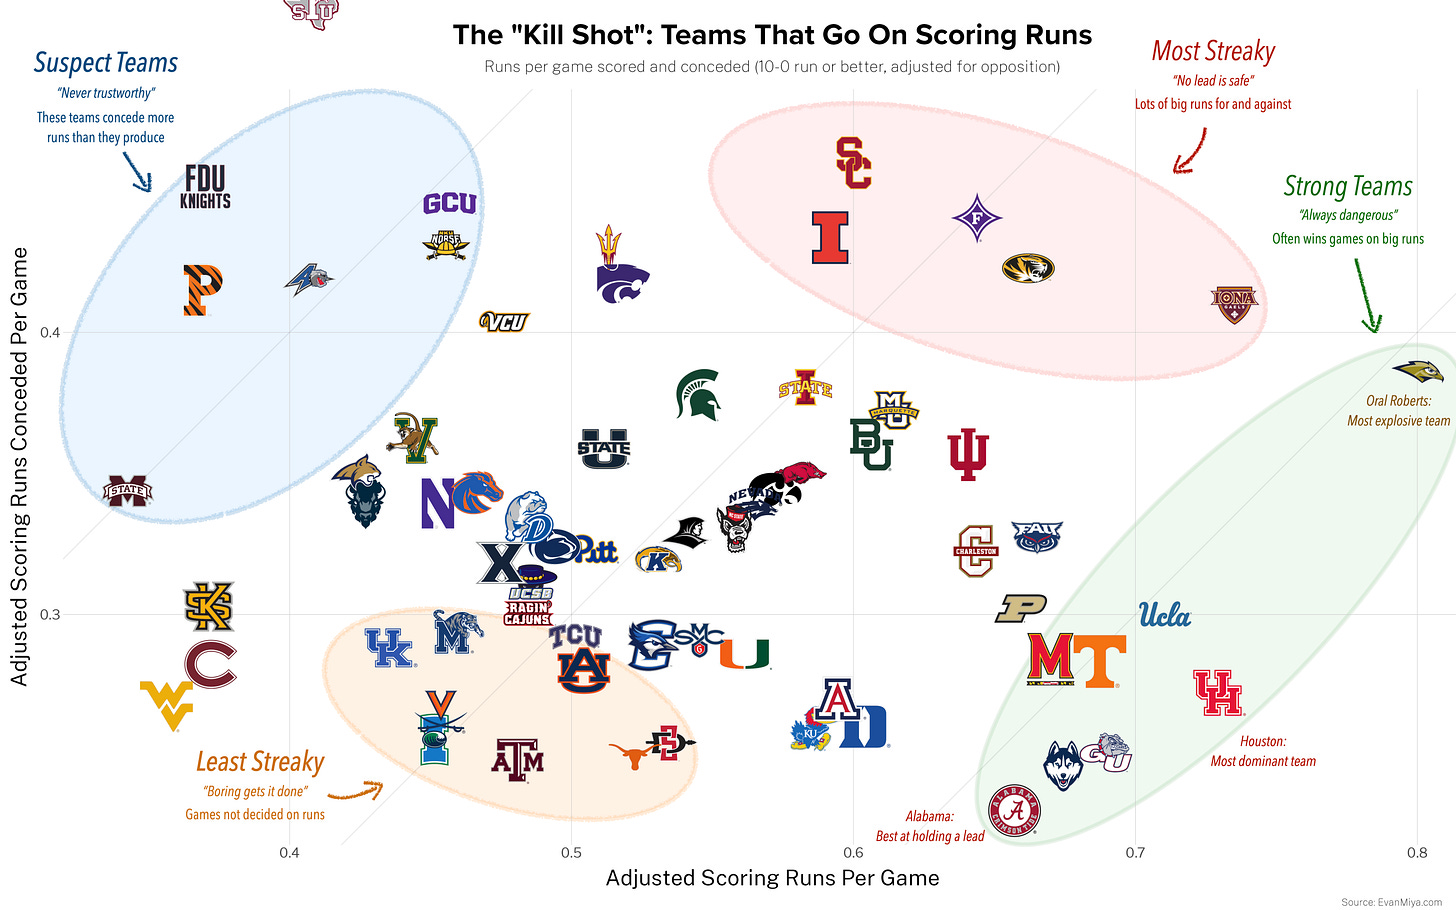
Without further ado, here is the landscape of all tourney teams in 2023 in terms of scoring runs per game and scoring runs conceded per game, adjusted for opponent quality (click on the image for a high resolution view):
As shown on the graph, I like to put teams in four categories: “Strong” teams, “Streaky” teams, “Least Streaky” teams, and “Suspect” teams.
It’s no surprise that the teams with the biggest difference between Kill Shots for and against are also some of the biggest analytical darlings in the country. 6 of the 8 teams in the “Strong” category are in the top 7 teams in the country at EvanMiya.com, with only Purdue missing. Houston has been rock solid in this metric all season, though their 10-0 runs per game has slipped over the last several weeks.
The big standout team though is Oral Roberts. The Golden Eagles have a comfortable lead in Kill Shots per game this season, having totaled 34 10-0 runs in just 30 games against D1 competition. Even after adjusting for opponent strength, they still are expected to have more of these scoring runs per game than any other team in the country. This could be a scary reality for Duke, their first round opponent on Thursday, since you can never count Paul Mills and his team out until the game clock hits 0:00. ORU should be expecting at least one Kill Shot in that game, so be on the lookout for the run when it comes.
This is where we can really have some fun with this metric. The five tournament teams in the “streaky” category are all very capable of going on scoring runs… but they also give them up just as quickly. Games with these teams are often wild, with quick lead changes back and forth. No game with a “streaky” team is over, win or lose, until the very end. Just ask Missouri fans and they will tell you that every Tigers game feels like a rollercoaster until the very end.
There are two main takeaways for teams in the “streaky” category. First, they are vulnerable as a favored team but also have more upset potential in games where they are the underdog. Because of the fact that scoring spurts can happen at any time in either direction, their games are very unpredictable. A team like Illinois could either flame out in the first round or get hot and go deep in the tournament. And you really don’t know which one will happen.
The other takeaway is that live spreads for games with these teams could be less accurate because any lead could be vaporized quickly. If a team like Iona is down 10 at halftime, they will be more likely to mount a comeback than most other teams of similar quality.
In contrast to the last category, we now take a look at teams in the “least streaky” group, which are more boring by nature. This season, these teams have not had as many 10-0 runs, but they also rarely give them up. Texas A&M Corpus-Christi has only allowed 2 Kill Shots all season!
Teams in the “least streaky” category are pretty trustworthy when they have a lead since they are not very likely to allow the opposition back into the game quickly. However, teams like Virginia and Kentucky often struggle to overcome a deficit quickly. Look to rely more on these teams when they are favored, but be cautious to count on them winning several games as an underdog.
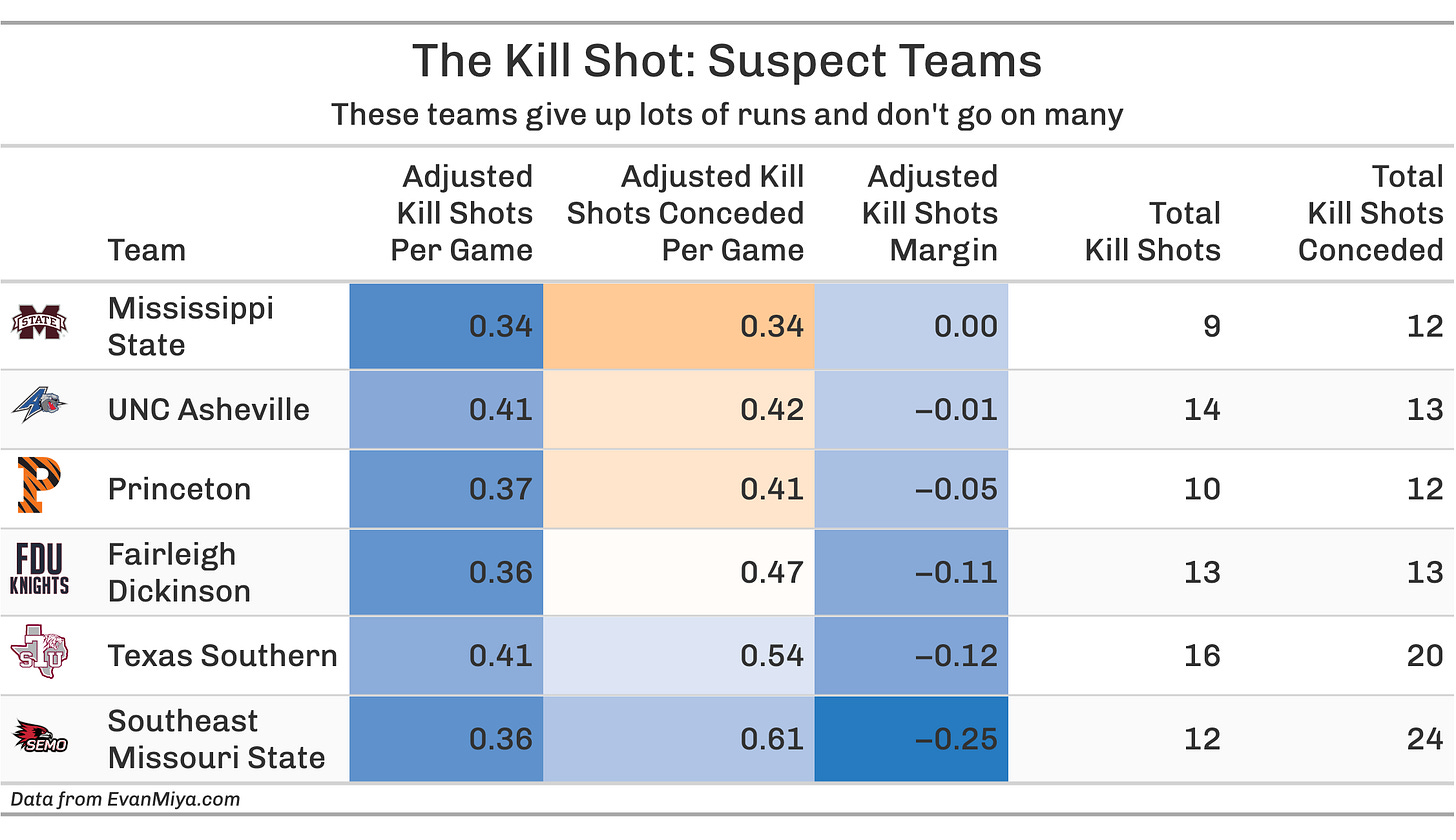
At the time of publishing, both of the teams that lost their play-in games on Tuesday night come from the “suspect” category, which is comprised of teams that are prone to giving up scoring runs to the opposition while struggling to counter on their own. Mississippi State had a 6 point lead against Pittsburgh early in the first half before Pitt went on a 10-0 run to seize control before hanging on for the win.
There’s not a lot else to say about the teams in the “suspect” category other than… good luck not getting crushed.
Now, what does all of this mean for your team’s chances of reaching a Final Four?
Let me first state that, while the Kill Shot is a useful tool, it can’t be used in a vacuum to determine who the best teams in the country are. Rather, I view it as a helpful companion to other metrics to provide more nuance about the characteristics of each team.
With that out of the way, I was able to grab play-by-play data from the previous four seasons that we had a March Madness to see if there were any common traits among Final Four teams when it came to the Kill Shot. The results are below:
With the necessary disclaimer that correlation does not equal causation, here are the interesting trends to know about Final Four teams and 10-0 runs:
13 out of the last 16 Final Four teams had an Adjusted Kill Shots Conceded of 0.32 per game or less. There are a lot of teams that meet that criteria this year, but it does rule out notable teams like Marquette (2 seed), Baylor (3), Indiana (4), Iowa State (6), Missouri (7), Michigan State (7), Iowa (8), Arkansas (8), and Illinois (9).
All of the last four national champions had an Adjusted Kill Shots Per Game of at least 0.65 and an Adjusted Kill Shots Conceded Per Game of 0.30 or lower. There are only 6 teams in the field that meet these criteria: Alabama (1 seed), Houston (1), Gonzaga (3), UConn (4), Tennessee (4), and Maryland (8).
Does that mean that the national champion will definitely come from that list? Absolutely not. It’s only based on four tournaments, which is a very small sample size. However, in future years I will dig back even further to see if these trends are seen in more seasons.
As a final note, you can get daily updated numbers on each team’s Kill Shots on the Team Ratings page at EvanMiya.com. I’ll be adding the Adjusted Kill Shots per game to the site at some point in the future as well.


What a great analysis! As someone who has dug into similar aspects of CBB, I appreciate work like this. Looking forward to a deeper dive on this in future seasons to use the kill shot as a better predictor of tourney success.
UCLA also has an adjusted kill shot per game above .65 and adjusted kill shot conceded per game at or below .30 according to the table above