

The 2025 EvanMiya.com Bracket Primer
Everything from the data that you need to know for your bracket

The bracket is here, and it is beautiful! To give you the best advice for filling out your bracket, I’ve boiled down all the analysis at EvanMiya.com into the most valuable graphics and tools you need.
In this bracket primer, we will discuss:
Who are the true title favorites?
Which teams have the most value based on where they are seeded?
Who are this year’s cinderellas?
What can the “Kill Shot” tell us about tournament success?
Without further ado, let’s dive in!
Predicted Efficiency Landscape
The place to start is by examining every tournament team’s predicted team strength at EvanMiya.com, comparing offensive and defensive efficiency. These ratings are adjusted for current injuries, which means that teams like Duke (Cooper Flagg questionable), Alabama (Grant Nelson), Texas Tech (Chance McMillian, Darrion Williams), Iowa State (Keshon Gilbert out), and Kentucky (Lamont Butler) are properly docked for the uncertainty of their players’ availability. You can find complete injury reports, updated daily, in the Matchup Previews tool at EvanMiya.com.
The graph below shows every team’s predicted offensive rating and defensive rating, with teams split into tiers based on their tournament potential:
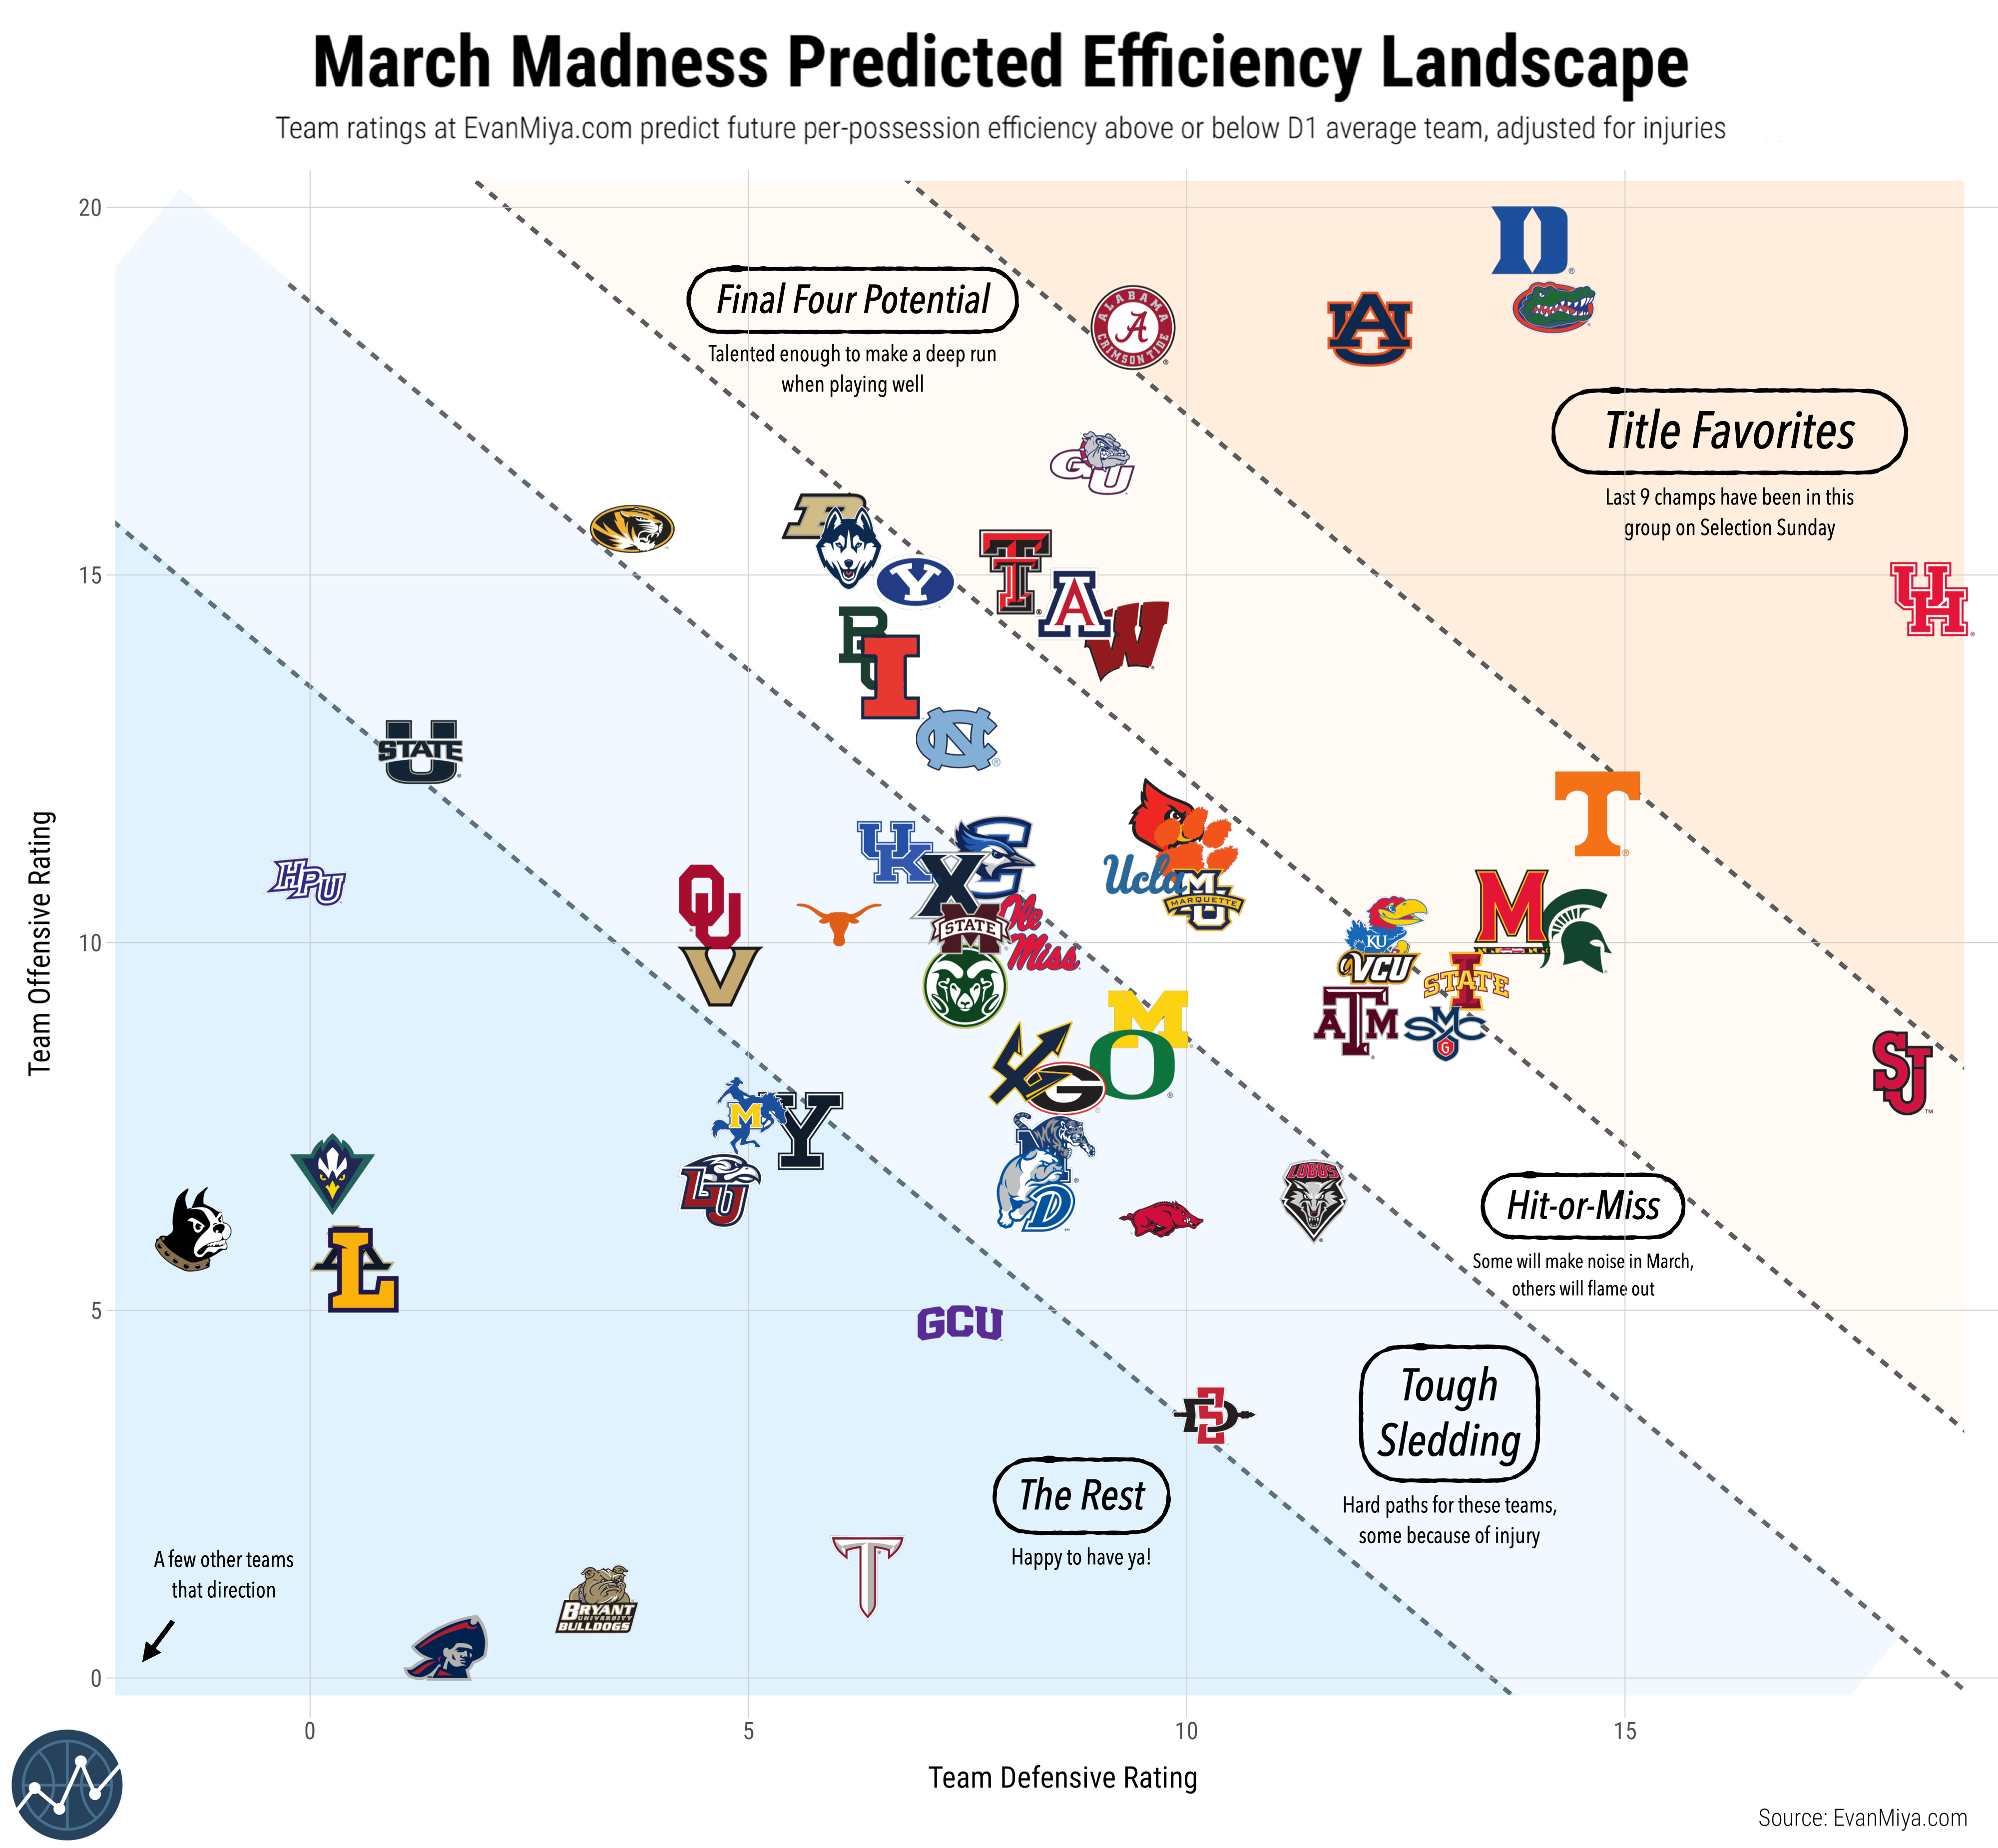
Title Favorites
As mentioned in a previous article, teams heading into the tournament in the “Title Favorites” tier have won the last 9 national titles. This year, five teams qualify: Duke (1 seed), Houston (1), Florida (1), Auburn (1), and Alabama (2).
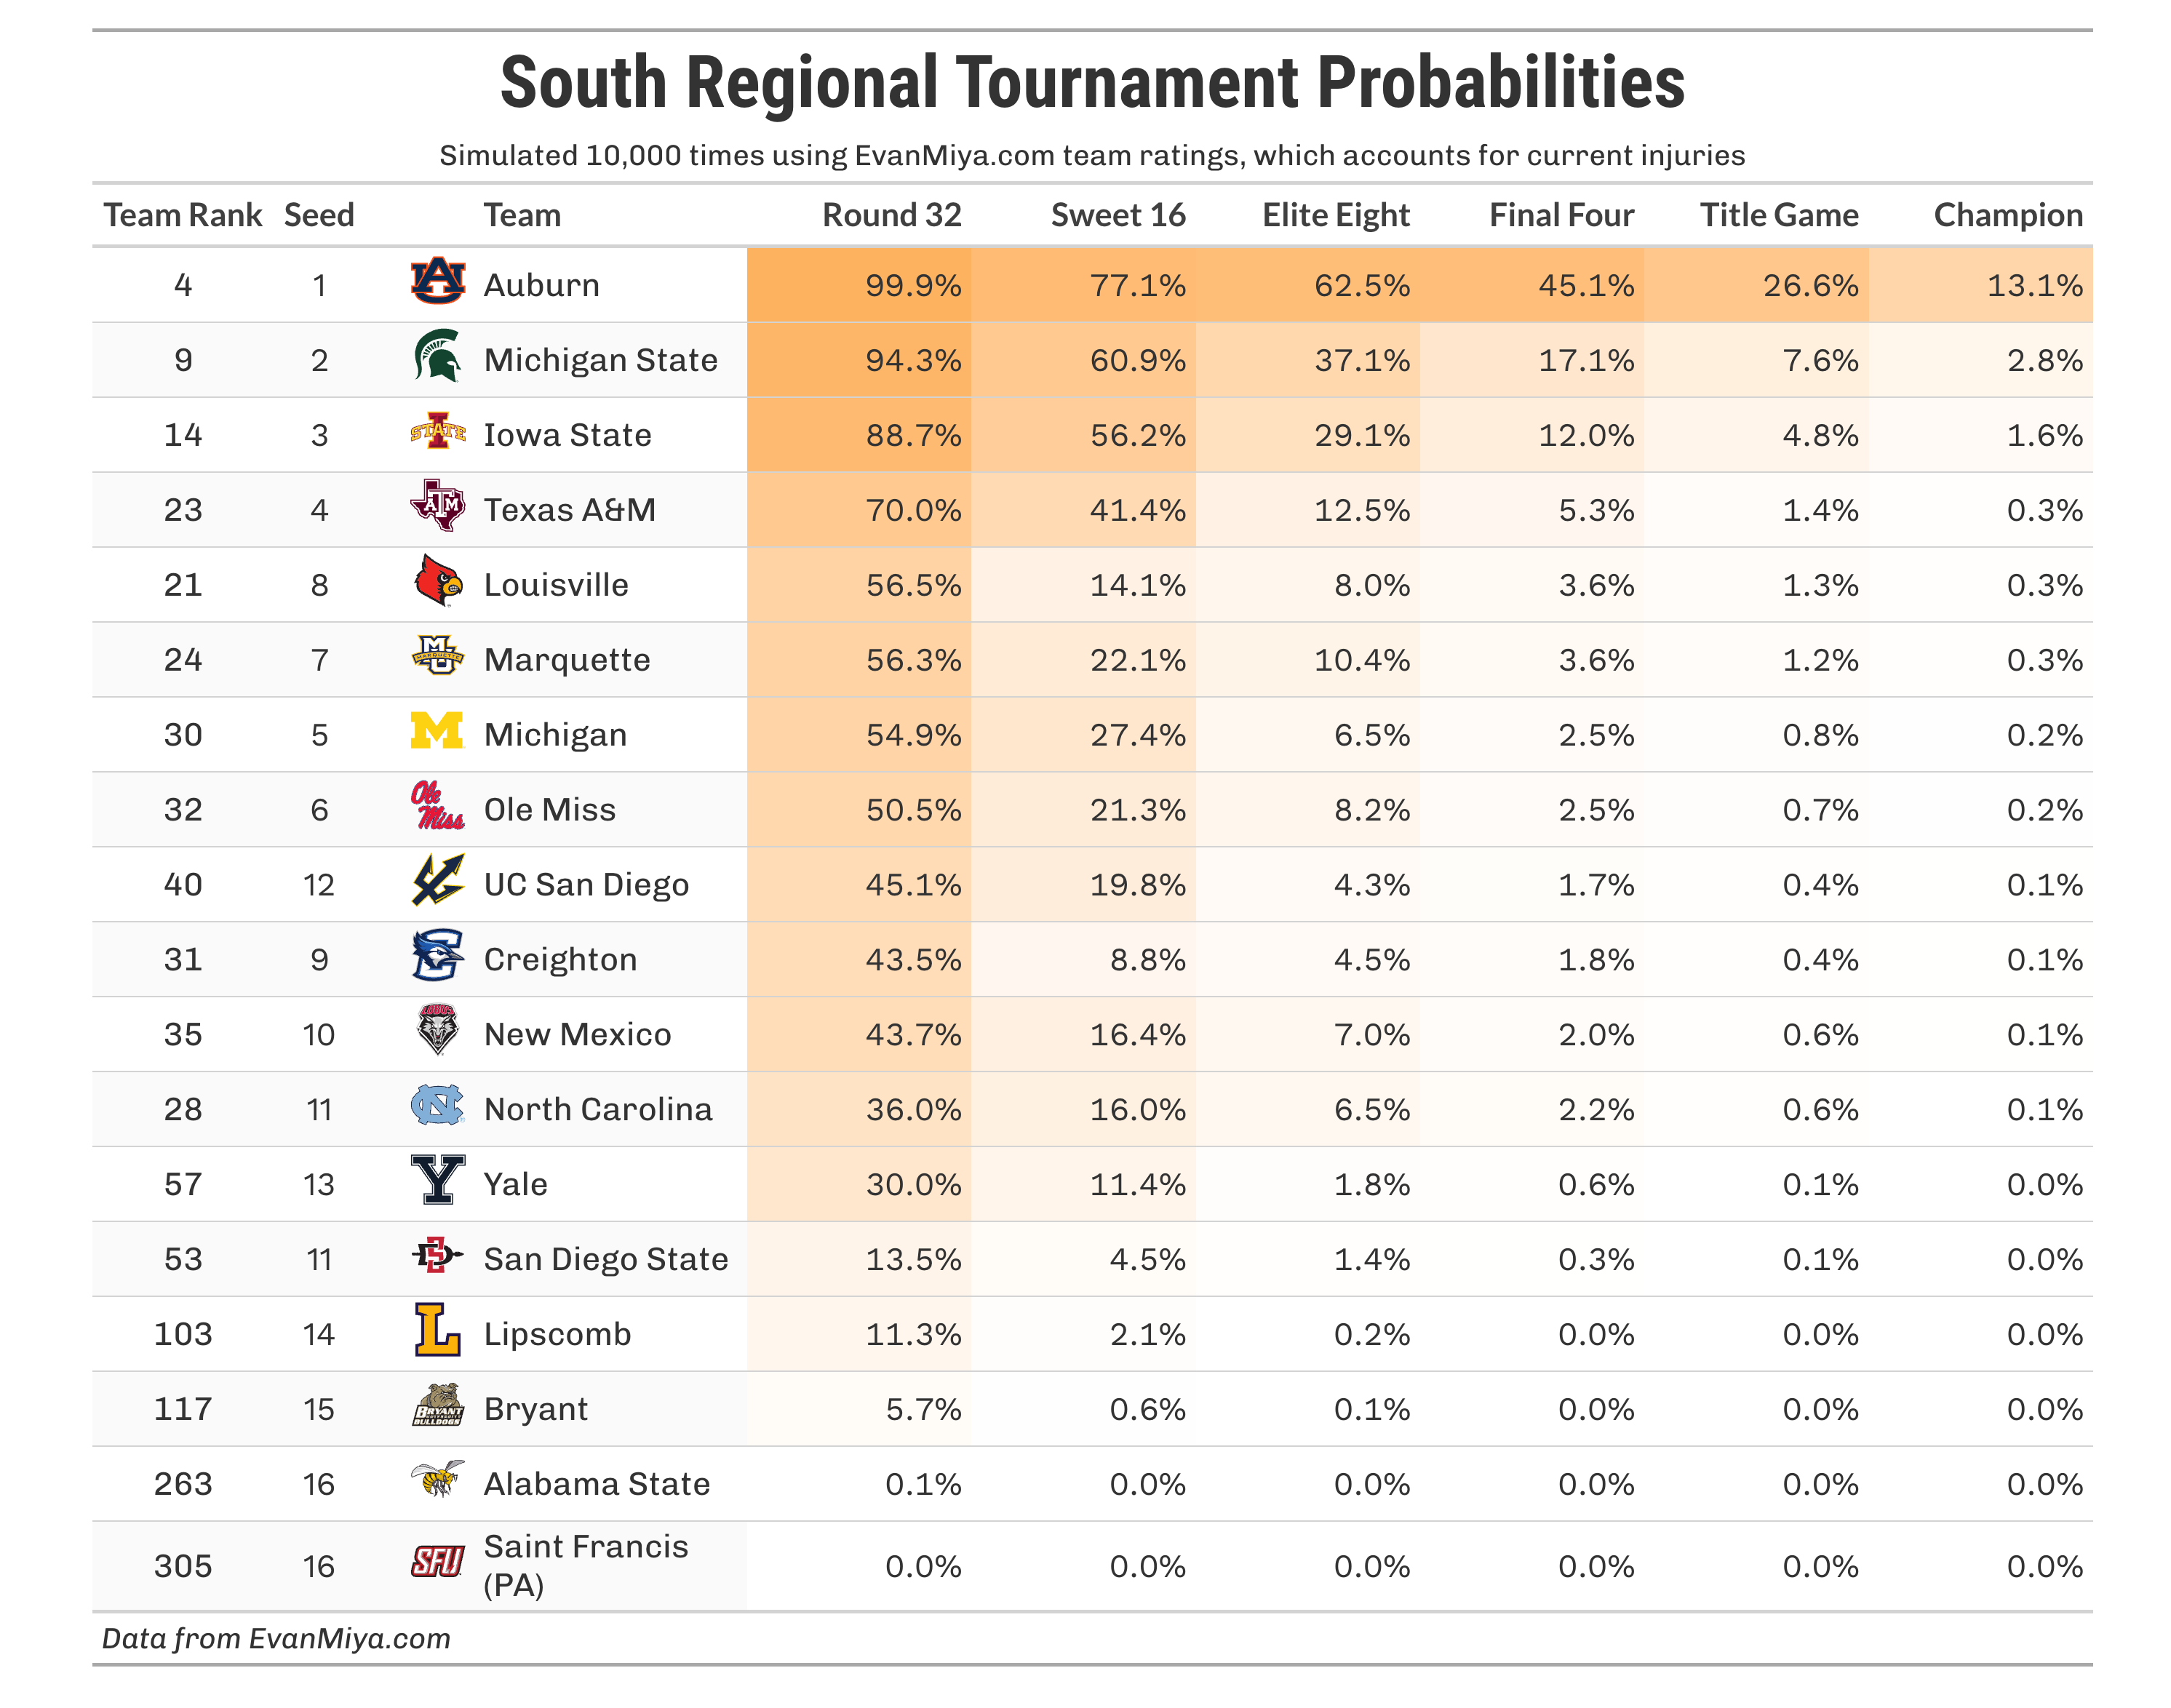
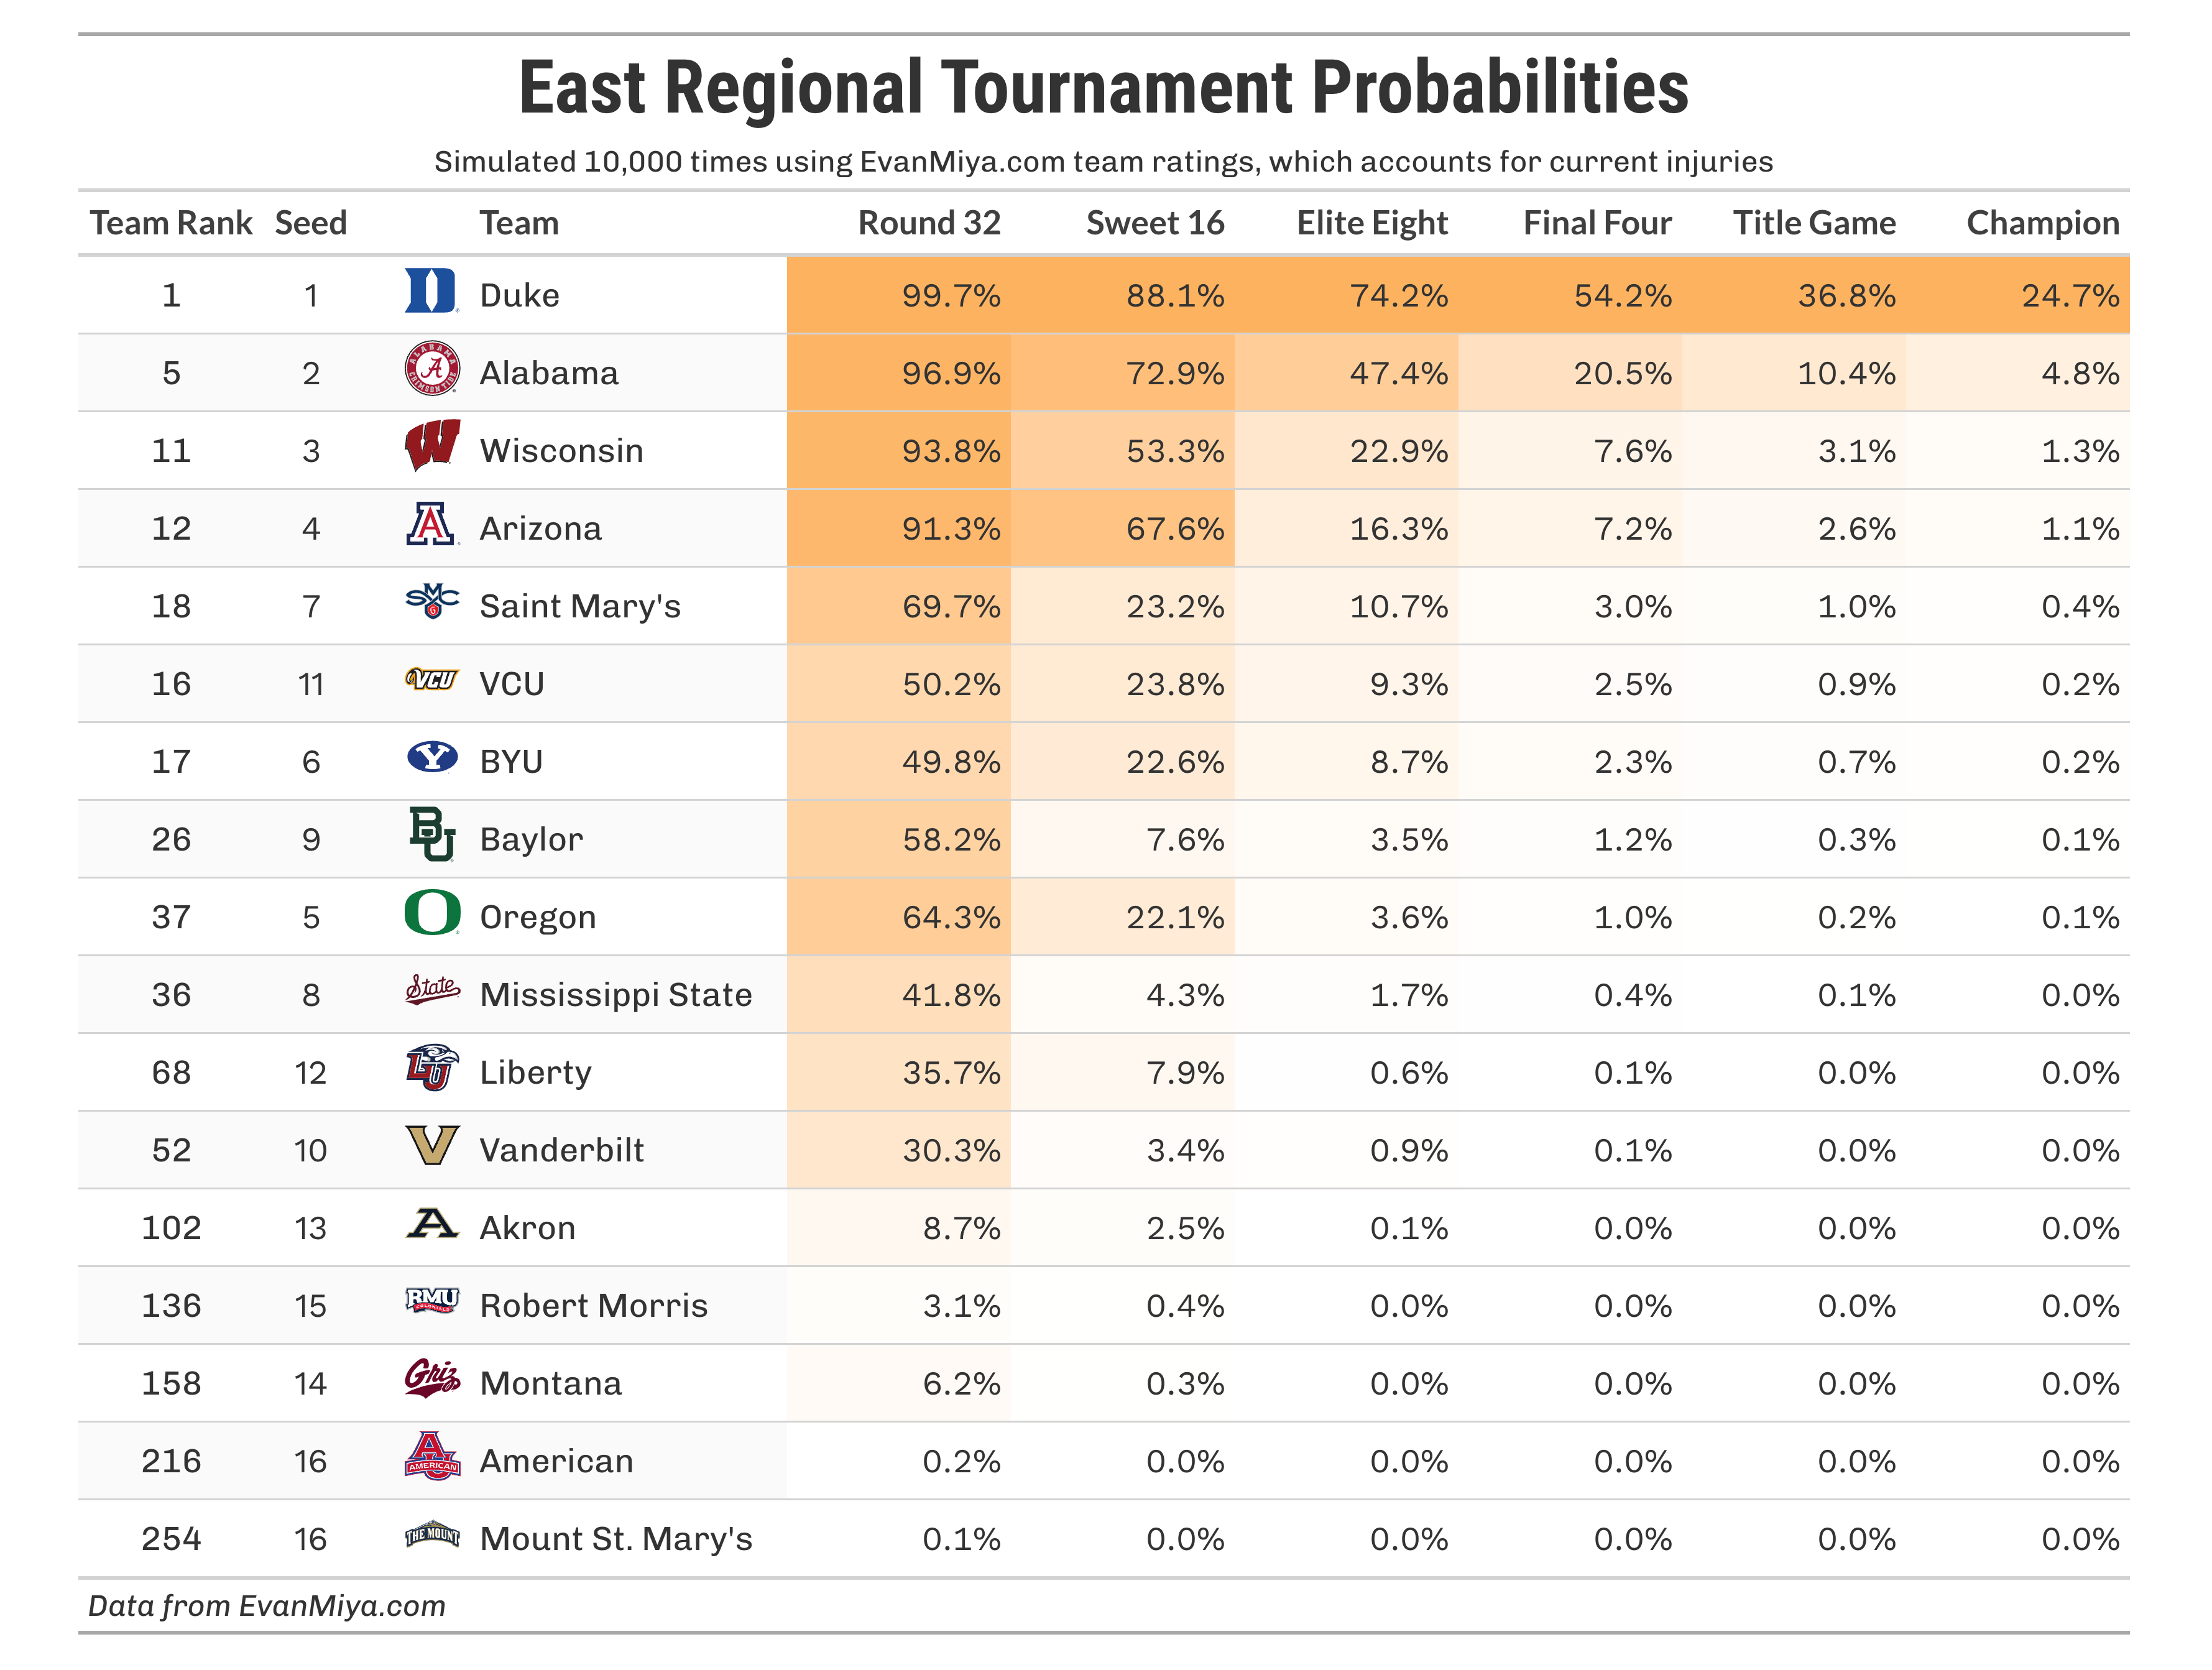
The four 1-seeds, in particular, are very strong this year. According to bracket simulations at EvanMiya.com (at the bottom of the article), there is a 68% chance that a 1-seed will win the title, which aligns with the actual track record of 1-seeds. Since 2000, 17 of the 24 national champs (71%) have been 1-seeds. Alabama is also a strong team, but they were handed a tough draw being in the same region as Duke, with just a 4.8% chance of winning the title.
Tournament Team Strength vs Bracket Seed
To better understand at how these team ratings compare to each team’s seed, I present the graph below, which highlights teams that are much stronger or weaker than usual for their seed. This is really where we can find value in the predictive analytics. Teams highlighted in orange are considered “underseeded” and advance 59% further than other teams with the same seed.
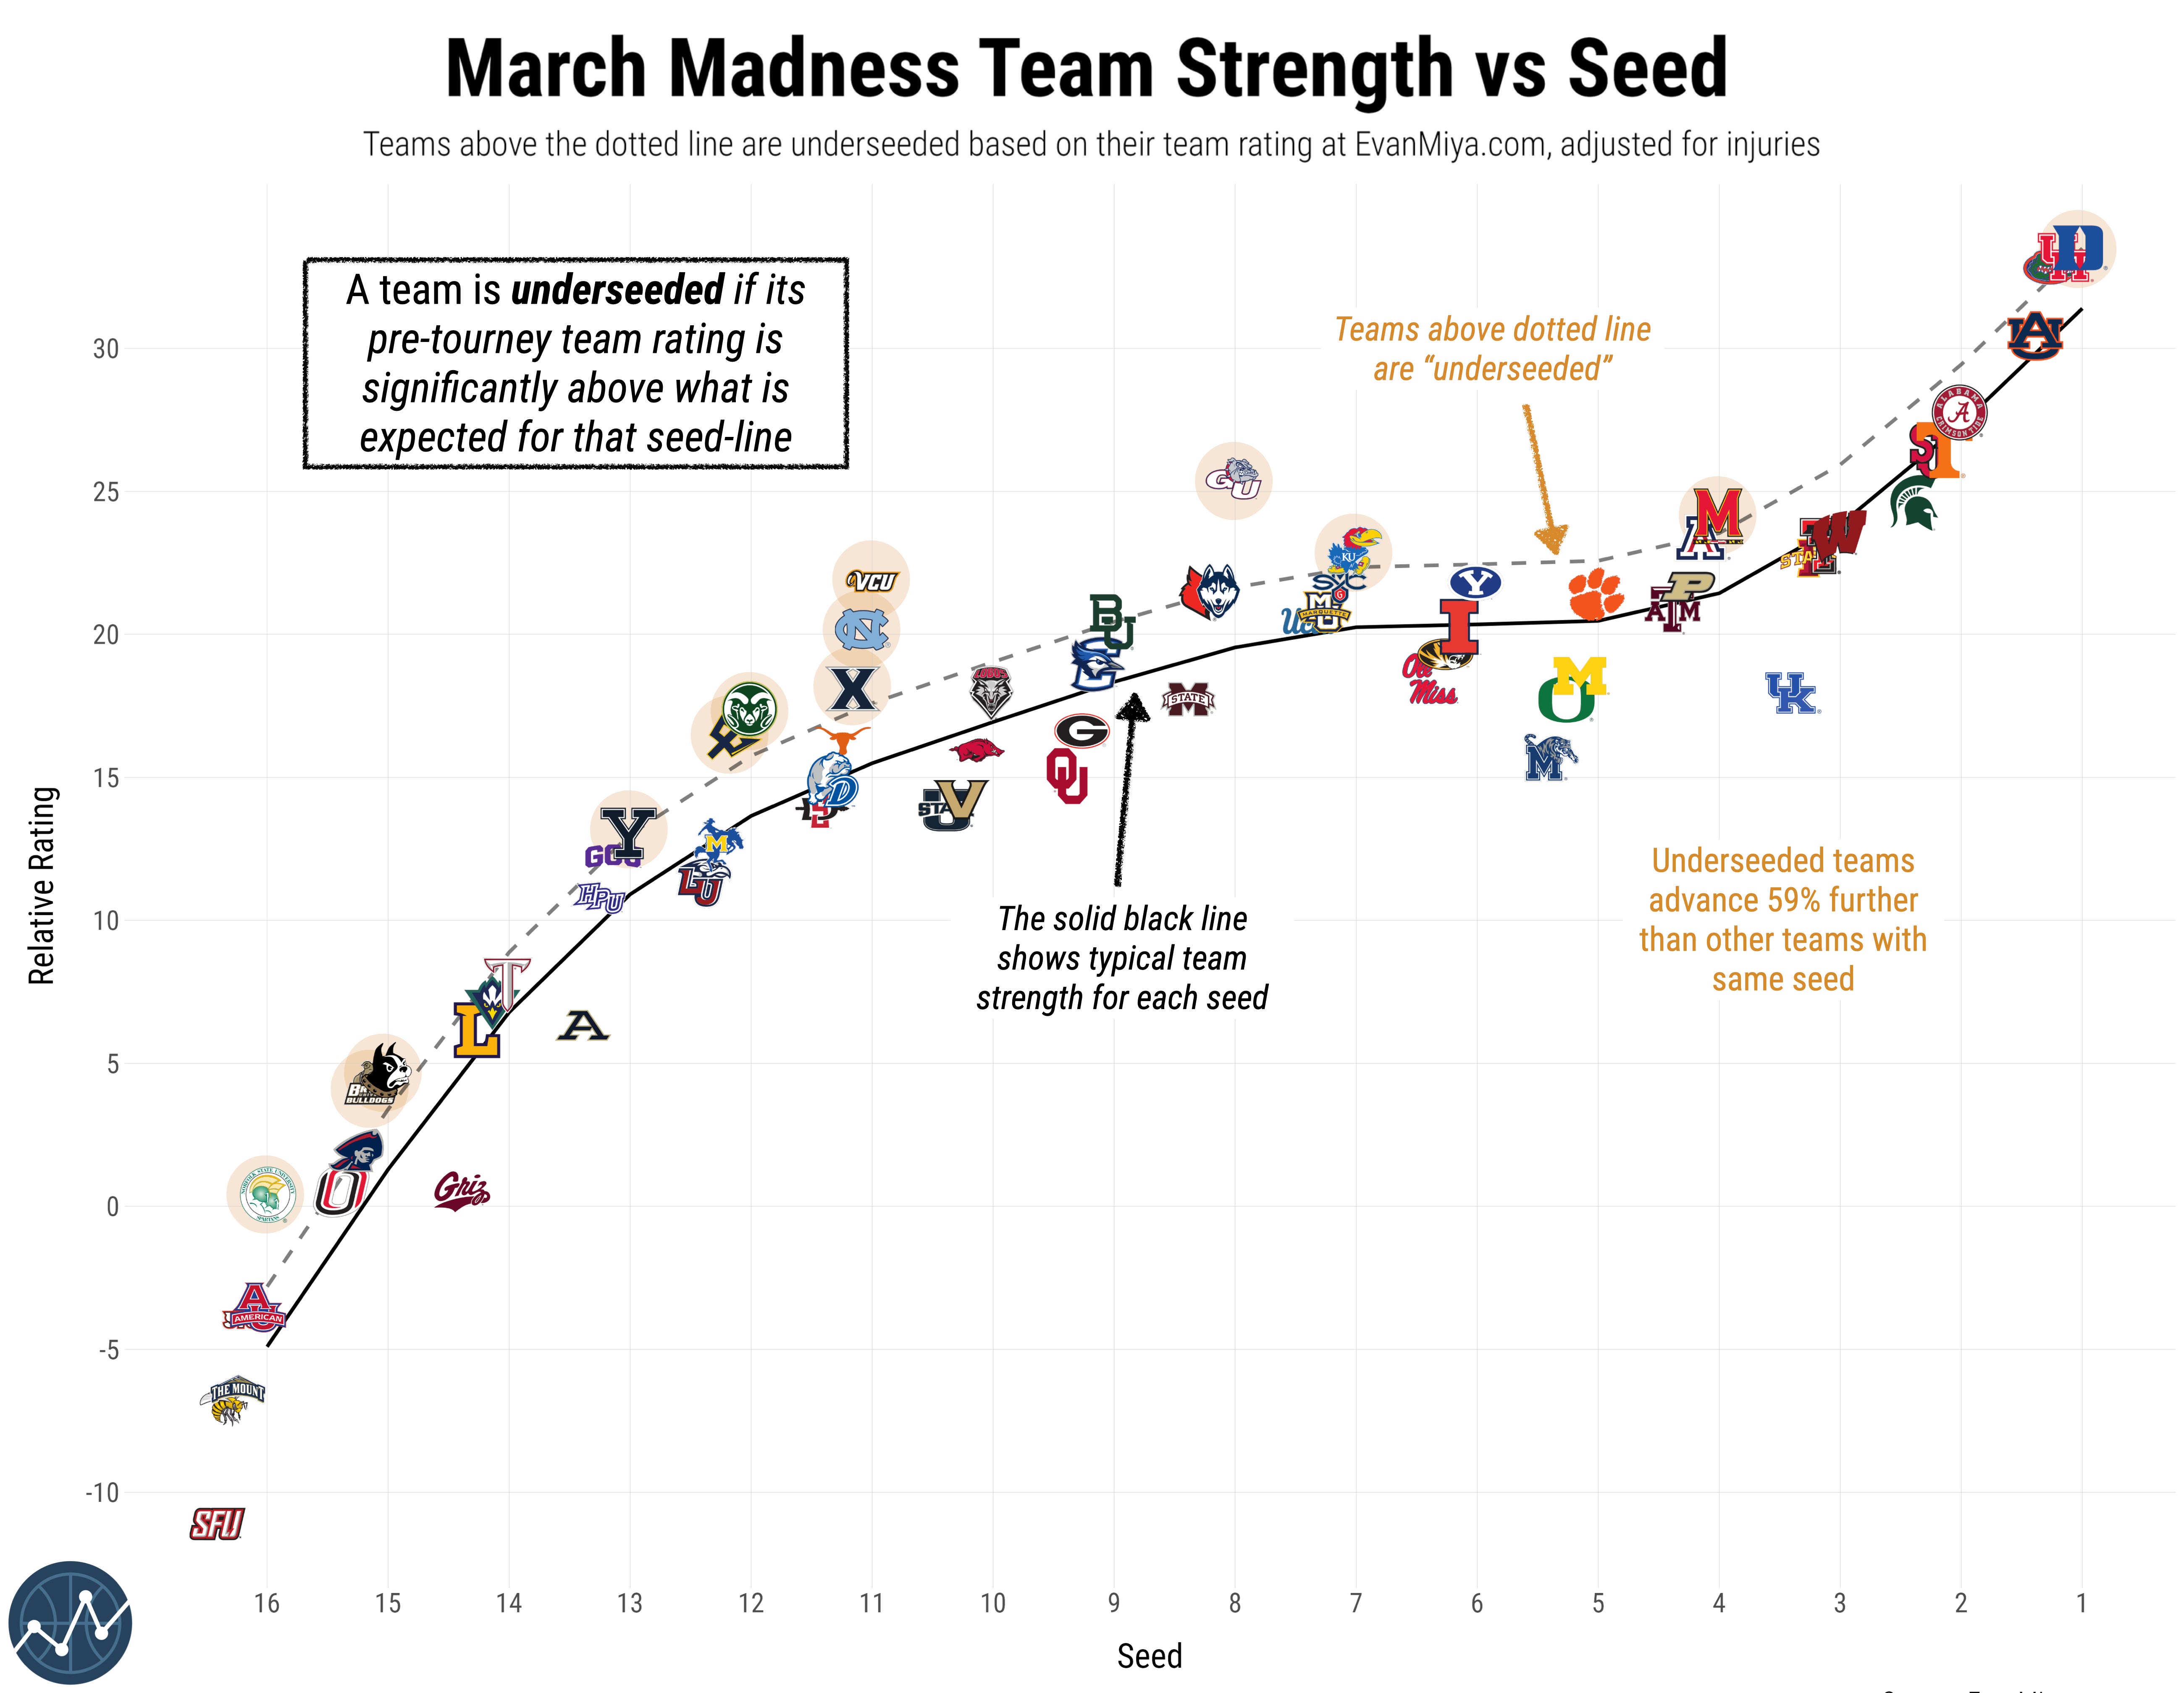
This year, 12 teams qualify as underseeded due to being much better than usual for their seed. Duke also qualifies, but they can’t get a better seed than they already have. Of these teams, the ones that really stick out are 8-seed Gonzaga, 11-seed VCU, and 11-seed North Carolina, who all have a predicted team strength much better than their seed.

This year, the group of 11, 12, and 13 seeds is particularly strong. VCU has a 50.2% chance of beating 6-seed BYU in their first-round matchup, Colorado State has a 53% chance of beating 5-seed Memphis, UC San Diego has a 45% chance of advancing past 5-seed Michigan, UNC has a 54% chance of beating 6-seed Ole Miss (if they can get past San Diego State first), and even 13-seed Yale has a 30% chance of advancing past 4-seed Texas A&M.
I’m very torn on the potential 8-seed Gonzaga vs. 1-seed Houston matchup. Gonzaga is a top-10 team, according to EvanMiya.com, but Houston is the 2nd best team in the field. The Matchup Preview tool, which lets you preview any possible matchup between teams, shows Gonzaga would only have a 33% chance of beating Houston in that game.
Maryland has the best chances of advancing to the Final Four (11.6%) of any team not in the top three seed-lines. If they advanced past Grand Canyon, they would face the winner of Memphis/Colorado State, which would make them comfortable favorites either way.
On the opposite side of the coin, some overseeded teams are likelier to come up short in the tournament, compared to usual expectations for their seed: 3-seed Kentucky (dealing with injuries), 5-seeds Michigan, Oregon, and Memphis, and 6-seed Ole Miss.
The Kill Shot
This wouldn’t be an EvanMiya.com article without analyzing the “Kill Shot”, any time a team scores 10 or more unanswered points in a game. Teams that go on many of these 10-0 scoring runs are more able to erase a deficit quickly and can also easily close the door on an opponent in a tight contest. Similarly, teams that limit opponents from having “Kill Shots” are more likely to hold on to a lead instead of allowing another team back into the game.
Before we jump into analyzing individual tournament teams, here are the stats about scoring runs that you need to know:
A team with at least one 10-0 run wins 71% of the time
A team with more Kill Shots than the opponent wins 81% of the time
A team with 2 Kill Shots in a game wins 88% of the time
A 15-0 run leads to a win 86% of the time
A 20-0 run leads to a win 91% of the time
The graph below shows the landscape of tourney teams in 2025 in terms of scoring runs per game and scoring runs conceded per game, adjusted for opponent quality:
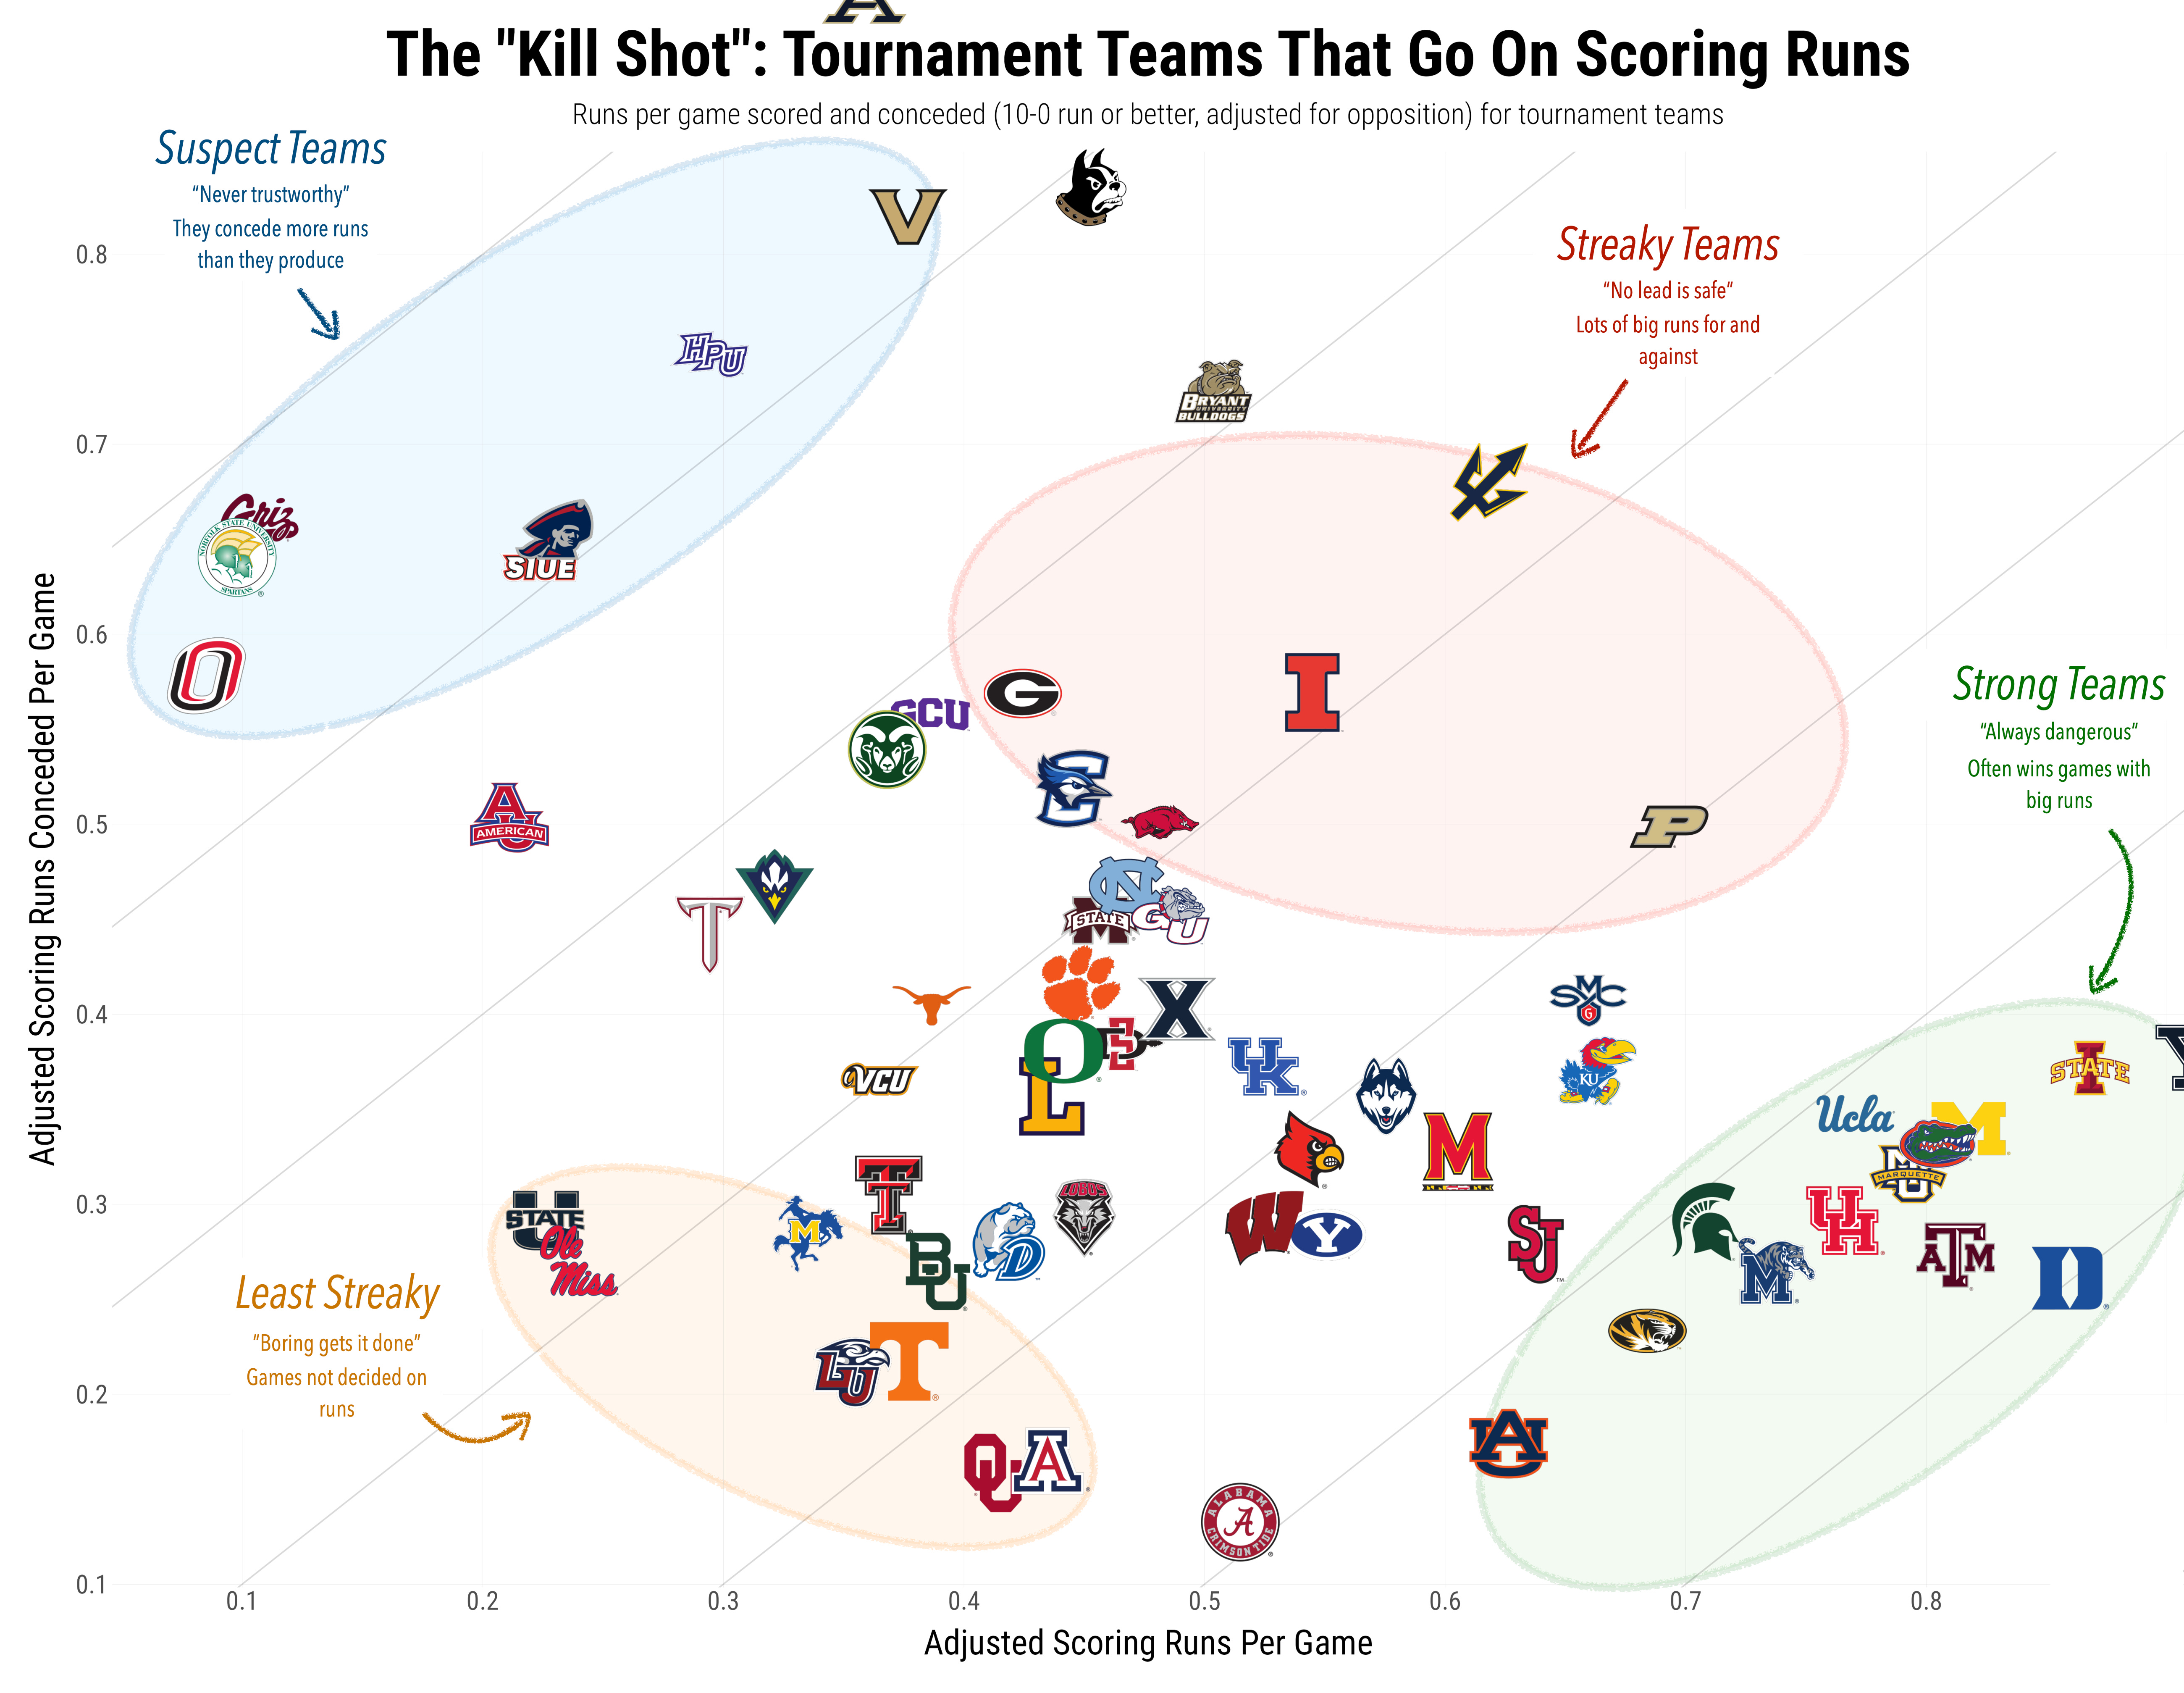
As shown on the graph, I like to put teams in four categories: “Strong” teams, “Streaky” teams, “Least Streaky” teams, and “Suspect” teams.

All the major title favorites fall in the “Strong Teams” category, but Texas A&M, Iowa State, Michigan, Marquette, Memphis, Missouri, UCLA, and Michigan State are here too.
Duke is the best team overall at going on 10-0 runs and not giving them up in return. Some of their biggest games this year have featured a big scoring run at the right moment.
The big standout is Yale, which is rated as the best team in the country at going on 10-0 runs, even after adjusting for opponent strength. This could spell trouble for Texas A&M in their first-round matchup, although A&M has only given up 9 Kill Shots all year.
Alabama didn’t quite make the cut for the top tier, but their Adjusted Kill Shots Conceded per game is lower than any other team in the country. It’s hard to string a bunch of scoring possessions together against them without the Crimson Tide scoring in return.

This is where we can really have some fun with this metric. The six tournament teams in the “streaky” category are all very capable of going on scoring runs… but they also give them up just as quickly. Games with these teams are often wild, with quick lead changes back and forth. No game with a “streaky” team is over, win or lose, until the very end.
There are two main takeaways for teams in the “streaky” category. First, they are vulnerable as a favored team but have more upset potential in games where they are the underdog. Because scoring spurts can happen at any time in either direction, their games are very unpredictable. A team like Illinois could either flame out in the first round or get hot and go deep in the tournament. And you really don’t know which one will happen.
The other takeaway is that live spreads for games with these teams could be less accurate because any lead could be vaporized quickly. If a team like Iona is down 10 at halftime, they will be more likely to mount a comeback than most other teams of similar quality.
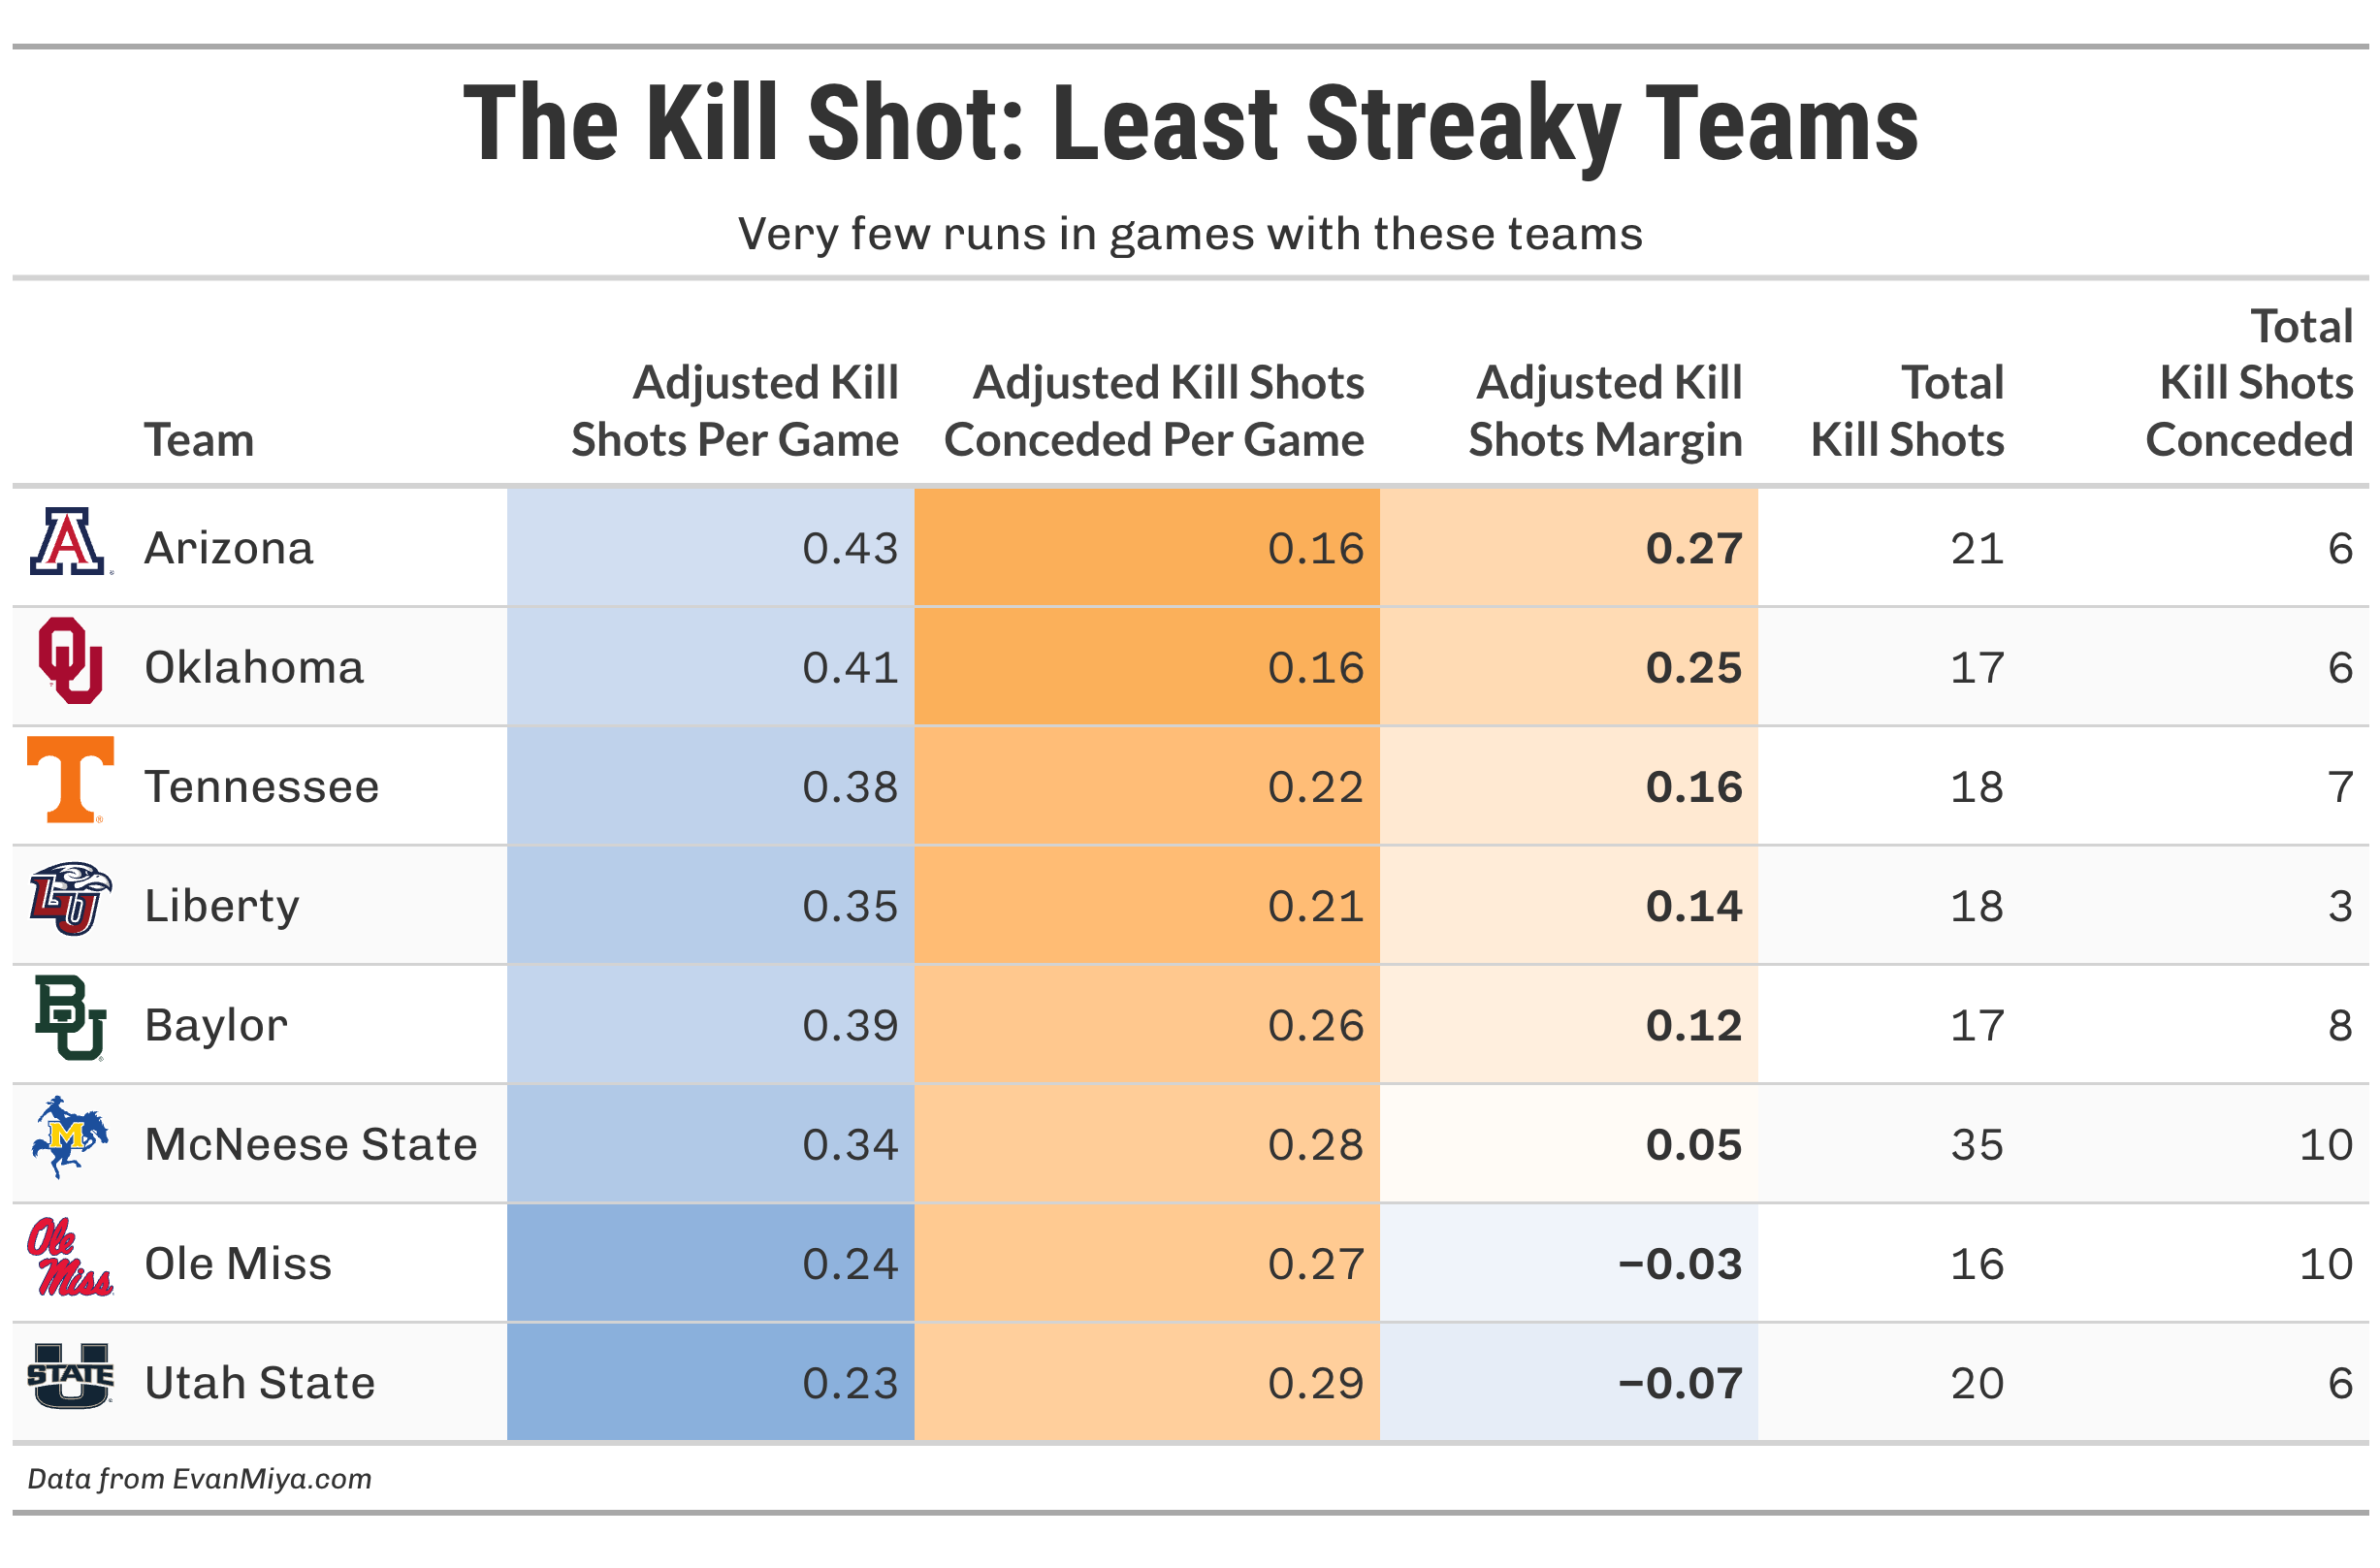
In contrast to the last category, we now look at teams in the “least streaky” group, which are more boring by nature. These teams have not had as many 10-0 runs this season, but they rarely give them up. Liberty has only given up 3 Kill Shots all season!
Teams in the “least streaky” category are pretty trustworthy when they have a lead since they are not very likely to allow the opposition back into the game quickly. However, teams like Ole Miss and Utah State often struggle to overcome a deficit quickly. Look to rely more on these teams when they are favored, but be cautious to count on them winning several games as an underdog.
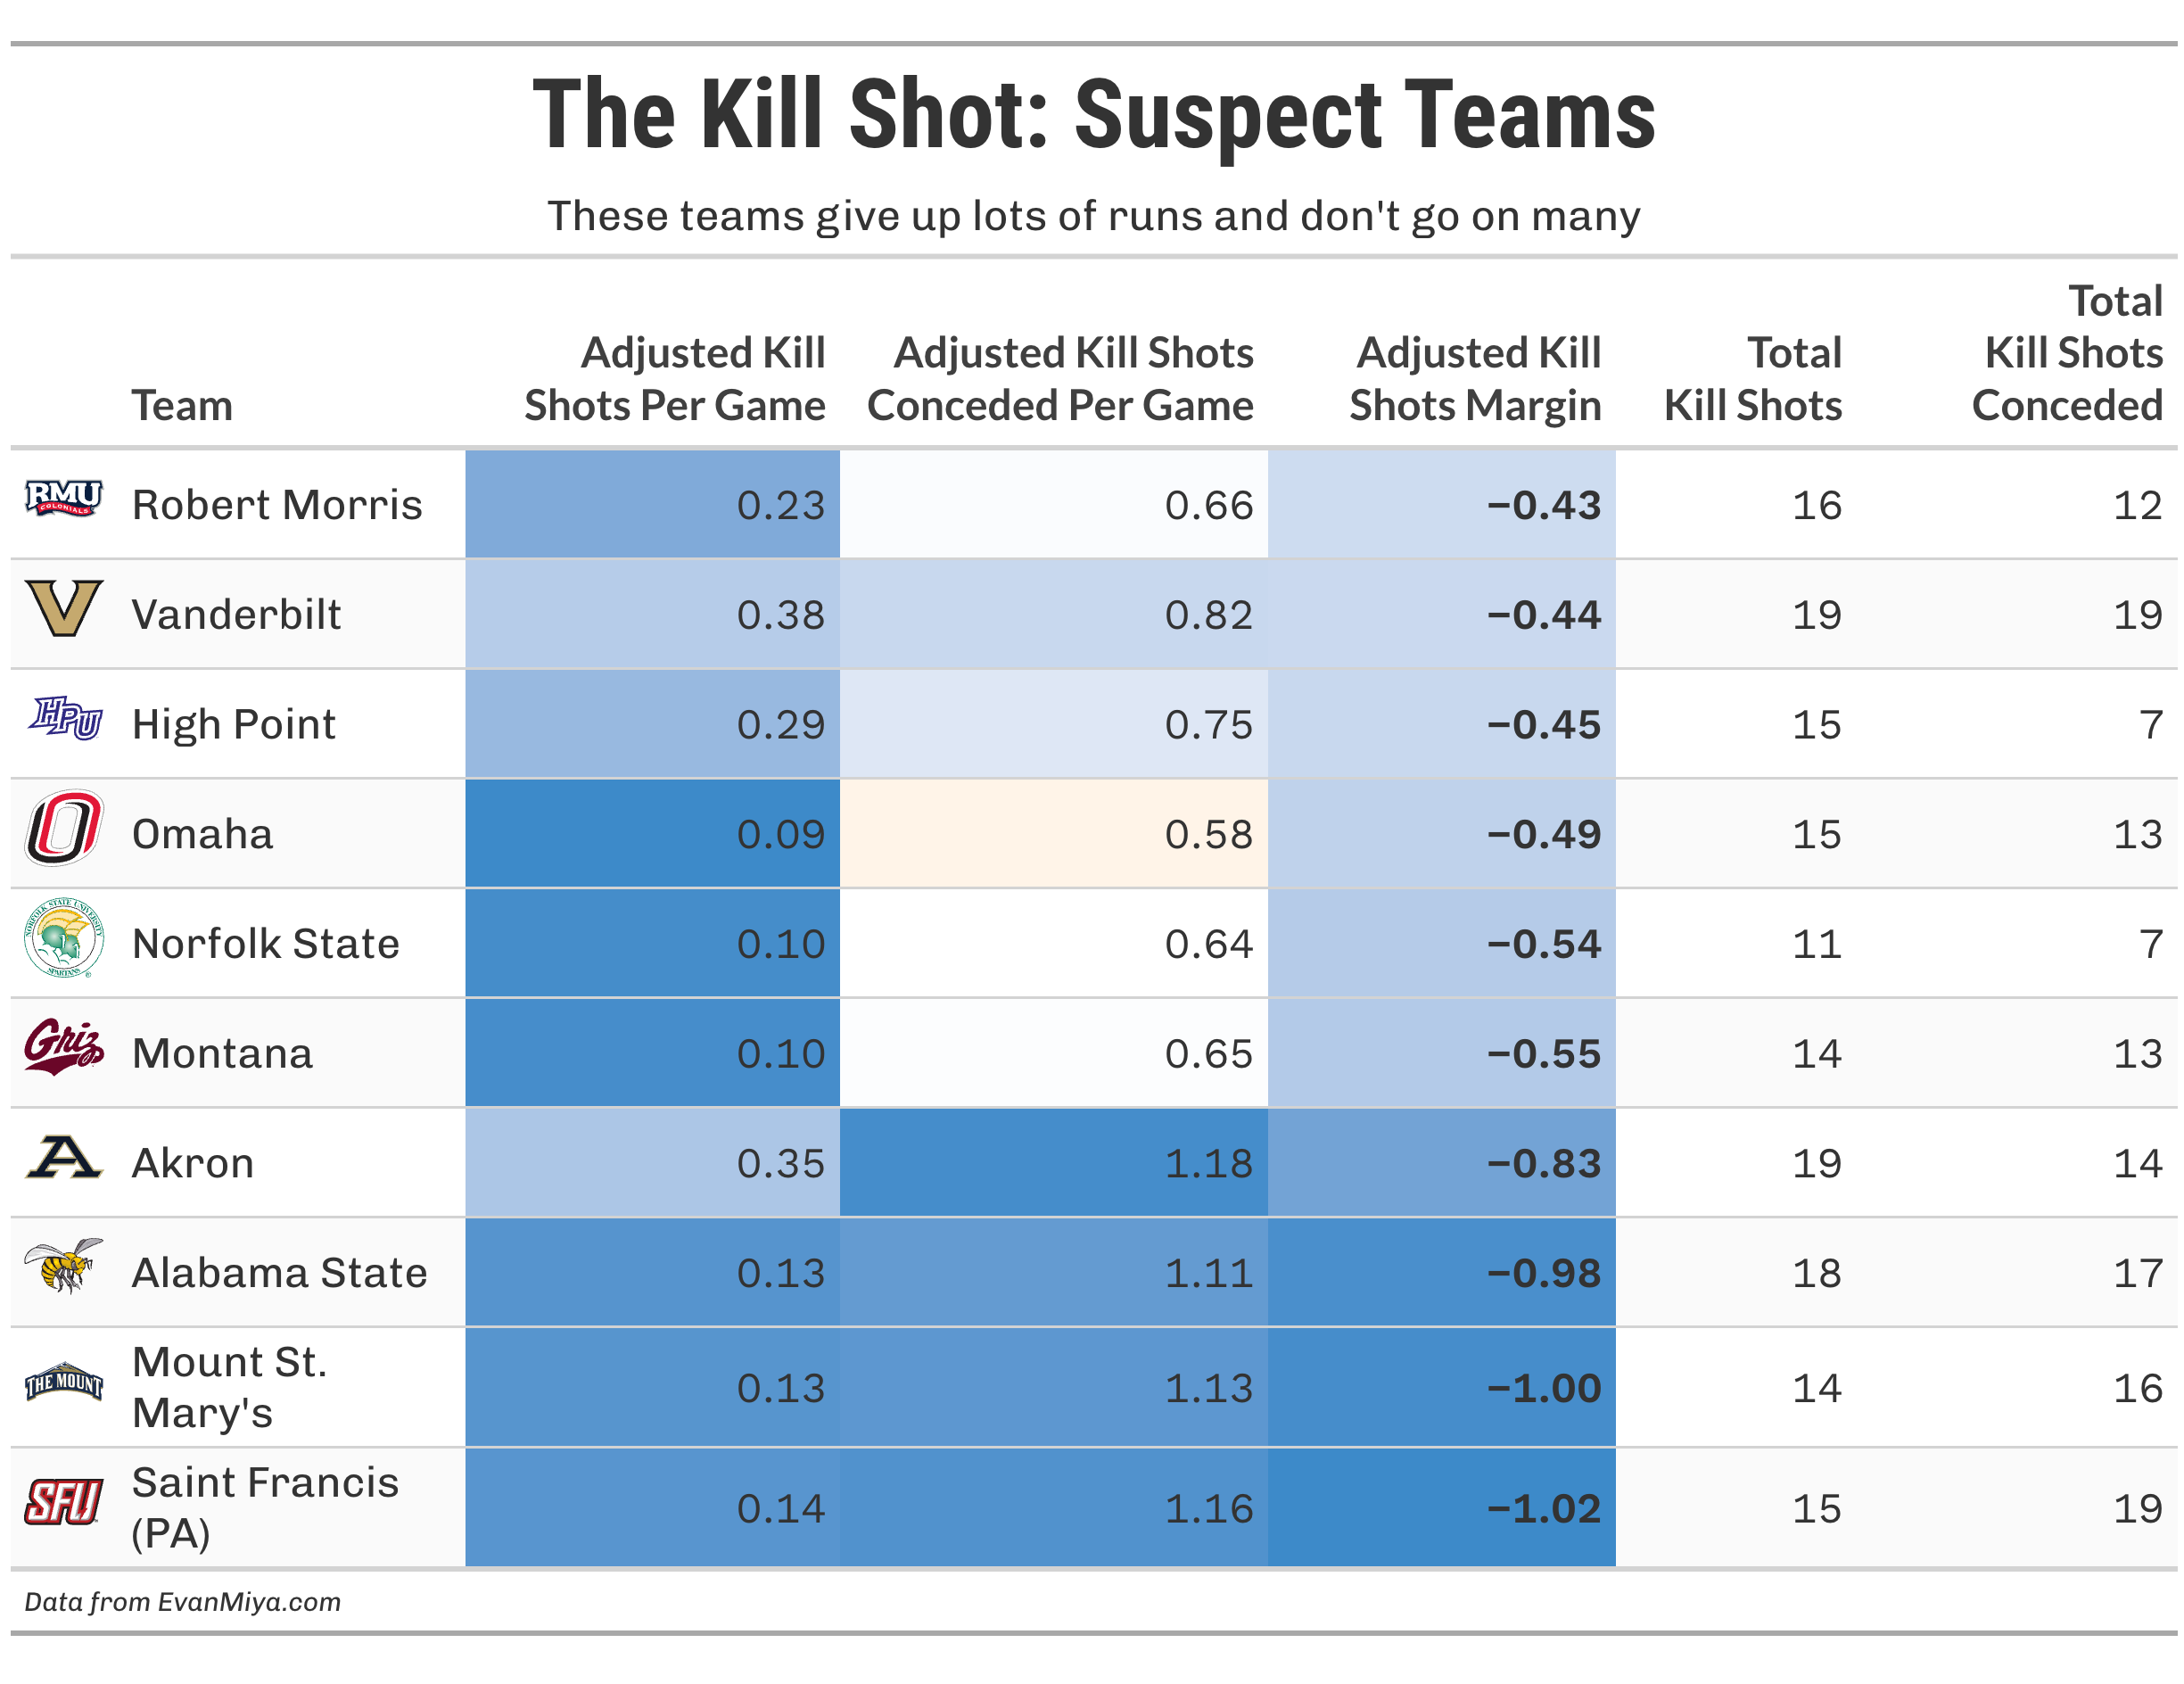
Lastly, we touch on the “suspect” group, which comprises teams prone to giving up scoring runs to the opposition while struggling to counter on their own. There are a lot of bad teams on this list, but it also notably includes Vanderbilt, who has given up a ton of 10-0 runs against high-major opponents.
Now, what does all of this mean for your team’s chances of reaching a Final Four?
Let me first state that while the Kill Shot is a helpful tool, it can’t be used in a vacuum to determine the best teams in the country. Instead, I view it as a useful companion to other metrics to provide more nuance about the characteristics of each team.
With that said, since the 2018-19 season (which is as far back as my Kill Shot database goes), heading into the tournament, every national champion has had an Adjusted Kill Shots Per Game of at least 0.47, an Adjusted Kill Shots Conceded Per Game under 0.34, and an Adjusted Kill Shots Margin of at least 0.28.
There are 11 teams that qualify using this year’s statistics: Duke, Houston, Florida, Auburn, Alabama, St. John’s, Michigan State, Missouri, Texas A&M, Marquette, and Memphis.
In general, I have found that preventing 10-0 runs is the more predictive stat of teams that advance the furthest in the tournament. While it’s great to be able to put up scoring runs in a hurry, the best teams are the ones who can hold a lead and not quickly allow an opponent back in the game.
Matchup Previews
To dig more into the individual matchups, the Matchup Preview Tool at EvanMiya.com lets you analyze any hypothetical matchup in the tournament. It gives you score predictions, injury adjustments, other matchup-specific adjustments, a team comparison, a roster breakdown, and a daily updated injury report.
This preview shows the potential top-10 matchup in the 2nd round between Houston and Gonzaga:

Tournament Probabilities By Region
The tables below show each team’s chances of advancing to each round of the tournament, which you can also find at EvanMiya.com, updated daily as the tourney progresses.


Is there a way to get the full adjusted kill shot list?
In the Kill Shot "Suspect Teams" what is the *adjusted* part of the formula doing? For example, High Point has only conceded 7 kill shots on the season but they have a metric of adjusted 0.75 kill shots conceded per game. How do they average that much per game if they've only given up 7 all year?