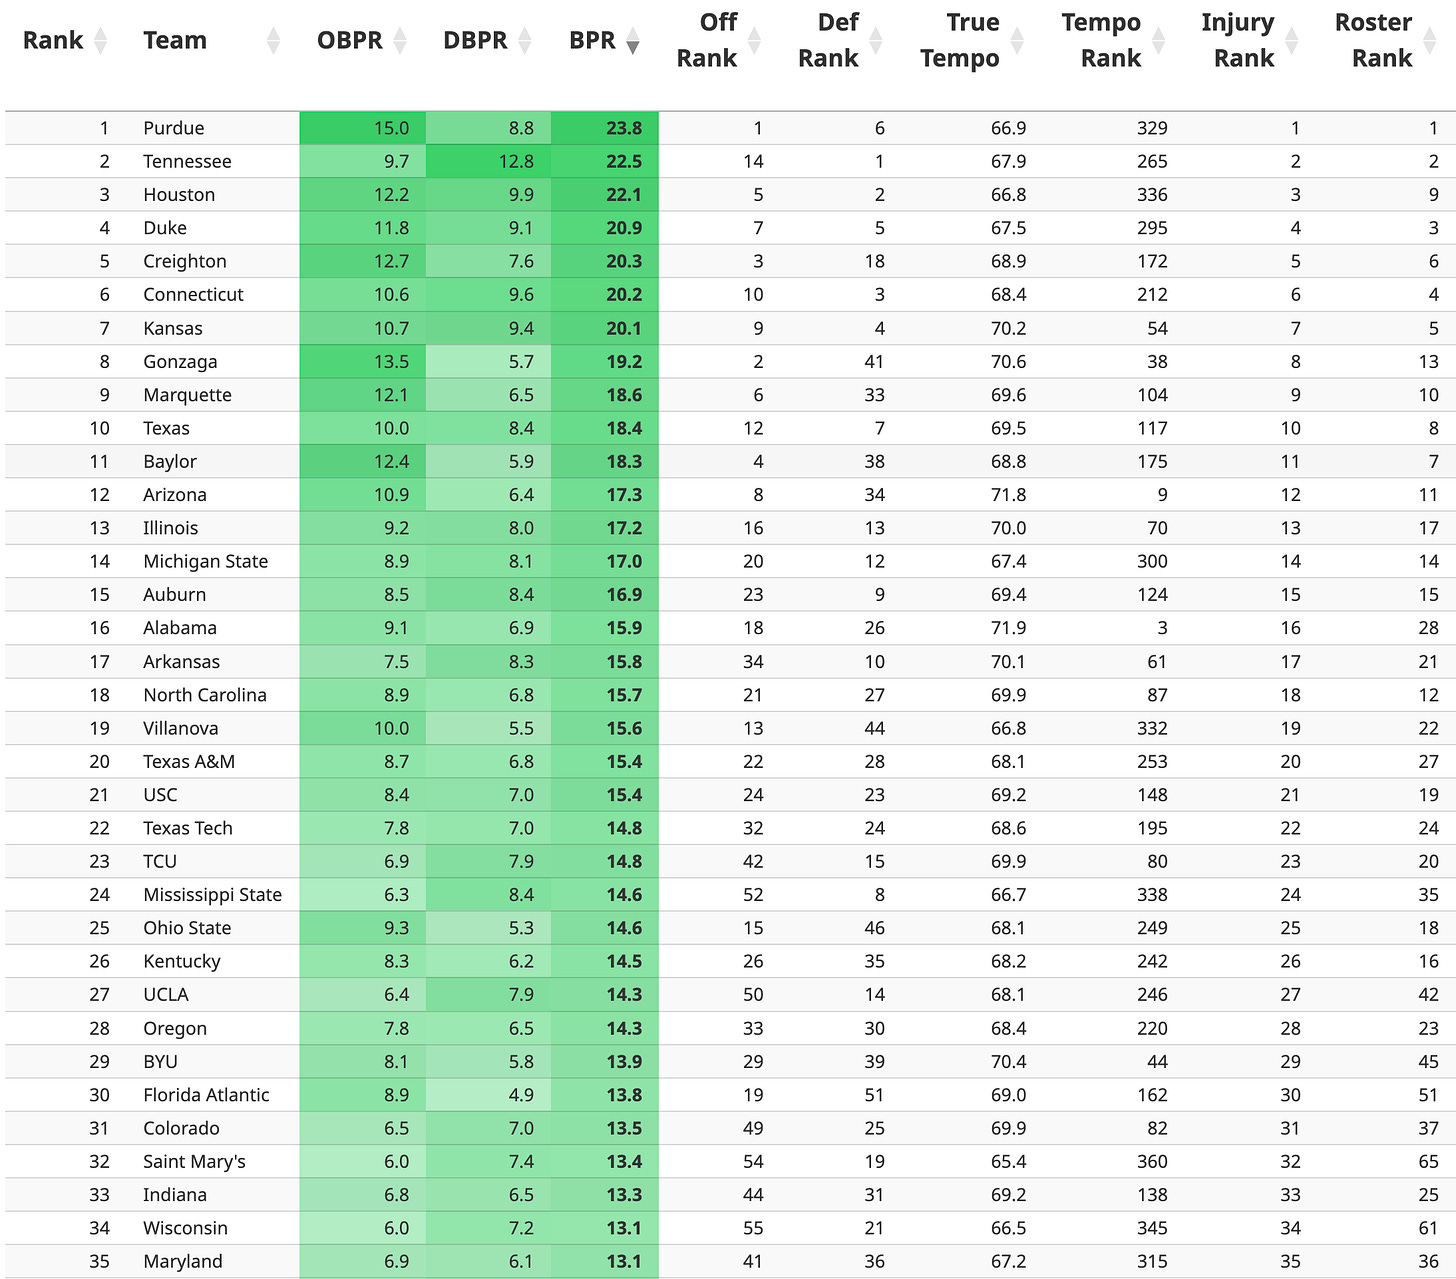
Team Preseason Projection Notes and Takeaways
It's that time of year again
It’s that time of year again! Preseason projections are live at EvanMiya.com and the season is less than a month away.
Today I want to focus on the team ratings, giving an overview of the projections methodology and pointing out a few interesting trends. In a future post, I’ll focus more on the player projections, which are closely tied to the resulting team rankings.
Methodology
Obtaining the projected preseason rating for each team is a very complicated process, but here are the main factors:
Projected roster strength - This is by far the most important one. Each player on the roster has a projected Bayesian Performance Rating for the season, which is an estimate of how impactful a player will be on a per-possession basis during the season. There is also an associated minutes prediction model that gives a rough estimate of what a team’s rotation will look like. Combining all rostered players’ projected BPR with predicted minutes gets an estimate of the team’s overall roster strength based on personnel. You can see the “Roster Rank” column for each team on the Team Ratings page. The top 10 teams in roster strength are also shown below:
Team performance in previous seasons - Though this is much less of a factor in a team’s preseason projection, it still does play an important role. Specifically, teams that often outperform their projected roster strength in past seasons are more likely to do so in future seasons. This is sometimes an indirect way of capturing coaching skill, which is not an explicit feature in the projections model. For each team, there are two previous season performance measures used: one that weights the end of previous seasons more highly, and one that treats all previous games in a season as having equal importance, regardless of if they took place in November or March. In general, I have found that including a little bit of “recency bias” from the previous season helps make the following season team projections better ever so slightly. This isn’t overblown however, as human preseason polls often have way more recency bias baked in than my model does.
Roster continuity - Teams that have a higher percentage of returning minutes from the previous season are often slightly better than teams with a lot of roster turnover. This doesn’t play a huge role, but it does move the team projection slightly.
Coaching changes - I haven’t spent much time yet developing a robust coaching impact model, so I mostly rely on team performance in previous seasons to represent coaching ability. However, some adjustments are made for teams with coaching changes that are widely recognized to be big upgrades or downgrades for teams. For most coaching changes, I don’t make any adjustments, as I rarely want to manually modify any team or player metric as it injects my own potential bias into the model.
Interesting Takeaways
The data-driven model does not put as much stock in recent March Madness performance trends as human polls do. Purdue is our preseason #1 team, while Florida Atlantic (29), San Diego State (39), and Miami (48) are ranked much lower than in other notable human preseason polls. The Almanac has Purdue 3rd, FAU 10th, Miami 14th, and SDSU 16th.
Tennessee has a surprising debut at #2, mainly because of their projected defensive ranking, which is by far the best in the country.
There are no mid-major darlings in the preseason top 50 this year. Besides Gonzaga and Saint Mary’s out of the WCC (they don’t count), the most notable teams are New Mexico (56th), Dayton (60th), and Yale (63rd).


