

NIL Market Trends You Need To Know
The NIL market is up 65% from last season

The transfer portal has been open for barely a week, and the NIL market in college basketball is already exploding. Teams are putting more money on the table than ever before to build rosters that can compete for national titles… or even just make the NCAA tournament.
In late March, I posted on Twitter that the NIL market was up about 35% from last season based on proprietary data I have at EvanMiya.com. That number is already very outdated. Based on input from teams, the NIL market for Division 1 players is up about 65% from last year. That means that a player good enough to be valued at $1 million last offseason would be getting around $1.65 million this offseason.
In today’s article, we are going to examine several key trends in the NIL market:
NIL market changes from last offseason
Market demands for high-major vs mid-major players
Player types that are being overvalued in the current market
Where The Data Comes From
Before I summarize the most interesting trends in the college basketball NIL market, it’s important to explain why I can do this analysis to begin with. Since there is no publicly verified database for player contracts, team budgets, or NIL rates, very few people can reliably convey knowledge of the market without making some big assumptions.
About a year ago, I launched a tool called the “Front Office Suite”, which is specifically designed for coaches, GMs, and ADs to obtain NIL evaluations for players, based on their analytical profiles, while being responsive to the current market trends. Because the NIL market is constantly changing, it’s crucial for any tool that attaches dollar figures to players to be flexible enough to adapt to market trends.
I’ve conducted extensive research on how numeric player value correlates with monetary value, drawing on salary cap science and the impact of individual players on team success. While I can reasonably tell somebody that Player A should be worth 25% more NIL dollars than Player B, it would be a stretch for me to assign fixed NIL figures to each player without allowing for adjustments to the fluid market.
Here is a brief summary of how Front Office Suite NIL evaluations are calculated, leaving out a few proprietary details:
Each team enters NIL values for individual players that reflect the current market rates they are seeing in recruiting. Each NIL number entered for a player doesn’t have to be exact amount they will likely make, but when you pool 10-15 of these data points together, it does a pretty good job of summarizing where the overall NIL market is at today. Data entered stays private to each team’s profile and is not shared across users. While there is no way to verify the accuracy of the data entered, there is no incentive for a user to lie or fudge the numbers, since more accurate intel leads to more realistic NIL approximations in the Front Office Suite. Once these data points are entered, a user can then see the true “NIL value” for every D1 player based on each player’s projected value next season, their analytic profile, and where they should be priced according to market trends. Though each team sees slightly different NIL evaluations based on the intel they provide to the tool, most teams end up with very comparable dollar figures after putting in 10+ data points. Users can add or modify any of these settings as they see fit throughout the year, allowing them to stay up to date on current market trends and see more accurate NIL estimations for all players.
The NIL Market Is Way Up
There are about 30 teams that use the Front Office Suite, spanning 12 conferences in the high-major and mid-major ranks. By summarizing the NIL player data entered across all teams and comparing it to last year’s market data, we can gain a pretty good understanding of how the NIL market has changed over the past year.
As mentioned at the top, the NIL market for Division 1 players is up about 65% from last year. That means that a player good enough to be valued at $1 million last offseason would be getting around $1.65 million this offseason. It’s pretty hard to fathom how market rates have increased this much, especially since we saw a similar increase from 2024 to 2025, if not even higher.
The market is up even higher for players coming from high-major programs: There has been a 73% increase in the going rate for players on power conference teams. The market increase for players from low- and mid-major conferences is slightly lower, up 44% from last offseason.
Bigs Are Being Overpaid
It shouldn’t come as a surprise that bigs are a prized commodity this offseason after teams like Michigan, Arizona, Florida, and Duke all dominated with loaded frontcourts. Michigan and Florida, in particular, thrived by having players like Yaxel Lendeborg and Thomas Haugh, traditionally considered stretch-4s, play down at small forward. Since we live in a copycat league, other teams are trying to replicate this by stocking up on extra big men.
Predictably, this has led to some pretty outrageous asking prices for bigs all across Division 1. In a recent coaches poll, Jeff Goodman approximated that elite portal bigs were going for at least a million more than guards or wings. In many cases, this overspending on bigs is not justified.
By looking at players across positions who are expected to have similar value next year according to our player projections, we can compare their actual going rates to determine market demand.
The table below shows how much it would cost a team to acquire a player worth $1 million at each position. Centers are being the most overpaid, costing about 30% more than they should on average, while point guards are more of a bargain.
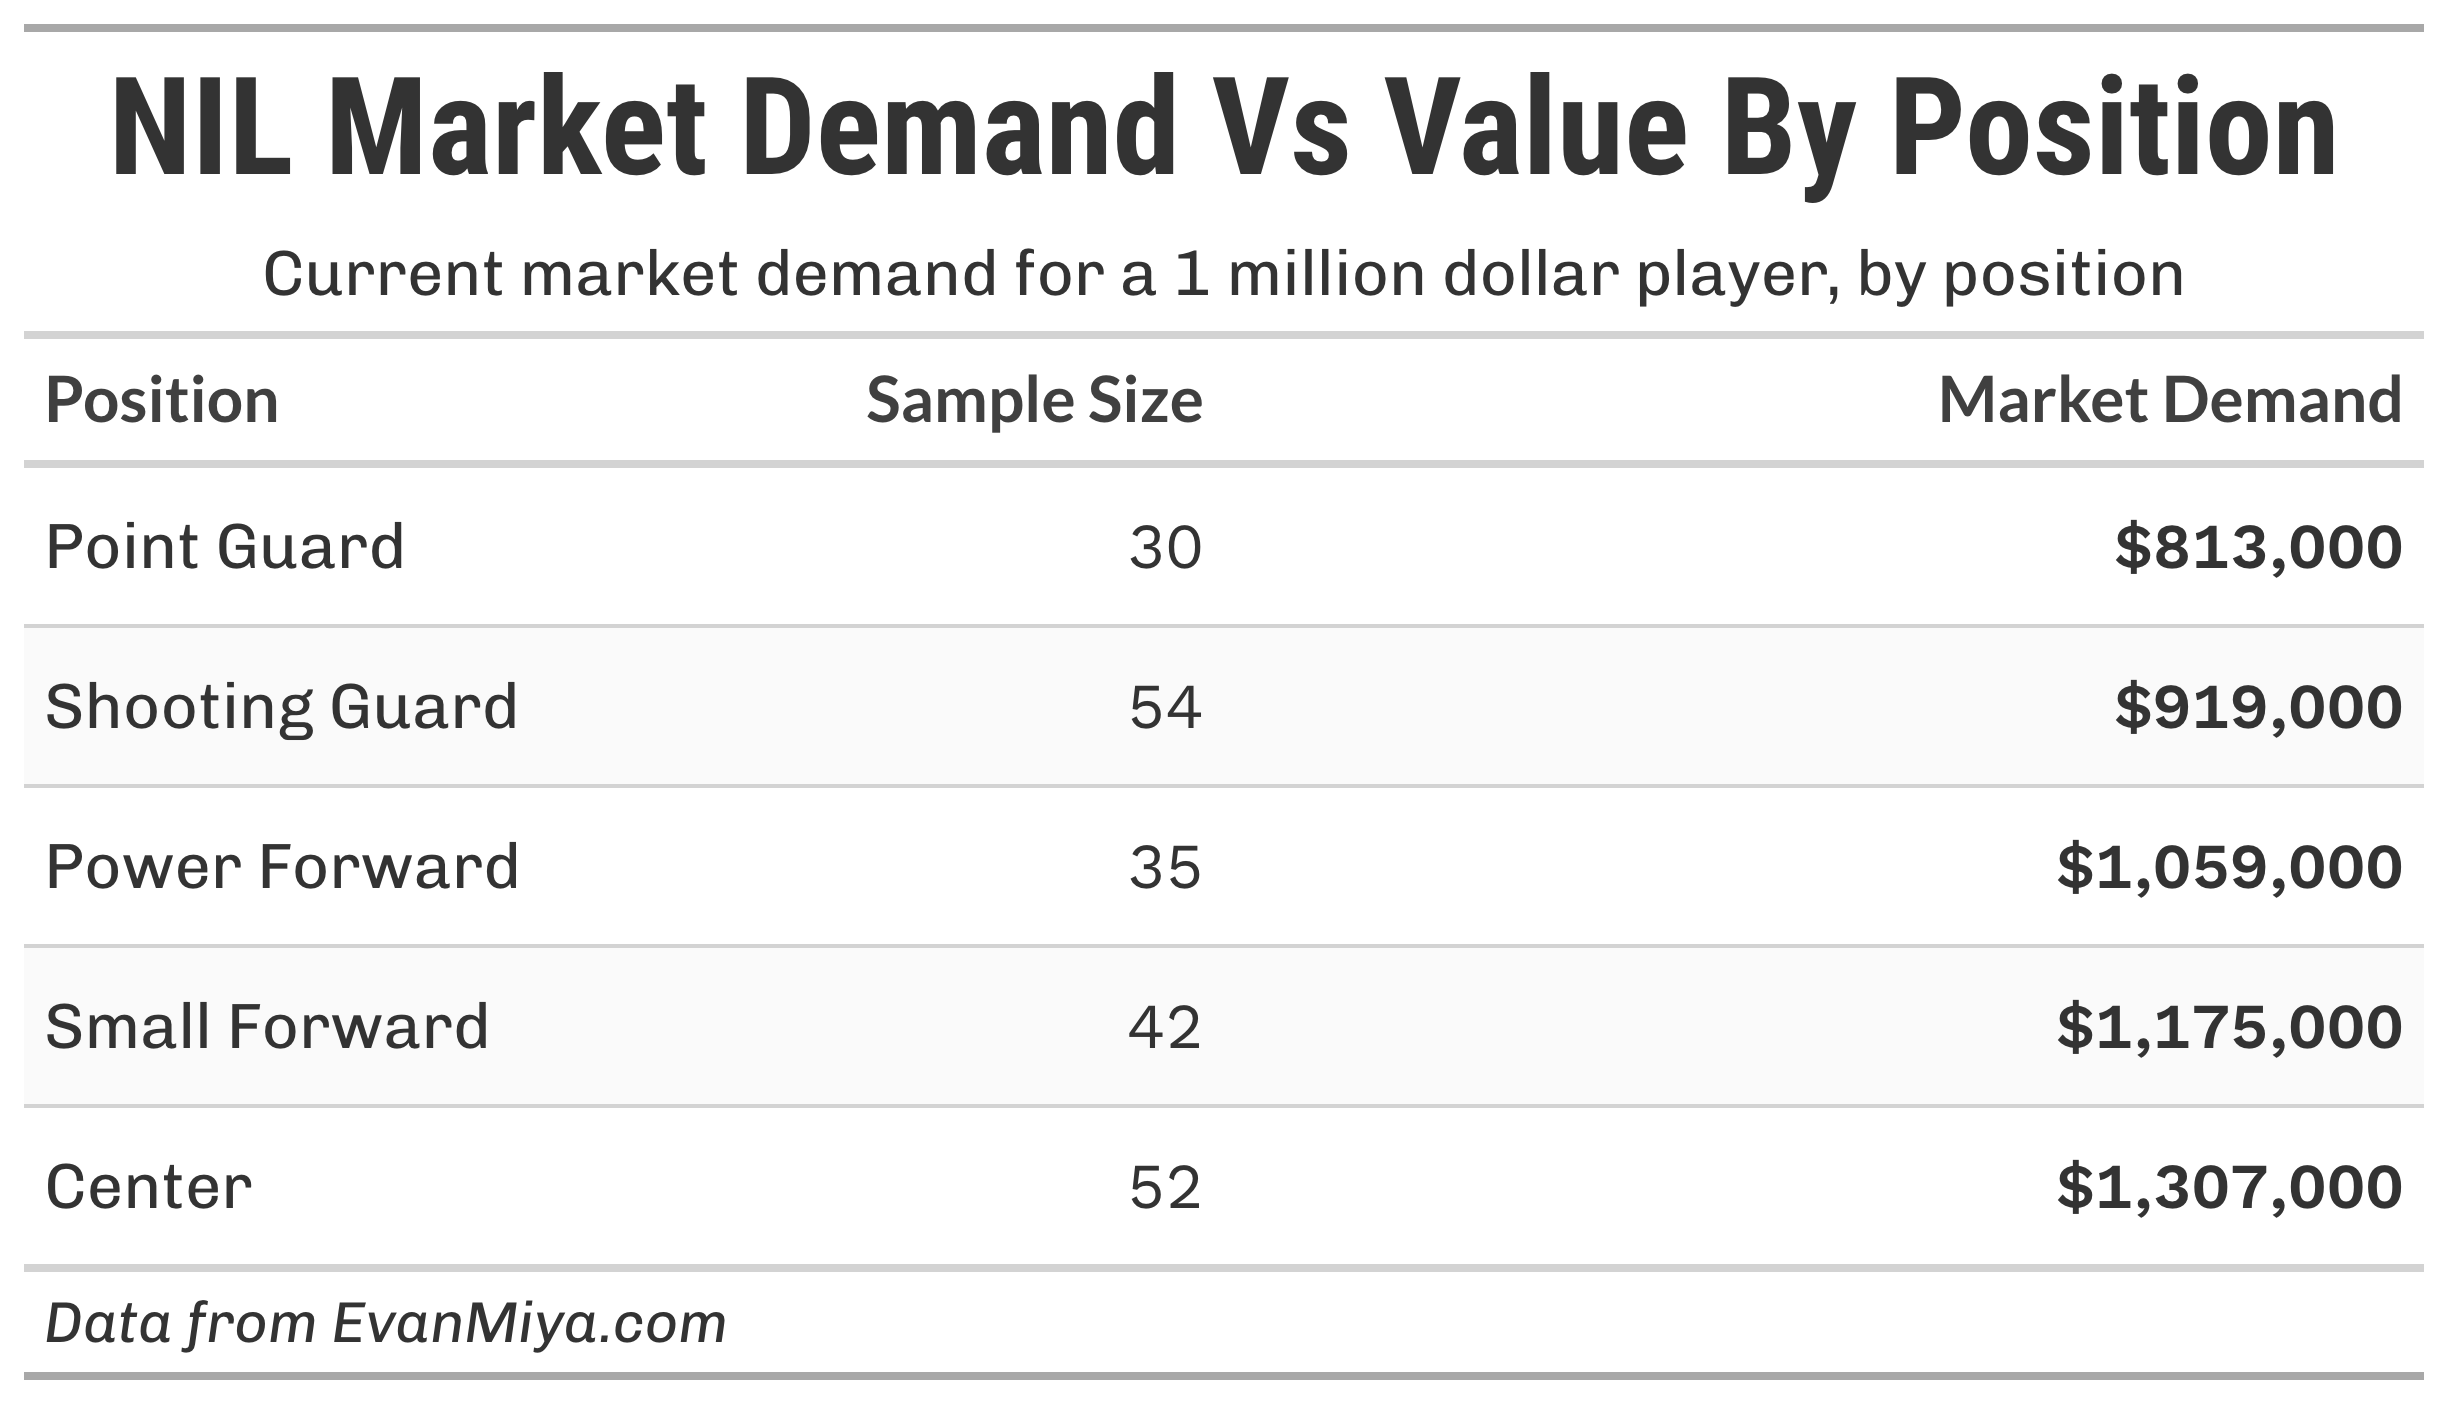
Here’s how to interpret the table exactly: to obtain a center or a point guard who are equivalent in talent level, it would cost $1.3 million for the center, while only $813,000 for the point guard. That means, in this market, it costs 61% more NIL dollars to get a center of the same caliber as a point guard.
How would this market discrepancy translate to player value on the court? Without getting too into the weeds, let’s pretend that a team had $1,000,000 to spend on an extra player. For the sake of this example, let’s assume they already have rotation pieces figured out and are willing to either get a starter-level PG or C to add to the mix. Based on the high demand for centers, they could reasonably get a big with a projected Bayesian Performance Rating next season of 3.9. A player of that caliber would be a borderline top 450 player in college basketball next season. If they were to spend that same $1 million on a point guard instead, they could get a better player, with a projected BPR of about 5.1, due to lower demand in the guard market. A player of that caliber would be around a top 250 player next season.
For a team hoping to make the NCAA tournament, that difference in player caliber would be worth about a 5-spot jump in their preseason roster talent ranking! Obviously, this example is a bit contrived, but it illustrates how this high demand for bigs can significantly affect the quality of players a team can get within its budget.
I should note that the table above does not indicate that point guards are the cheapest position to acquire. An elite-level point guard in college basketball is more valuable than an elite-level wing in today’s game, which is why the cost for a quality point guard is higher. The point is that teams are still getting point guards at the biggest bargain compared to all the other positions, based on the production they will actually get out of those players.
Rosters That Can Beat The Market
With more teams trying to load up on long, athletic frontcourts, my current working theory is that teams who stock up on value at other positions could end up with more talented rosters.
Vanderbilt’s roster from this season is a great example. Jalen Washington was their only true-sized big who played regular minutes at 6’10”, and he was just their 6th most valuable player according to BPR. Their other frontcourt spots were filled by wings and undersized bigs: Tyler Nickel, Devin McGlockton, and AK Okereke were all 6’7”. At the guard spots, Vanderbilt’s best players and leading scorers were Tyler Tanner (6’0”) and Duke Miles (6’2”). Mark Byington’s squad had a ton of skill across all five positions despite the lack of size, which allowed them to be so successful.
Nebraska, which beat Vanderbilt in the Round of 32, was also built very similarly. Rienk Mast and Berke Buyuktuncel, both 6’10”, combined for 53 minutes a game. Outside of those two, the rest of the roster was 6’7” or shorter, but filled with highly-skilled players who had great chemistry together.
While I’m not claiming that the 2027 national champion will have a roster that looks like Vanderbilt’s or Nebraska’s from this year, I do think that many teams who overspend on bigs trying to chase the Michigan blueprint will end up being disappointed with the production they get from their rosters. Teams that buck the trend by seeking value elsewhere may be more successful.
Further Analysis
I will be expanding on this analysis and analyzing some of the most interesting portal moves in my next episode of The EvanMiya College Basketball Show later this week. Be sure to subscribe to the podcast platforms or on YouTube!

Very interesting data, Evan. Thanks for sharing! I generally agree with you that if the market is much higher for bigs that teams should probably focus on value at other positions and/or play smaller lineups.
But to play devil's advocate:
- Let's assume that at the power conference level it's less doable to play smallball lineups all the time (not sure I agree with this but many coaches currently seem to be operating as if this is true).
- Then you have to sign some bigs, whether high-end/middle/low-end of market.
- If the supply of power conference-worthy bigs is constrained based on size requirements then that will push up the market price, even at the middle/low-end.
- So by that logic a scholarship-only (or realistic minimum salary) big will 1) have worse per possession impact than the equivalently cheap non-big and/or 2) cost more than the equivalently impactful non-big. In other words, relative to non-bigs, for bigs replacement level impact might be lower and/or replacement level price might be higher.
- If that is the case, then a rational team should actually spend more on a big with +3.9 impact compared to a non-big with +3.9 impact.
See my "How to Value College Basketball Free Agents article for a more detailed walkthrough of the logic behind all of the above: https://nikoza2.substack.com/p/how-to-value-college-basketball-free. Curious to get your thoughts on where you would agree/disagree and/or where the better market data you have would contradict my own assumptions.
Thanks for putting some figures to what many of us have been feeling. Wondering if you can take some educated guess at the market value of an incremental win for various categories of teams: i.e. bubble, top 25, sweet 16 types, etc.