New Tool: Player Skill Projections
Unveiling a new feature at EvanMiya.com for quantifying player skill in every statistical category
With the 2024-25 college basketball season fast approaching, I’m very excited to announce the newest feature at EvanMiya.com: the Player Skill Projections tool! This is my favorite tool that I’ve built for the site so far, and it has taken a majority of the offseason to complete. Without further ado, let’s dive in:
The Tool In A Nutshell
The player projections tool takes each player’s game-by-game history and quantifies their skill level in every major statistical category (three-point shooting, rebounding, steals, etc.) by predicting how well they will perform in that stat moving forward. These projections adjust for important contextual variables across their career, including opponent strength, offensive usage, expected year-by-year improvement, and recent form.
You can find these evaluations on a player’s profile page, as seen below. At the top of the page, there is an assessment of their overall skills:
Further down the page, each individual skill has its own box, with a projected value for each statistic and a letter grade and percentile based on how the player’s projection compares to all other Division 1 players.
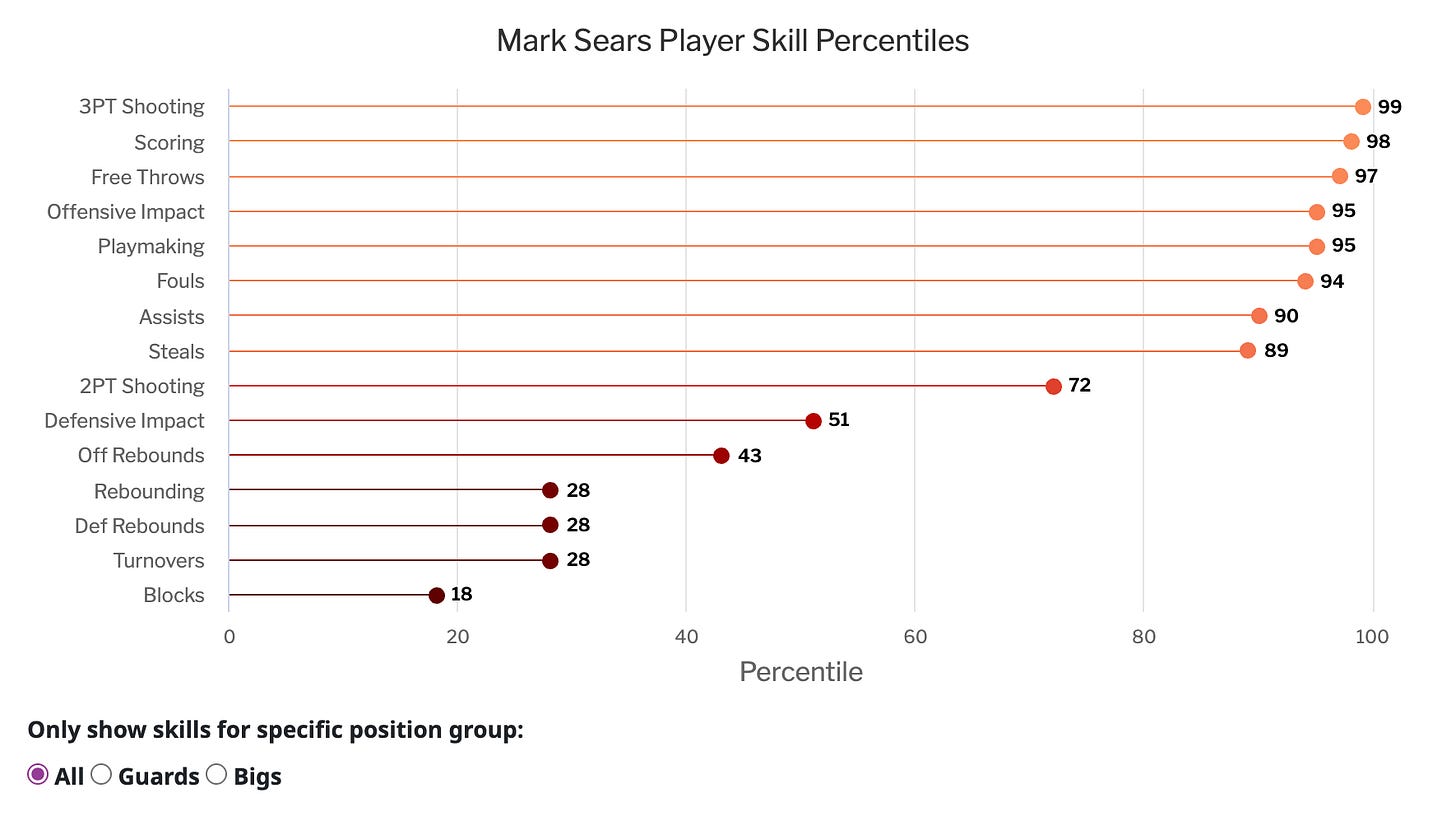
You can also visualize a player’s strengths and weaknesses in the “lollipop” graph, with every skill sorted from best to worst based on percentile.
To see more detail for a specific skill category, click the “expand” button to see a player’s career average, current projection versus an average or top 75 opponent, or projection adjusted for current usage. The graph at the bottom shows the player’s career progression in that skill, detailing how they have improved or declined over time.
To view more players at once, you can use the Player Leaderboard page to see projected values, grades, or percentiles for all players:
You can sort by any statistical category to see who the current top projected players are, or you can drill down to a specific team to see strengths and weaknesses in their roster (strengths in orange, weaknesses in blue):
Player and team names are now clickable everywhere on the site, so you can quickly navigate to a particular team or player more easily. Each team and player also has their own URL, making it easy to bookmark their pages and return later.
Why This Tool?
This new functionality will be essential for coaches and fans to properly evaluate player skills and predicted performance. Here are several reasons why this tool is so valuable:
1. Moving away from per-game stats to per-possession stats for players
Many people understand that points-per-possession is much more critical than points-per-game at the team level, as seen in the popularity of team efficiency ratings. However, we still commonly quote per-game player stats because it’s the easiest way to quickly understand someone’s statistical profile. But per-game stats conflate efficiency with volume, and their frequent use lead to biases towards players who play a lot and shoot a lot, regardless of their underlying skill level. Instead, using the player projections at EvanMiya.com will lead to more accurate assessments of skill that adjust for opponent strength, playing time, usage, and recent form.
Instead of saying that Caleb Love averaged 18 PPG / 5 REB / 3.5 AST / 41% FG / 33% 3PT last year, we can use his player profile to say that he’s an A- scoring volume, B- 3PT shooter, C 2PT shooter, and B in assists. Or, if you prefer, percentiles: 97 in scoring volume, 66 3PT, 36 2PT, and 85 assists.
2. Context-adjusted projections and player comparisons
Which player is a better three-point shooter? Player A, who shot 37% on 7 attempts per game at East Tennessee State, or Player B, who shot 40% on 2 attempts per game at Marquette? These types of player comparisons are common and require quick mental context adjustments to decide which is better. How much does the quality of the opponent matter? 40% is better than 37%, but is it better when you only attempt 2 per game? Player A only shot 28% in his freshman year, is that concerning or irrelevant now that he’s a senior?
Now, with context-adjusted projections at EvanMiya.com, we don’t have to rely on napkin math to figure out who will likely shoot better. Each player’s predicted three-point percentage on the site considers all these factors across every game of their career, giving each player a current-day projection against an average opponent.
Additionally, the underlying model handles how much weight we should give to recent form by automatically figuring out how to up-weight recent games and down-weight ones further in the past, specific to each statistical category.
3. Understanding player strengths and weaknesses quickly
The player profile page makes learning a player’s strengths and weaknesses effortless, whether it’s communicated through player grades or percentiles. The lollipop graph, in particular, provides an easy way to visualize all player skills, which can also be specific to either guards or bigs:
4. Identifying team roster makeup in a nutshell
The player leaderboard page makes it very easy to see the strengths and weaknesses of an entire roster by selecting a team and seeing the individual player grades, percentiles, or projected values. For example, Alabama has four players in the 90th percentile or better in three-point shooting heading into the season, and most of the roster is “Good” or “Very Good” in per-possession scoring volume.
5. Transfer portal player search
Once the next transfer portal cycle begins, the player projections tool will become invaluable to coaches searching for specific player profiles.
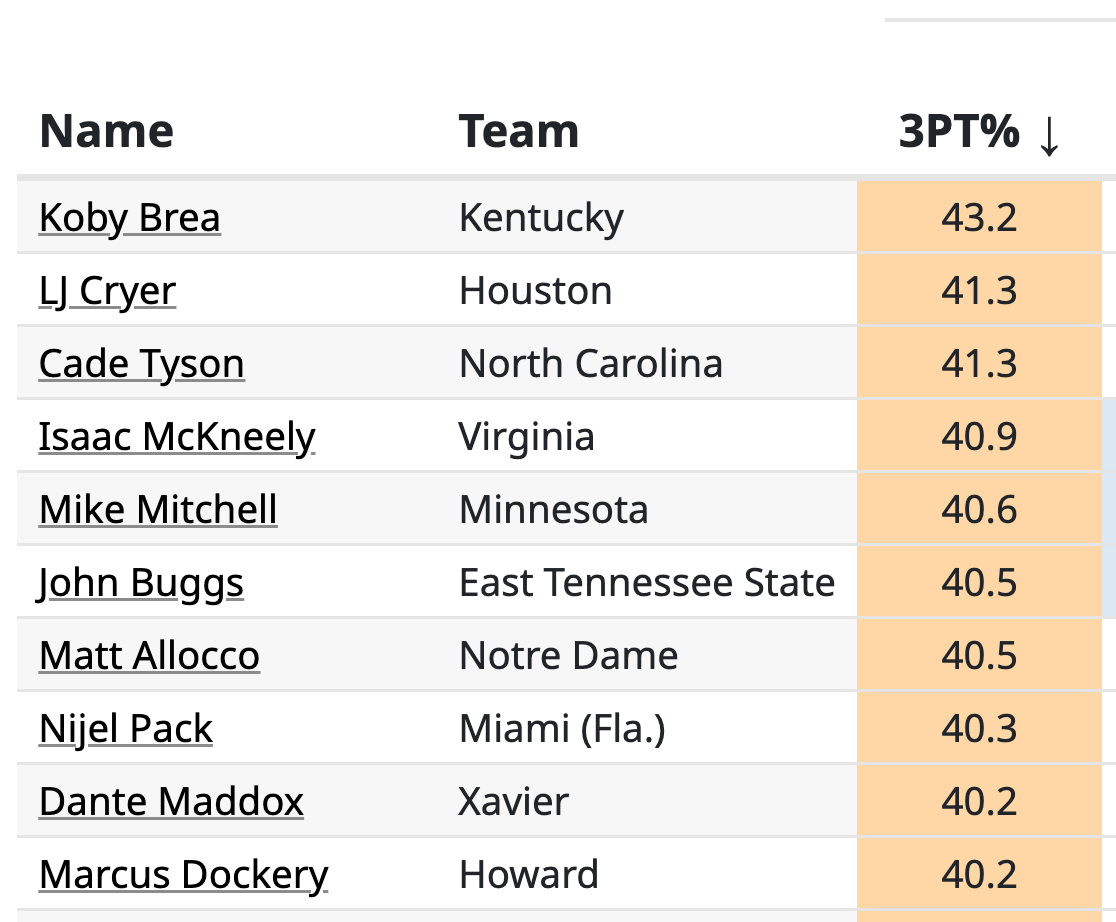
Are you looking for an elite three-point shooter? Instead of querying every player who shot at least 38% from three on 4 attempts per game last year, just sort the Player Leaderboard by projected 3PT% to see who the best shooters available are:
Need a point guard who can make plays for others without turning the ball over too much? Look for the top players in Assist Rate and pick out the players who have a letter grade of C- or better in Turnovers:
Methodology
For those who want the nitty-gritty on how these projections are formed, here are the details:
I use a dynamic linear model (DLM) specific to each statistic trained on over a decade of game-by-game data for every D1 player. Using a DLM fulfills several critical needs for this project: it can be trained on all of the data at once, it appropriately reacts to recent trends, it allows for other predictive variables such as opponent strength and player usage, it allows for prior distributions, it can form predictions for any time point in the future, and it comes with future prediction uncertainty as well.
Each stat-specific DLM is optimized to use the proper amount of emphasis on recent games compared to not-so-recent games to predict future performance in that category. For some player stats, the model is very responsive to recent form and will move quickly away from a player’s career average or prior baseline if the player is improving or declining quickly in that stat. These include assist rate and free throw percentage. For other stats, most notably, three-point percentage, recent form doesn’t mean as much in predicting future performances, and the projection will weight a player’s performance 20 games ago more similarly to yesterday’s game.
Like bayesian modeling, every player has a prior distribution that they start with before playing any games. A player’s prior mean and variance for a given stat are primarily determined by their composite recruiting rating and position coming out of high school. For some stats, the prior becomes quickly irrelevant to the current projection after about half a season of games. For others, such as three-point shooting, it carries a lot of weight, even deep into a player’s career, to not overreact to super hot or cold performance. For example, Reed Sheppard shot over 52% from three in his only year in college, but his final projection was a bit lower: 42%, which was still 2nd best in the country. If Sheppard had played longer in college, his three-point shooting would have likely regressed toward the low 40s, as three-point shooting can be wildly different from year to year for any player.
The model adjusts for each game's contextual variables: opponent strength, offensive usage, and minutes played. A player’s free throw percentage is also used in the case of three-point shooting projections since FT% is often a good indicator of potential outside shooting skill.
I’ve spent a lot of time trying to properly adjust for offensive usage, specifically since there’s a prominent belief that when a player has a more significant offensive load, his individual efficiency in most categories will decrease, and vice versa. While I found this to be true in my modeling, it didn’t have quite as much of an effect on the future predictions as I expected, especially for three-point shooting. For example, if a player like Trae Young, who took an absurd number of outside shots per game, only had an average game usage, his predicted 3PT percentage only goes up by about 1.5%. Many expect that if you take a high-usage player and put him on a better team where he doesn’t have to carry the load as much, his shooting percentages will improve. This is true, but realistically, it’s hard to find a sample size large enough for these kinds of scenarios for the model to adjust to it in more than a small way. I’m not done studying this, though, so future improvements might be coming.
Year-over-year growth is baked into the projections based on how much a player typically improves in a statistical category from freshman to sophomore year, sophomore to junior year, and so on. When future season projections are formed, such as the ones currently available on the site since no games in 2024-25 have been played yet, these predicted jumps in skill are applied where appropriate.
What’s Next?
Wait, there’s still more coming? Yes 😏. The player projections tool is just Part 1 of the new features that are a part of EvanMiya.com for the new season. The lineup grades and optimizer tool will be launched Friday, November 8th, just a few days after games get going. All of these tools are available for Premium subscribers at EvanMiya.com, so please enjoy these features and support my work by grabbing a subscription over there. In the meantime, I’ll post more highlights and insights from the new tools on Twitter/X and via video on TikTok and Instagram.


