EvanMiya.com Game Predictions Strategy
Breaking down how we produce game predictions and performance against public Vegas lines
10/30/2025 update: After some slight model tweaks this summer, all tables, numbers and graphs have been changed to reflect the current model.
This article gives a summary of the EvanMiya.com Game Predictions algorithm, notes the performance of past game predictions compared to public Vegas lines, and presents an approach for knowing in which cases our game predictions have an advantage over Vegas.
Our game predictions are based on many variables, including each team’s offensive and defensive strength according to our advanced statistical model, home court advantage, expected number of possessions in the game based on each team’s estimated tempo, uncertainty in how each team will perform, and, for all games occurring in the near future, adjustments for current injured players.
On the Game Predictions page at EvanMiya.com, we have daily updated game predictions going out at least 3 weeks into the future. For games that are happening today, we typically update the page before 7AM EST to include current Vegas lines, along with any “best bets” that our algorithm has picked (more on that below). The Vegas lines are typically refreshed a few more times during the day, along with any game prediction changes based on significant injury report updates.
Changes for 2023-24
The game predictions algorithm has received a big overhaul in the summer of 2023. All numbers referenced in this article use the new system and may not exactly match previously posted numbers from past seasons.
In addition to the variables mentioned in the previous section, we now also evaluate several contextual team variables that predict how a team will fare against other styles of teams. Each team has a base predicted future efficiency rating that determines how well they would play against a random opponent in a future game. Once a baseline rating for each team is established, there are several team-specific variables calculated that factor into each game prediction:
Opponent competition adjustment: This variable measures how well each team performs above or below expectation based on if they are playing a really good opponent or a really bad opponent. There are some teams that perform better than anticipated when they face really tough teams but struggle to dismantle teams that are worse than them. This concept is sometimes referred to as “playing up/down to competition”. Other teams are the opposite, in that they can easily crush inferior opponents but are disappointing against high quality teams. Each team has a variable that measures where they are on this spectrum of playing up or down to their competition.
Opponent tempo adjustment: In a similar vein to the previous variable, this measures how well each team performs above or below expectation in games that are played at a higher or lower pace than usual. Some teams perform slightly better when they play in up-tempo games, and some teams are more comfortable in slow-paced games. Each team has a variable that measures how their game performance changes based on the expected pace of play in a game.
Recent Form: This variable measures how well each team has been performing lately, putting higher weight on games played recently and down-weighting games further back in the season.
Consistency: This variable measures how consistent each team is from game to game. Some teams are more consistent, meaning that their game outcomes are often pretty close to the predicted outcomes for each game, while other teams have really good and really bad games all over the place. This variable doesn’t affect the game predictions too much, but it does affect how much uncertainty we have around each game prediction. If two inconsistent teams are playing against each other, expect the final result to be more unpredictable.
Backtesting
For every season going back to 2020-21, we started out by creating preseason projections as if the season had not started yet, and then day by day predicted each slate of games to mimic what our game predictions would have been at that time. One caveat worth noting is that there was no injury adjustments in these historical predictions, which means that these game predictions perform slightly worse in this experiment than they will in future games when we have current injury information.
The table below shows the mean absolute error and bias for spread and over-under predictions for each season:
The spread predictions are much better than the over-under predictions, which is not a huge surprise considering that we have spent way more time fine-tuning the spread predictions model.
Comparing to Vegas Lines
We also imported historical Vegas lines at the time of the start of each game in order to compare to our own game predictions. All lines come from Caesar’s Sportsbook or DraftKings.
The table below shows all Against The Spread (ATS) results for our predicted game spreads across all seasons, when compared to Vegas:
We are not including any over-under comparisons to Vegas because we don’t think they are as valuable.
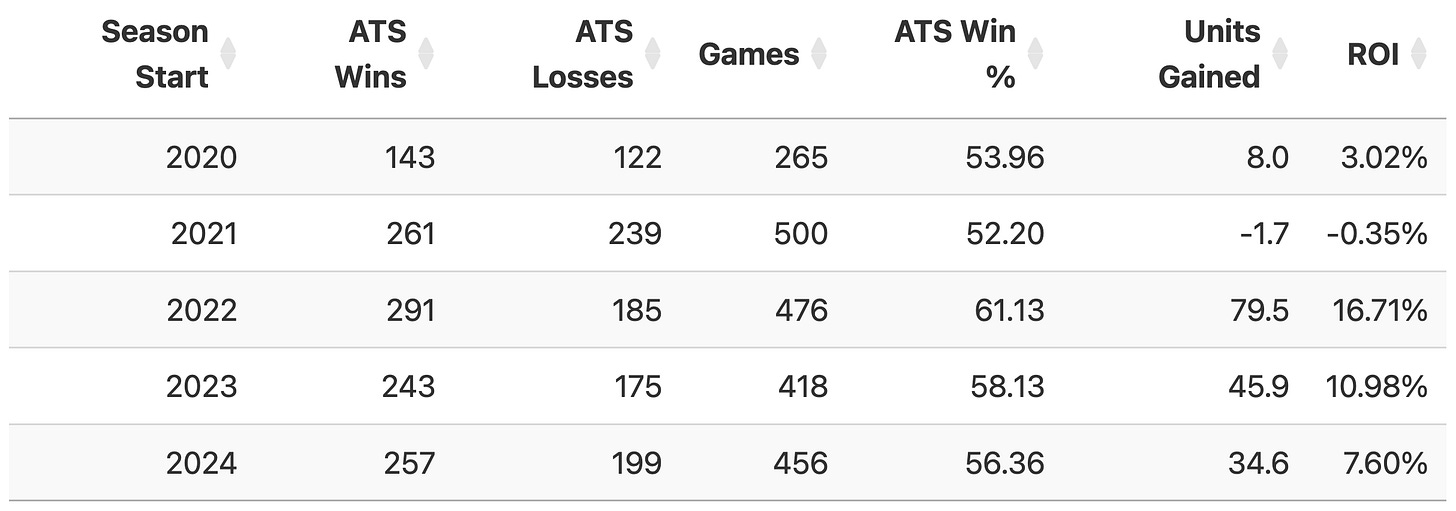
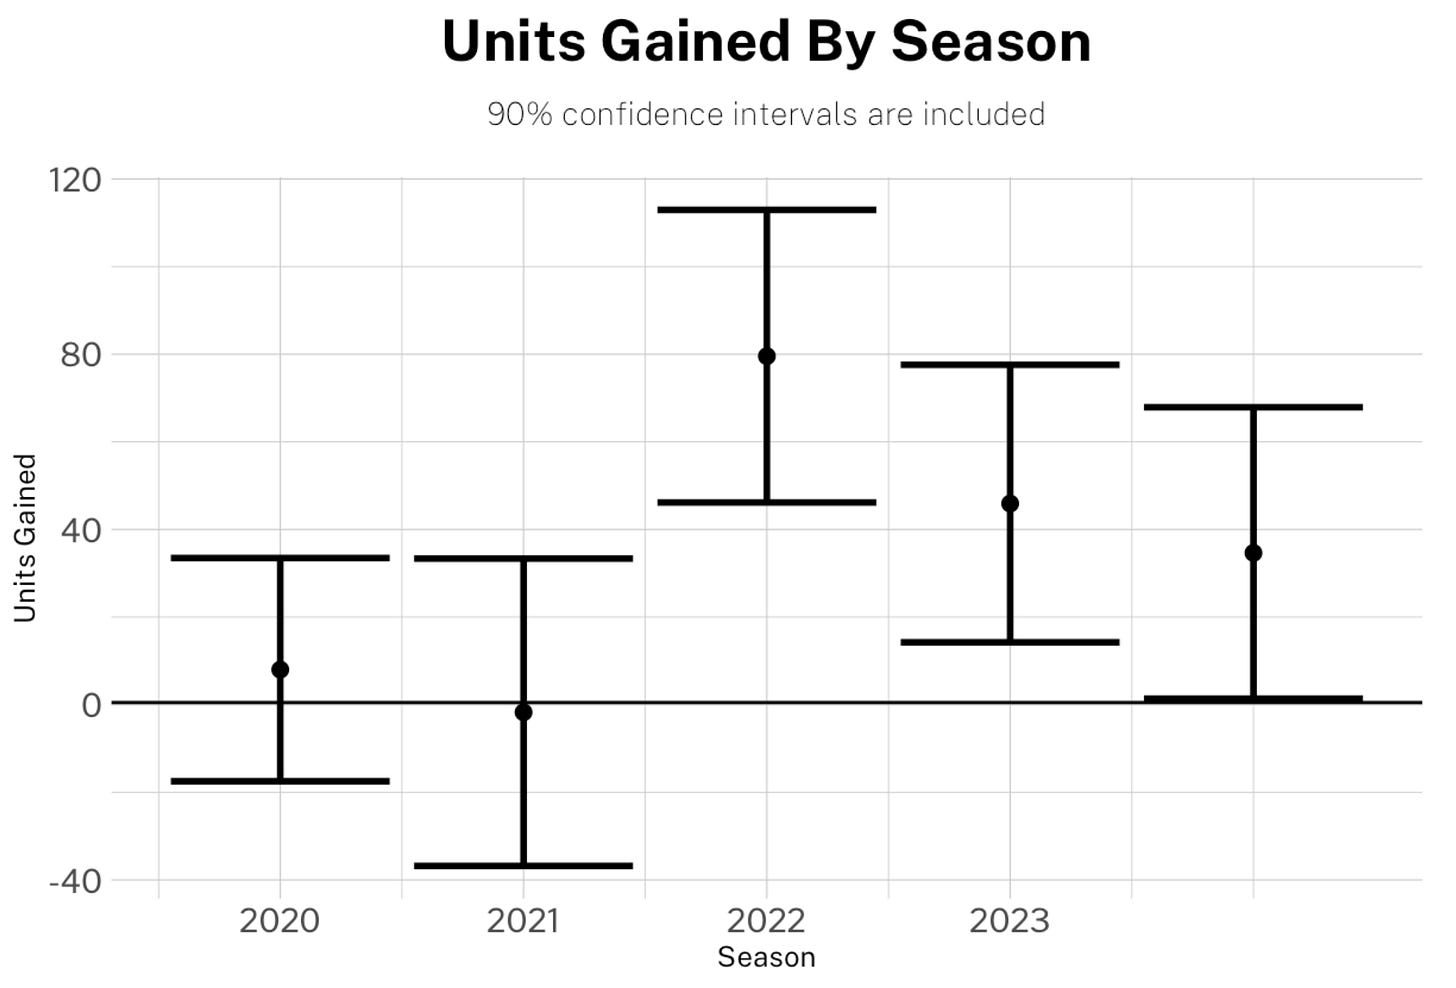
The table below shows (ATS) results for our predicted spreads, for each season individually.
Determining “Best Bets”
Based on analyzing the performance of all historical game predictions against Vegas lines, we developed a “confidence score” for each game, which is a measure of how confident we are that betting against the spread will win. All games with a confidence score of at least 1.0, we deem a “best bet”. Just like before, we back-tested the performance of these best bets to see how they would have performed historically using only the information available before the game started.
Any numbers referenced going forward represent how the new algorithm would have fared during previous seasons using backtesting. You can see the actual best bets record from the algorithms available at the time on the Game Predictions page at EvanMiya.com. The table below shows the overall ATS performance of the “best bets” vs Vegas lines across all seasons:
The table below shows the overall ATS performance of the “best bets” vs Vegas lines, for each season individually.
Digging a Little Deeper
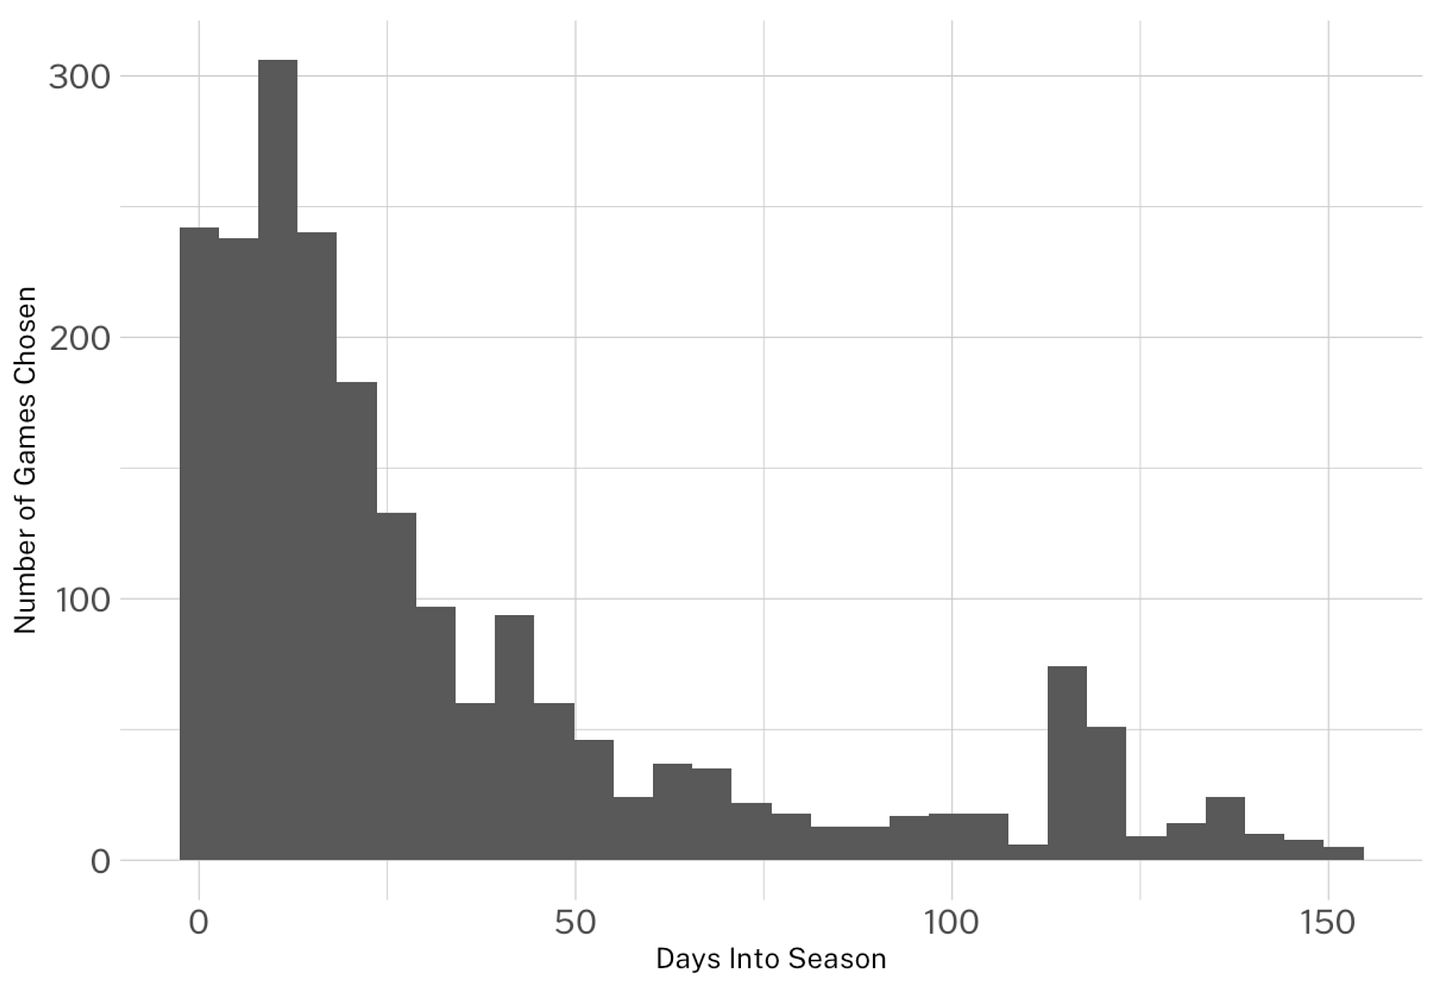
The main way that our game predictions have an edge over Vegas spreads is early in the season when there is more uncertainty about how good each team is. Our cutting-edge preseason projections, which incorporate a whole suite of advanced player projections based on individual impact, lead to a smarter prediction model than Vegas, especially early on in the season. The histogram below shows the number of games chosen by our best bets model as the season progresses. You’ll notice that we pick a lot more games in the first month or two of the season. In fact, 65.2% of the best bets are picked in the first 30 days of the season. That’s when our model has a big advantage.
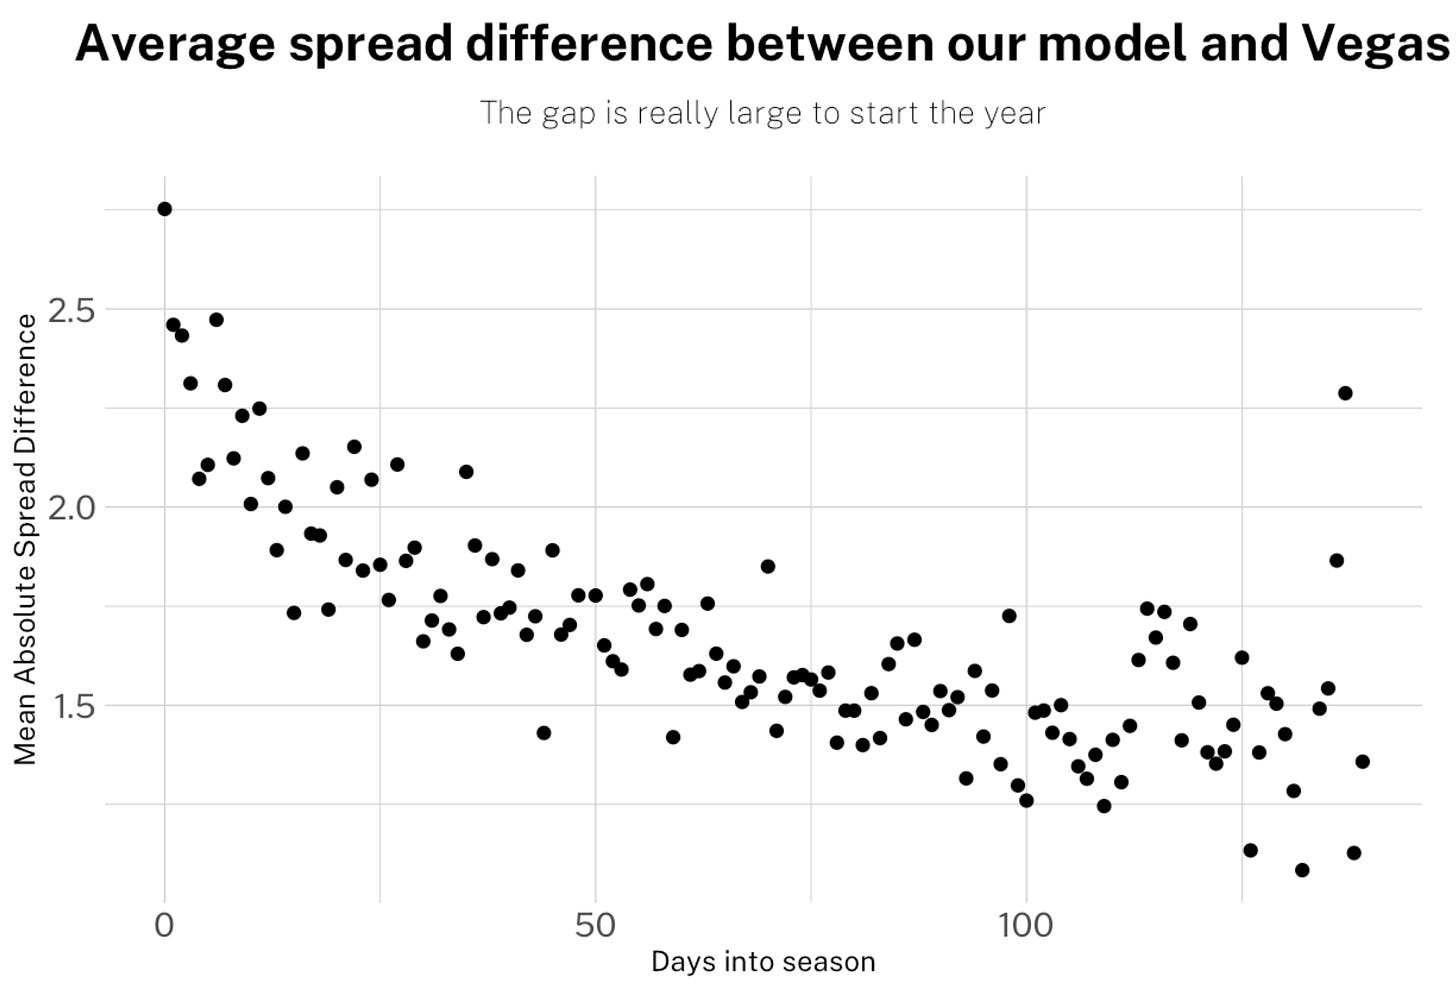
As the season progresses, it becomes easier for Vegas to know how good each team is because we have more of a sample size. This means that by the end of the season, there isn’t as much of an advantage for our game predictions because the differences in how our model evaluates each team compared to Vegas get smaller. This illustrated by the graph below, which shows the average difference between our predicted game spread and the posted Vegas spread, based on how many days into the season the game is.
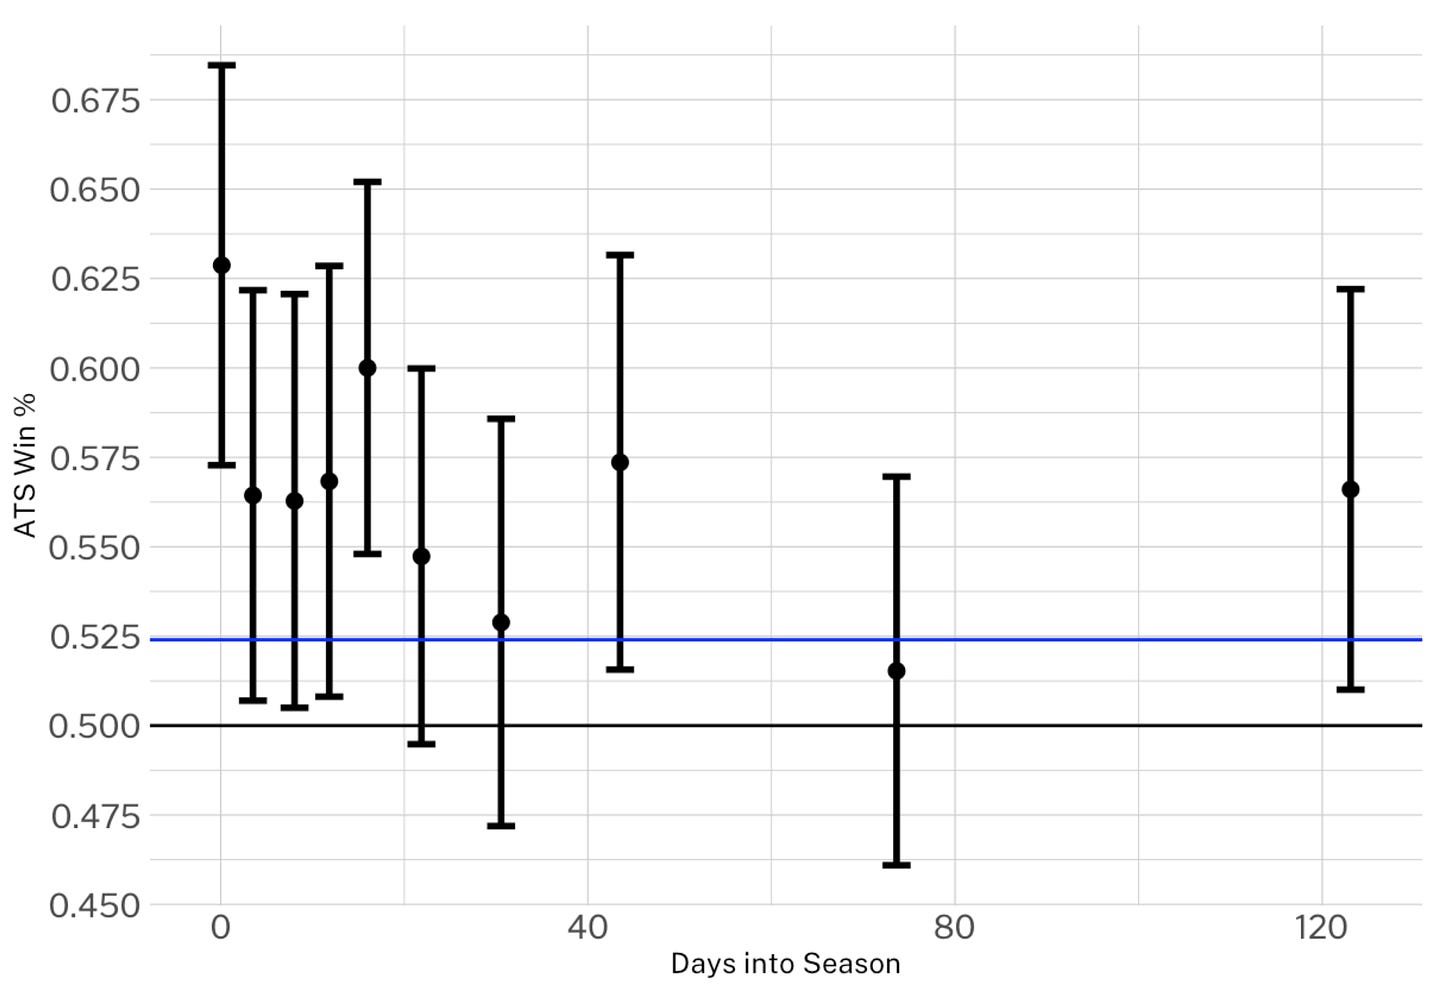
The graph below shows how the best bets model has performed versus Vegas in terms of ATS Win %, based on how many days into the season the game predictions are happening. The black line is 50% and the blue line is 52.4%, the break-even percentage for -110 odds, which are typical. Confidence bands are included to capture 90% confidence intervals around each percentage.
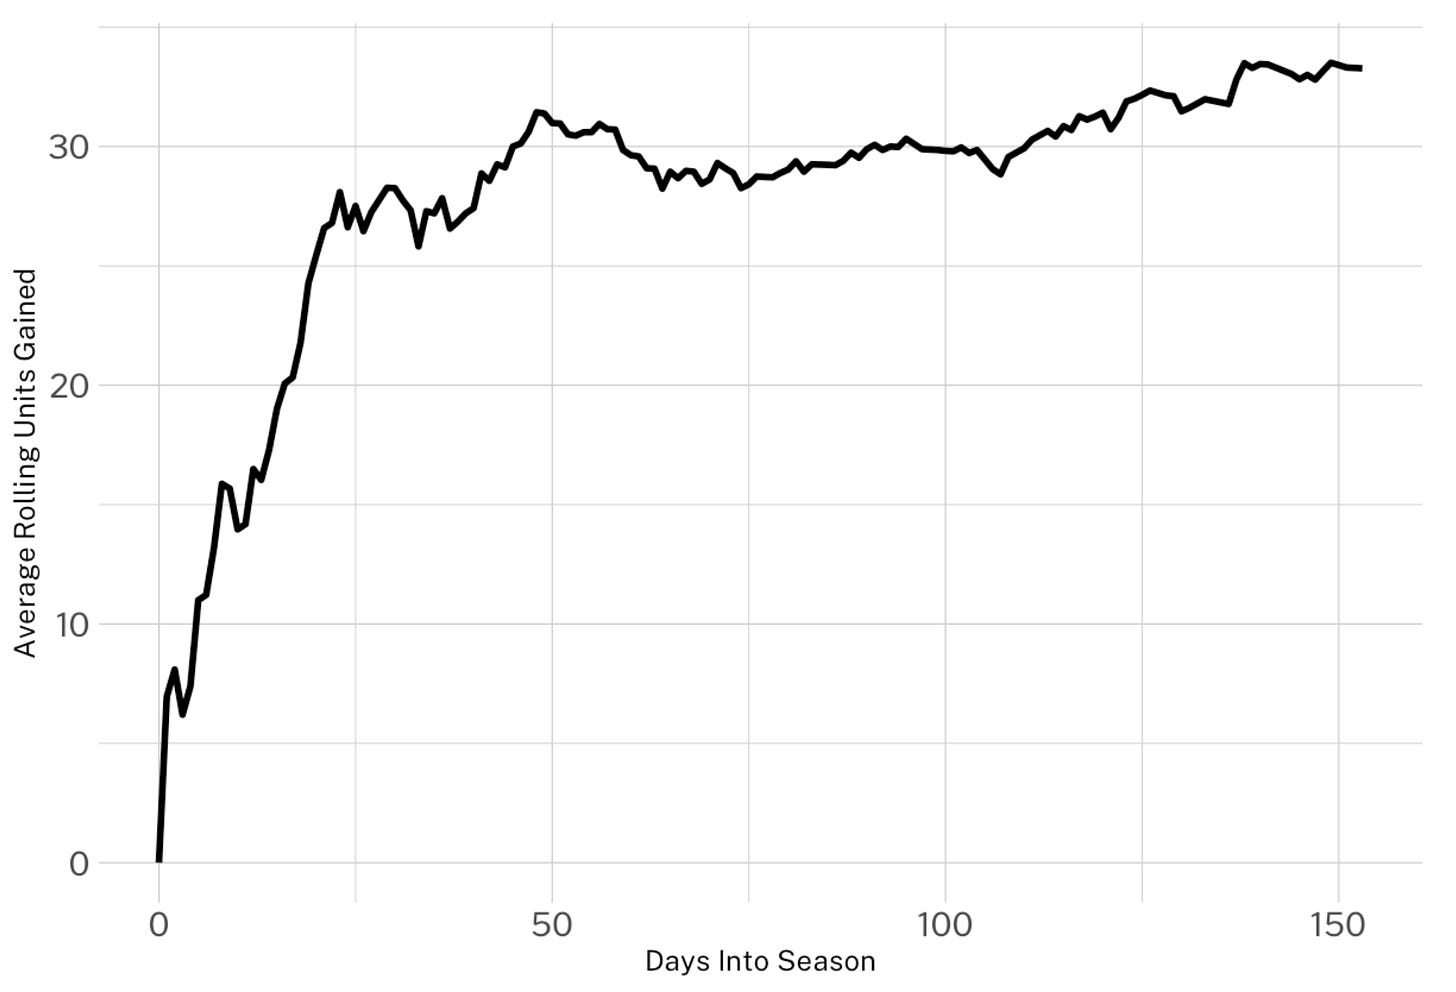
If we were to have placed one betting unit on each game recommended by the “best bets” model over all seasons, the plot below shows the average rolling betting units gained as the season progresses. This assumes standard -110 odds for all bets. When averaging across all seasons, this would have led to around 33 units gained by the end of the season.
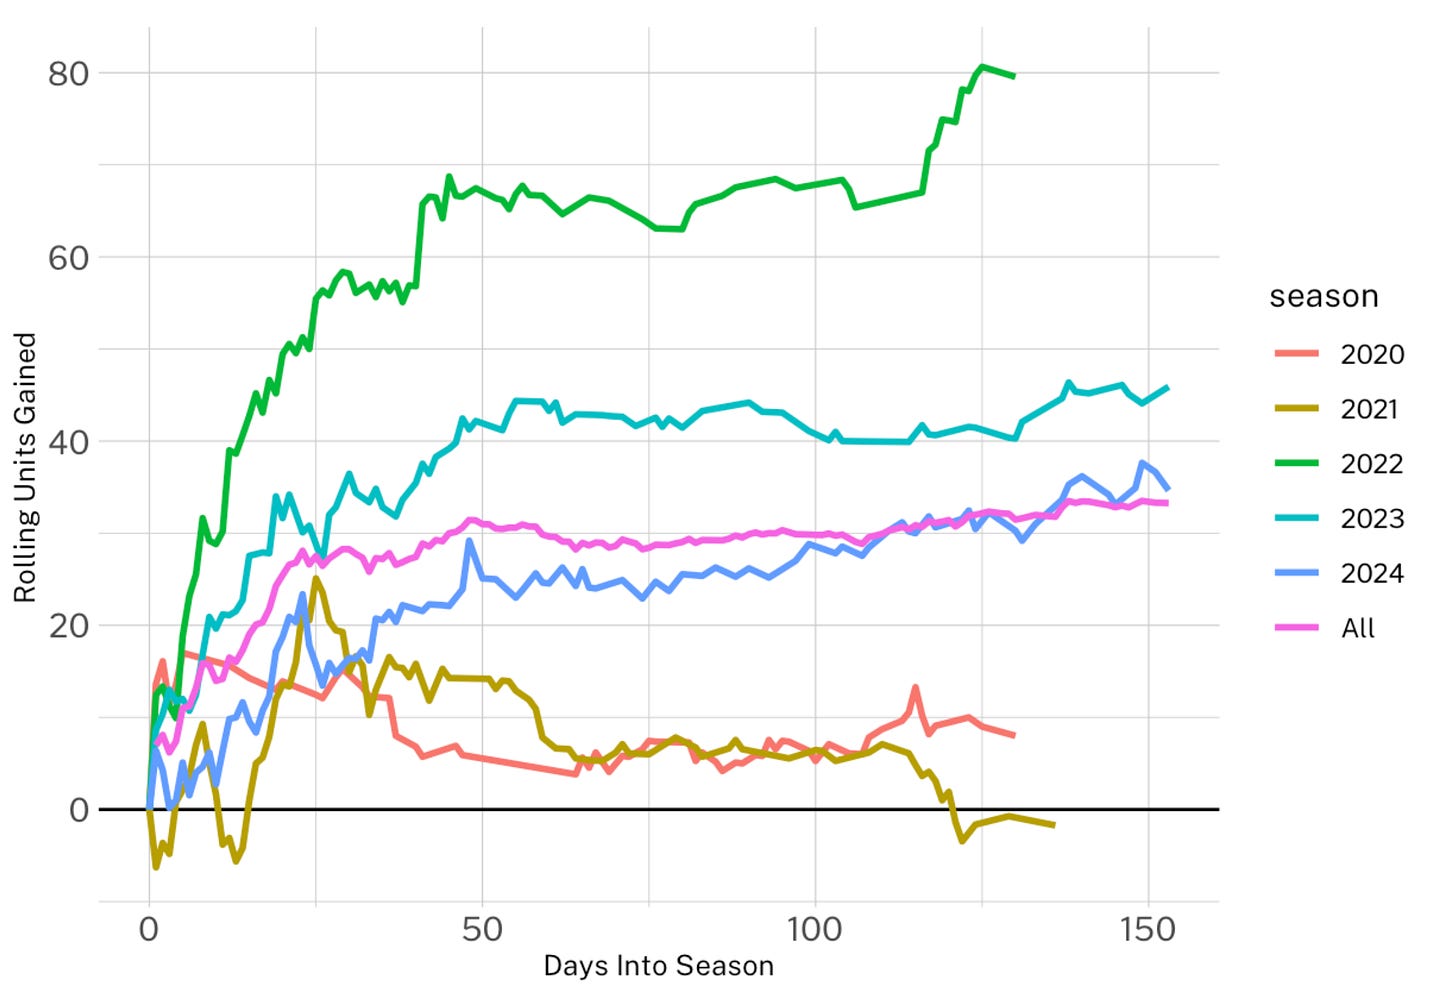
The plot below shows the rolling units gained for each season, with the pink line representing the average of all the seasons:
More Notes on Early Season Emphasis
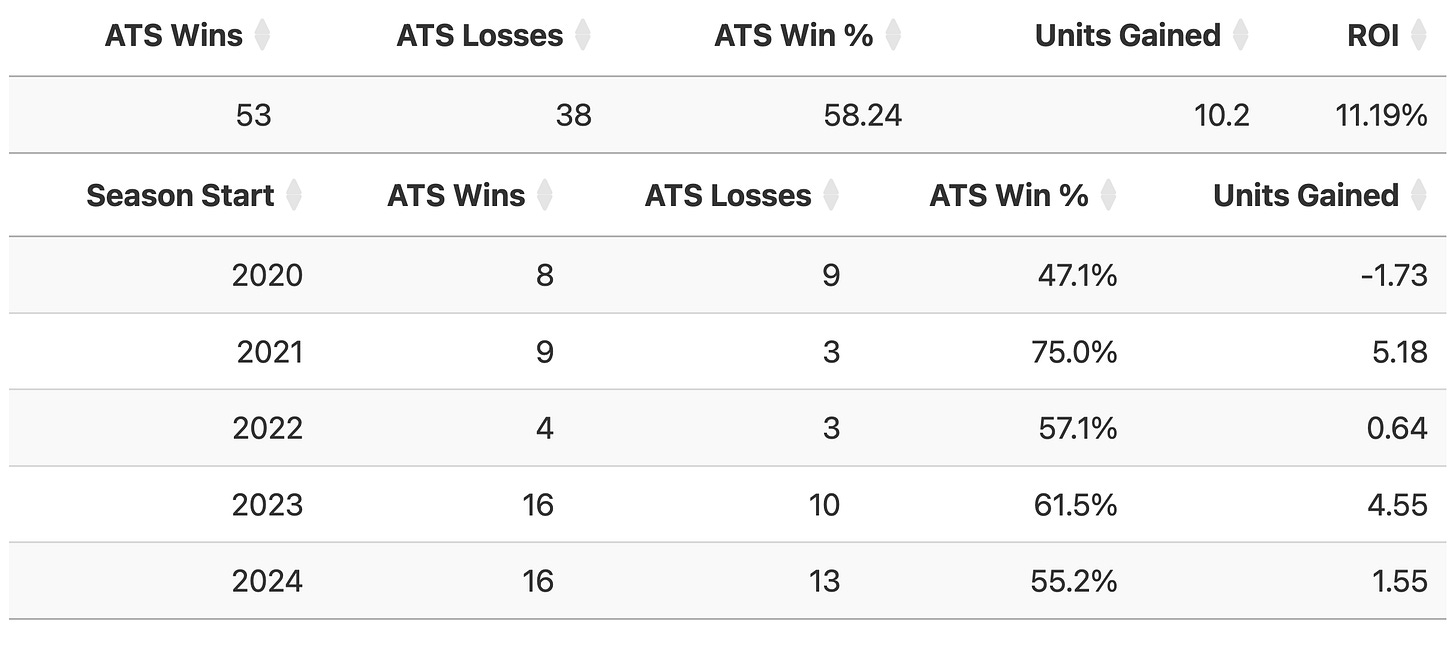
Because almost all of our selected best bets occur in the first month of the season, smart bettors need to concentrate most of their effort in this time frame while the advantage over Vegas lasts. The first day of the season typically has a ton of best bets. The table below shows the historical best bets record across all seasons on the first day of the season:
The table below shows the historical best bets record across all seasons during the first week (7 days) of the season:
Favorites vs Underdogs
A majority of bets are placed on underdogs. The table below shows the performance of bets placed on favorites versus underdogs:
Late Season Bets
Our game predictions model has also had success during March Madness. Though we don’t have as large of a sample size as we do for early season regular games, we have made a best bets algorithm specifically for the NCAA tournament, which we will use in future years when March comes. The March Madness best bets record since the 2020-21 tournament is shown below.
Full Historical Dataset
Finally, we have made the full historical dataset used for this analysis available here.
Stay tuned for a future post that will fully break down the new ground-breaking changes we have made to our team ratings model.


