EvanMiya Tools Deep Dive: Texas Tech
Analyzing Texas Tech's player and team metrics using tools at EvanMiya.com.
After a fan vote, Texas Tech has been selected as the free team of the month at EvanMiya.com, which means that everything on Texas Tech is completely free to the public for December. Let’s use this opportunity to showcase some of the tools available at EvanMiya.com, focusing on Texas Tech.
Player Analysis
The easiest way to dive into player metrics at EvanMiya.com is to use the Players page within the Team Breakdown section. The next several anecdotes and corresponding images come from that page.
Joe Toussaint Is The Offensive Engine
The current leader for Texas Tech in Bayesian Performance Rating is Joe Toussaint, which means that he’s predicted to be the most impactful player going forward for the team. BPR measures overall player value on a per-possession basis on offense and defense, using a combination of individual box score stats, advanced on-off metrics, and some historical information about each player to get the most stable estimate of predicted performance.
It’s Toussaint’s offensive value that really sticks out:
He has the best Offensive Box BPR on the team, which means that his individual offensive stats are the most efficient of any Red Raider.
He leads the team in Adjusted Team Offensive Efficiency, with Texas Tech scoring 114.3 points per 100 possessions while he’s on the floor, adjusted for opponent strength faced.
The team is 27 points per 100 possessions better offensively when he’s on the floor compared to on the bench (small sample size so far, but extremely noteworthy).

Every teammate is performing better than his individual averages when on the floor with Toussaint.
Lineup Analysis
The Team Breakdown tool has two different lineup-focused pages that show the performance of every 2-man, 3-man, 4-man, and 5-man lineup in terms of on-court efficiency, adjusted for opposition strength faced by each individual lineup.
Unlocking Lamar Washington
Lamar Washington currently ranks as Texas Tech’s 7th best player according to BPR, and his on-court impact on team offensive efficiency has been lacking in particular. The team is averaging 93 points per 100 possessions offensively with him on the floor, compared to 117.4 PP100 on the bench, after adjusting for opponent.
Looking at the Teammate Chemistry page provides some interesting insight into how Lamar is faring on the court with other teammates. He’s featured in Texas Tech’s four worst-performing teammate duos, the only four above 60 possessions played to be outscored by the opposition on a per-possession basis.
However, Texas Tech’s best-performing teammate duo is Lamar Washington and Warren Washington on the floor together, which is in stark contrast to Lamar’s other teammate combinations. Not only is Texas Tech outscoring opponents by almost 30 points per 100 possessions when both Washingtons are on the court together, but the pair has the highest Weighted Chemistry on the team, which is a metric that measures how much better than average a pair of players performs when they are on the floor at the same time. The sample size is still relatively small, but watching how Lamar and Warren perform together will be interesting to monitor going forward.
Efficient Lineups Are Being Utilized The Most
Texas Tech is optimizing lineups really well so far this season, with many of the most efficient player combinations also getting the most playing time. For example, the plot below shows the performance of all 3-man lineups with at least 75 possessions played this season. The color of each circle represents how efficient that lineup has been (lighter is better), and the size of each circle represents the sample size for that lineup. Many of the best-performing 3-man combinations are also being used the most, and the lineups that aren’t as efficient are lower in possession count. It’s not always the case that a coaching staff is deciding player rotations most efficiently, so Texas Tech deserves credit here.
Finally, the table below shows Texas Tech’s most used 5-man lineups. Gleaning information from 5-man lineups this early in the season is often dangerous because of how small the sample sizes are (Texas Tech’s most-used lineup has only played a little over 40 minutes together). However, the table is included below:
Keys To Victory
The Keys To Victory page is a revolutionary new tool for understanding the metrics that are most important to each team’s success. An automated report page provides a detailed analysis of these keys to victory for a team. There is even more customization possible in the Table and Explorer pages.
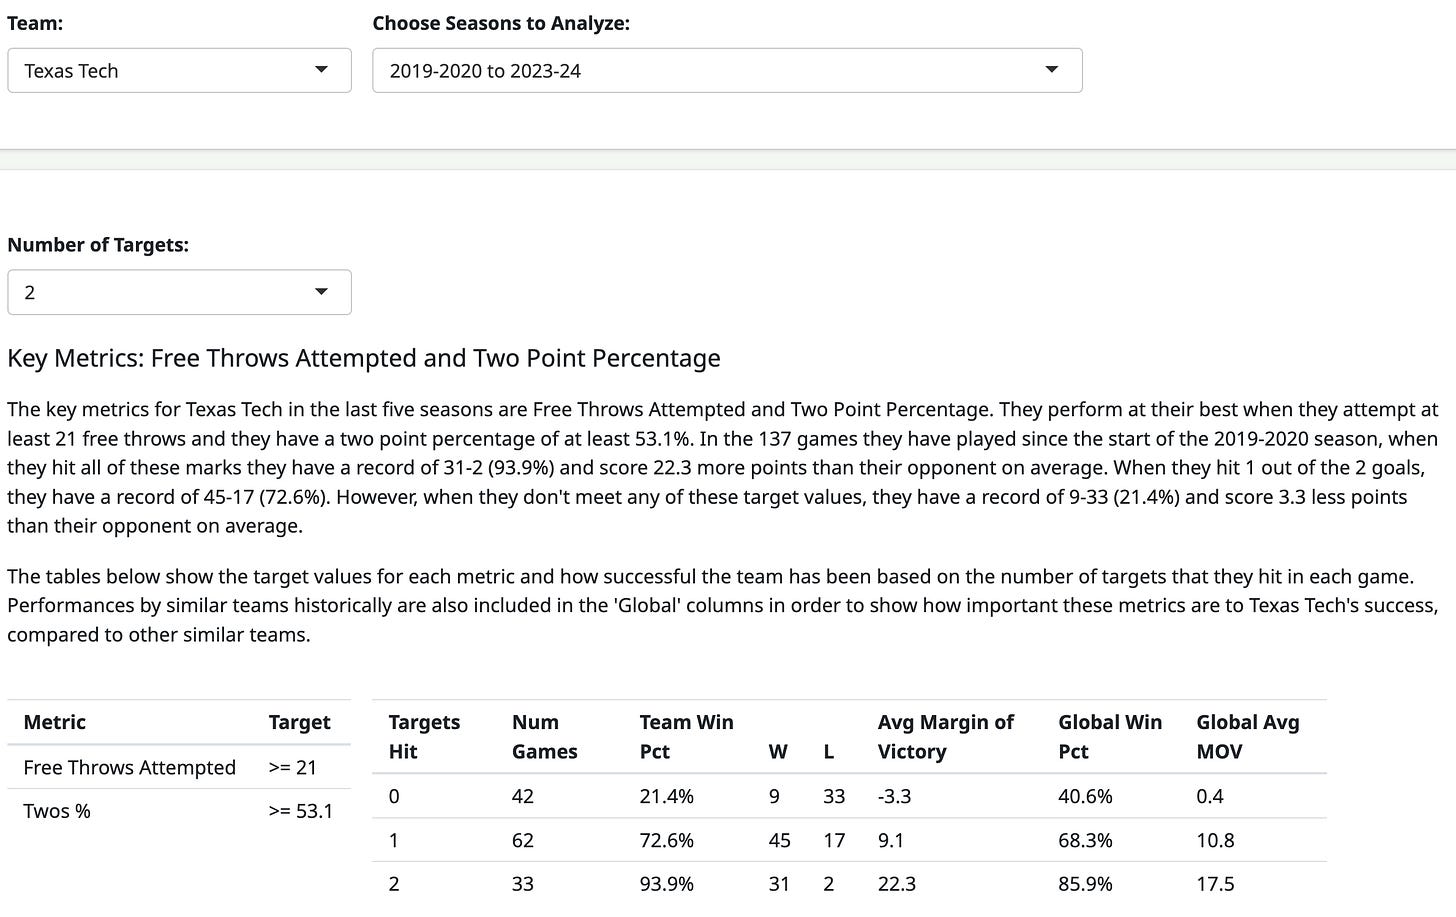
Though Texas Tech has a new head coach this season, it’s still important to know which parts of the gameplan have been most crucial to the Red Raiders winning games over the last several years under previous regimes. Over the last 5 seasons, including 2023-24, two of the most important Texas Tech team stats determining success in games are free throws attempted and two-point field goal percentage. As seen in the report below, there are target values that the team wants to hit in each game: shooting at least 53.1% from inside the arc, and attempting at least 21 free throws in a game. When the team hits both of these targets in a game, they are 31-2 since 2019, outscoring opponents by more than 22 points per game. When they miss both marks, Texas Tech only wins 21% of the time.
These key metrics have been more important for Texas Tech than they have been for other similar teams. The Global Win Percentage and Global Average Margin of Victory columns in the table above show that the change in performance for other teams based on how they perform in these two categories is not as drastic as for the Red Raiders.
So far this season under Grant McCasland, these two statistical targets have remained significant. The table below shows how the team has fared in hitting these targets in each game this season. In the three games that Texas Tech has met both marks, they are 3-0 this year, including their dominant win over Michigan.

The graph below shows each game since 2019-2020 based on how many of these two-point percentage and free throws attempted goals they hit in a game. The X-axis shows the margin of victory in the game, and the Y-axis shows how many of the metric targets they achieved.

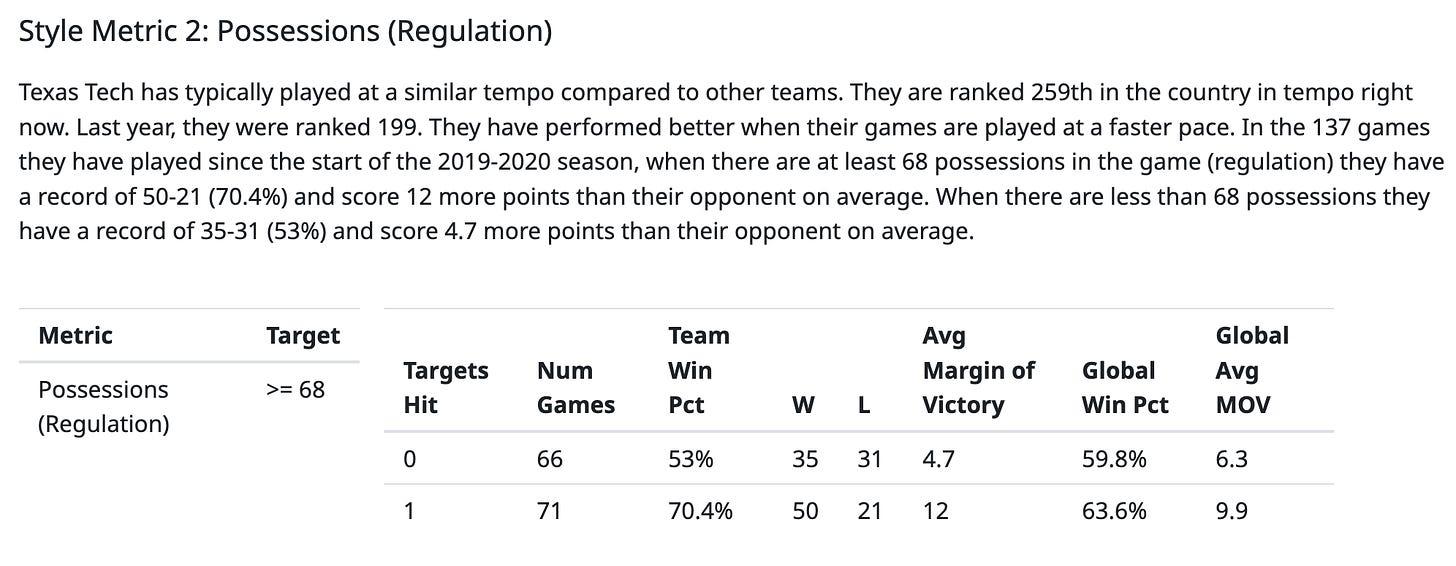
One other interesting fact that comes from the Keys to Victory Report is that Texas Tech has performed significantly better in faster-tempo games in the last 5 years. Though the team has not been a high tempo team on average, the Red Raiders have won a much larger percentage of their games when at least 68 possessions are played (70.4% wins), compared to just 53% wins with games under 68 possessions. The jump in the margin of victory in higher possession games also illustrates this point.


